Rhumbline network
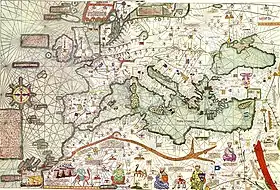
A rhumbline network, more properly called, a windrose network, (for its windrose lines shouldn't be confused with the false friend: rhumb line). Is a navigational aid, consisting in multiple lines, drawn on early portolan charts dating from the medieval to early modern period. This network is like a web (see picture) forming a grid on the map. A better term to be used for those lines would be "windrose lines" ("lines of rhumb" or "lines of course") for they do not follow the outline of the modern rhumb lines (loxodromes), due to the non-existence of map projection in 13th-century maps.[1]

.jpg.webp)
The lines are not true rhumb lines in the modern sense, since these can only be drawn on modern map projections and not on 13th-century charts.[2] They were close to true rhumb lines in the Mediterranean area but highly inaccurate in the Teixeira planisphere and the other planispheres drawn in any pre-Mercator projection.
The grid can be easily spotted (as parchment is quite translucent) by observing the map from its rear face, with a light source illuminating the other side. The hole in the center of the circle, origin of the whole network, is also clearly visible from the rear.[3]
Use of windrose lines on a rhumbline network
To calculate on a portolan chart the course to follow from a point of origin to a point of destination, one should transfer — using a parallel rule — the "line of course" drawn from the point of origin to the point of destination, on top of the windrose line on the compass rose closest to the ship's position, obtaining on it the theoretical course to be followed when sailing towards the destination. This theoretical course may have to be modified (as many times as needed) when tacking if the wind is right ahead of you, or to correct the effects of leeway, currents, etc. that a sailor with experience should be able to calculate empirically.
Rhumblines vs. windrose lines
Before modern accurate surveying, there was no method for measuring longitude at sea so maps used to have many distortions, especially in the east west direction. There was also distortion due to the curvature of the Earth's surface. The multitude of compass roses with straight lines extending outwards across the map derived from how the maps were then made by compiling empirical observations from navigators who attempted to follow a constant bearing at sea.[4]
All portolan maps share these characteristic "windrose networks", which emanate from compass roses located at various points on the map (or mapamundi). These better called "windrose lines" are generated "by observation and the compass", and are designated today as "lines of course" or "lines of rhumb" ("rhumb lines" in the fourteenth century, traced on portolan's particular projection, though not to be confused with modern rhumb lines, meridians or isoazimuthals).
To understand that those lines should be better called "windrose lines", one has to know that portolan maps are characterized by the lack of map projection, for cartometric investigation has revealed that no projection was used in portolans, and those straight lines they could be loxodromes only if the chart was drawn on a suitable projection.[2]
As Leo Bagrow states: "The word ("Rhumbline") is wrongly applied to the sea-charts of this period (Middle Age), since a loxodrome gives an accurate course only when the chart is drawn on a suitable projection. Cartometric investigation has revealed that no projection was used in the early charts, for which we therefore retain the name 'portolan'."[2]
Network design

Pujades in his book "Les cartes portolanes" has a chapter with all known theories and, with the aim to clarify the controversial arguments, he shows an image of Petrus Vesconte drawing a portolan chart in which it is visible how he started by drawing first the rhumbline grid. Some authors call it "winds network" instead of using the term "rhumbline network" or "network of rhumblines".[5][6][7]
The circle is divided into sixteen equal parts defining a hexadecagon, then the network of sailing directions is drawn "for a set of 16 wind roses", placed in the 16 vertex of an hexadecagon, in groups of 16 "straight lines" called "rhumblines" (on 13th-century charts). From each vertex, 7 rhumblines are projected towards the hexadecagon's interior connecting "in an alternated pace: skipping 1 of every 2 vertex", that means => to 7 of the vertex opposite to it, but without routing any line to connect that vertex to the other 8 intermixed vertex (keep in mind: 7+8+itself=16 vertex). The remaining 9 rhumblines (to complete the 16 winds) are projected from each vertex towards the exterior of the hexadecagon, although in some portolans those 9 lines do not appear.[7]
The lines of the courses for the eight main directions (or winds) are drawn with black ink (or sometimes gold); the eight intermediate directions (half-winds) are drawn in green; and in the case of a 32 winds rose, the sixteen remaining (quarter-winds) are drawn in red. The intersection of this set of "rhumblines" determine on the portolans a varied pattern of symmetrical squares, parallelograms, trapezoids and triangles.[3]
Vellum map creation process
The process for a vellum chart creation used to be as follows:
- They prepared a vellum of good size, or several pieces of vellum glued together.
- They drew a well-centered hexadecagon (or two linked by a vertex) with a network of 16 lines per vertex (with the different colors mentioned above: black, green and red).[7]
- They copied on top of the grid the coasts lines trying to let the 16 vertex in visible places, as shown in Vescomte's portolan picture with its rhumbline network drawing a 16 vertex regular polygon (hexadecagon) that is perfectly centered on the parchment.
- In the case of the Mediterranean sometimes contained two hexadecagons and has the two opposite corners matching what is called the "portolan diaphragm " (axis of the Mediterranean .. or parallel of Rhodes).
- Finally they labeled and decorated the whole vellum with more or less profusion.
Planispheres with double hexadecagon
In large planispheres, especially those containing the oceans (World Map), the cartographer used to draw two hexadecagons with the two opposite corners superimposed in the center of the vellum. There are plenty of mappae mundi that use the double-hexadecagon rhumbline networks but they can not be considered portolan charts since they do not have any ports indicated on them.
In the Cresques planisphere one is able to read the names of those lines which were winds: tramontana, levante, ponente, mezzogiorno, greco, sirocco, and lebegio. When limited to small seas, planispheres approximately follow both rhumb lines and great circles. But on big oceans they do not follow either of them, due to the imprecision of the map making of that time, corresponding more or less accurately to rhumb lines only in the Mediterranean portolan charts and deviating greatly in the Texeira planisfere (among others).
Double hexadecagon in Cantino's planisphere
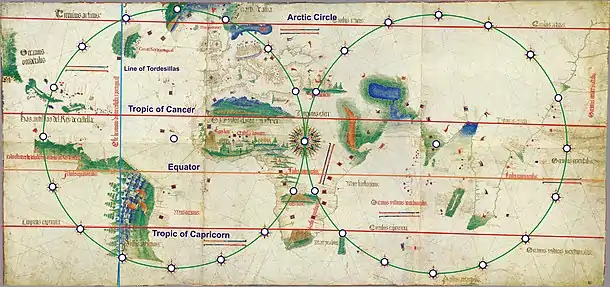
Double hexadecagon in Texeira's planisphere

See also
References
- Leo Bagrow (2010). History of Cartography. Transaction Publishers. pp. 65–. ISBN 978-1-4128-2518-4.
- Leo Bagrow (2010). History of Cartography. Transaction Publishers. pp. 65–. ISBN 978-1-4128-2518-4.
- P. D. A. Harvey (1991). Medieval maps. British Library. ISBN 978-0-7123-0232-6.
- "Portolan charts from the late thirteenth century to 1500 – Additions, Corrections, Updates". www.maphistory.info. Retrieved 2020-08-14.
- María Luisa Martín-Merás (1 January 1993). Cartografía marítima hispana: la imagen de América. IGME. pp. 30–. ISBN 978-84-7782-265-3.
- Ernesto García Camarero; Julio Rey Pastor (1960). Julio Rey Pastor y Ernesto Garcia Camarero. La cartografia mallorquina. - Madrid: Dep. de historia y filosofia de la ciencia "Inst. Luis Vives", Consejo sup. de investigaciones cientificas 1960. XV, 207 S. 8°. Department de historia y filosofia de la ciencia "Inst. Luis Vives", Consejo sup. de investigaciones cientificas.
- Ramon J.Pujades i Bataller (2007). Les cartes portolanes: la representació medieval d'una mar solcada. Institut Cartogràfic de Catalunya. ISBN 978-84-9785-414-6.