List of highest-income counties in the United States
There are 3,144 counties and county-equivalents in the United States. The source of the data is the U.S. Census Bureau and the data is current as of the indicated year. Independent cities are considered county-equivalent by the Census Bureau.
| This article is part of a series on |
| Income in the United States of America |
|---|
 |
|
|

Summary
Before the American Civil War, the wealthiest counties were primarily located in Louisiana and Mississippi, because of the high number of enslaved people, who were not included in the population.[1]
Loudoun County, Virginia, a suburb of Washington, D.C., is the highest-income county by median household income. Another Washington, D.C. suburb, Arlington County, Virginia, ranked as the highest-income county by median family income as of 2013.[2]
Median household income
2020 Census
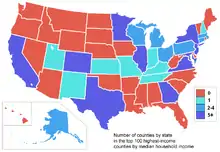
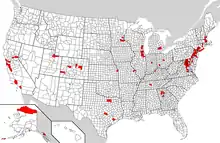
The graph below depicts the 100 highest income counties in the United States by median household income according to the 2020 United States census.[3] Virginia has the most counties in the top 100 with 18. It is followed by California with 11, Maryland with 10, New Jersey with nine, New York and Texas with six each, Illinois with five, Colorado, Massachusetts, and Minnesota with four each, Ohio and Pennsylvania with three each, Georgia, Indiana, Utah, and Washington with two each, and Connecticut, Washington, D.C., Iowa, Kansas, Kentucky, New Hampshire, New Mexico, Tennessee, and Wisconsin with one each.
2010 Census
The rankings are based on the median annual household income estimates from 2005 to 2009 in each county in the nation, provided by the United States Census Bureau's American Community Survey, in 2009 inflation-adjusted dollars.[5] Since cities in Virginia are independent of surrounding counties they are included in the Census Bureau's ranking.
Number of counties by state in following list: Virginia 5 plus 3 independent cities, Maryland 4, New Jersey 3, New York 3, California 2, Colorado 1, Georgia 1, New Mexico 1, Ohio 1, Tennessee 1. Of the top 25 counties, 10 are part of the Baltimore-Washington Metropolitan Area, 6 counties are part of the New York Metropolitan Area, and 2 counties are part of the San Francisco Bay Area. By Census region, 14 counties are located in the South, 6 in the Northeast, 4 in the West, and 1 located in the Midwest. 17 of the 25 counties are part of the densely populated Northeast Megalopolis.
| 2009 | ||||||
|---|---|---|---|---|---|---|
| Rank | County | 2005–09 ACS Median household income |
2005–09 ACS Margin of error |
2000 Census Median household income |
2000 Census Margin of error |
Change from 2000 Census to 2005–09 ACS |
| 1 | City of Falls Church, Virginia | $113,313 | 3,595 | 96,449 | 5,613 | 16,864 |
| 2 | Loudoun County, Virginia | $112,021 | 1,833 | 103,817 | 1,477 | 8,204 |
| 3 | Fairfax County, Virginia | $104,259 | 955 | 104,335 | 709 | −76 |
| 4 | Hunterdon County, New Jersey | $102,500 | 2,533 | 102,839 | 1,717 | −339 |
| 5 | Howard County, Maryland | $101,003 | 1,325 | 95,474 | 1,128 | 5,529 |
| 6 | Los Alamos County, New Mexico | $100,423 | 5,635 | 101,687 | 4,364 | −1,264 |
| 7 | Douglas County, Colorado | $99,522 | 1,394 | 106,754 | 1,402 | −7,232 |
| 8 | Morris County, New Jersey | $96,316 | 1,374 | 99,559 | 1,085 | −3,243 |
| 9 | Somerset County, New Jersey | $96,233 | 1,782 | 99,035 | 1,399 | −2,802 |
| 10 | City of Fairfax, Virginia | $96,232 | 5,204 | 87,075 | 3,616 | 9,157 |
| 11 | Arlington County, Virginia | $93,806 | 1,652 | 81,101 | 1,183 | 12,705 |
| 12 | Nassau County, New York | $92,450 | 800 | 92,724 | 463 | −274 |
| 13 | Montgomery County, Maryland | $92,213 | 962 | 92,107 | 635 | 106 |
| 14 | Calvert County, Maryland | $90,621 | 2,753 | 84,890 | 1,868 | 5,731 |
| 15 | Stafford County, Virginia | $90,586 | 1,895 | 86,003 | 1,555 | 4,583 |
| 16 | Prince William County, Virginia | $88,850 | 1,545 | 84,910 | 959 | 3,940 |
| 17 | Williamson County, Tennessee | $88,358 | 1,787 | 88,957 | 1,769 | −599 |
| 18 | Forsyth County, Georgia | $88,040 | 1,808 | 88,681 | 1,803 | −641 |
| 19 | Putnam County, New York | $88,036 | 2,574 | 93,044 | 1,503 | −5,008 |
| 20 | Marin County, California | $87,728 | 1,569 | 91,792 | 1,314 | −4,064 |
| 21 | Charles County, Maryland | $86,141 | 2,341 | 80,068 | 1,460 | 6,073 |
| 22 | Santa Clara County, California | $85,569 | 864 | 95,691 | 507 | −10,122 |
| 23 | Delaware County, Ohio | $85,054 | 2,214 | 86,581 | 1,697 | −1,527 |
| 24 | City of Poquoson, Virginia | $84,688 | 5,283 | 78,422 | 3,527 | 6,266 |
| 25 | Suffolk County, New York | $84,530 | 803 | 84,045 | 403 | 485 |
[6] This data is average 2006–2008 from the American Community Survey of the United States Bureau of the Census. Number of counties by state in following lists: Virginia 6 plus 2 independent cities, Maryland 4, New Jersey 3, New York 3, California 2, Colorado 1, Georgia 1, Pennsylvania 1, Tennessee 1, Utah 1.
Of the top 25 counties, 11 are part of the Washington Metropolitan Area, 6 counties are part of the New York Metropolitan Area, and 2 counties are part of the San Francisco Bay Area. By Census region, 14 counties are located in the South, 7 in the Northeast, 4 in the West, with none located in the Midwest. 18 of the 25 counties are part of the densely populated Northeast Megalopolis. Educational attainment is based on bachelor's degree attainment (and above) for people 25 and older in the county.
Number of counties by state in following lists: Virginia 6, Maryland 5, New Jersey 3, New York 2, California 2, Colorado 1, Georgia 1.
10 of the 20 counties are part of the Washington Metropolitan Area and 5 counties are part of the New York Metropolitan Area. By Census region, 12 counties are located in the South, 5 in the Northeast, and 3 in the West. 16 of the 20 counties are part of the densely populated Northeast Megalopolis.
| 2007 – Counties with populations of 250,000 or more | ||
|---|---|---|
| Rank | County | Median Household Income |
| 1 | Loudoun County, Virginia | $107,207 |
| 2 | Fairfax County, Virginia | $105,241 |
| 3 | Howard County, Maryland | $101,672 |
| 4 | Somerset County, New Jersey | $97,658 |
| 5 | Morris County, New Jersey | $94,684 |
| 6 | Douglas County, Colorado | $92,824 |
| 7 | Montgomery County, Maryland | $91,835 |
| 8 | Suffolk County, New York | $89,782 |
| 9 | Prince William County, Virginia | $87,243 |
| 10 | Santa Clara County, California | $84,360 |
| 2007 – Counties with populations 65,000–250,000 | ||
|---|---|---|
| Rank | County | Median Household Income |
| 1 | Hunterdon County, New Jersey | $100,327 |
| 2 | Calvert County, Maryland | $95,134 |
| 3 | Arlington County, Virginia | $94,876 |
| 4 | Stafford County, Virginia | $87,629 |
| 5 | Fauquier County, Virginia | $84,888 |
| 6 | Forsyth County, Georgia | $84,872 |
| 7 | Putnam County, New York | $84,624 |
| 8 | Marin County, California | $83,870 |
| 9 | Charles County, Maryland | $83,412 |
| 10 | Carroll County, Maryland | $82,492 |
Source: US Census Bureau, 2006 American Community Survey, via Forbes
Number of counties by state in the top 20: Virginia 5 plus 1 independent city, California 3, Maryland 3, New Jersey 3, New York 2, Colorado 1, Georgia 1, Tennessee 1. Forty-two states do not have any counties in the top 20.
| 2006 | ||
|---|---|---|
| Rank | County | Median Household Income |
| 1 | Fairfax County, Virginia | $100,318 |
| 2 | Loudoun County, Virginia | $99,371 |
| 3 | Howard County, Maryland | $94,260 |
| 4 | Hunterdon County, New Jersey | $93,297 |
| 5 | Douglas County, Colorado | $92,125 |
| 6 | Somerset County, New Jersey | $91,688 |
| 7 | Morris County, New Jersey | $89,587 |
| 8 | Montgomery County, Maryland | $87,624 |
| 9 | Arlington County, Virginia | $87,350 |
| 10 | Suffolk County, New York | $85,994 |
| 11 | Marin County, California | $85,892 |
| 12 | Stafford County, Virginia | $85,014 |
| 13 | Calvert County, Maryland | $84,891 |
| 14 | Santa Clara County, California | $84,838 |
| 15 | Forsyth County, Georgia | $83,682 |
| 16 | San Mateo County, California | $82,123 |
| 17 | Putnam County, New York | $81,907 |
| 18 | Williamson County, Tennessee | $81,449 |
| 19 | Prince William County, Virginia | $80,783 |
| 20 | City of Alexandria, Virginia | $80,449 |
2000 Census
Source: US Census Bureau: 2000 Census
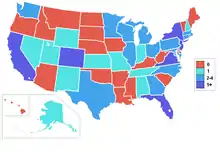
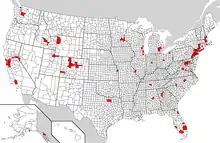
Number of counties by state in the top 100: Virginia 10 plus 5 independent cities, Maryland 9, California 8, New Jersey 8, Georgia 7, Colorado 6, Illinois 6, Minnesota 5, New York 5, Texas 5, Alaska 3, Connecticut 3, Ohio 3, Pennsylvania 3, Wisconsin 2, Massachusetts 2, Michigan 2, Indiana 1, Kansas 1, Kentucky 1, Missouri 1, New Hampshire 1, New Mexico 1, Tennessee 1, Utah 1. Twenty-five states do not have any counties in the top 100.
United States of America: $41,994
Per capita income
2010 Census
Number of counties by state in the top 20: New Jersey 4; California 3; New York 2; Virginia 1 county, 1 independent city, and 1 statistical unit comprising a county and two independent cities; Colorado, Connecticut, Florida, Idaho, Maryland, Texas, South Dakota, and Wyoming 1 each.
Of the 20 counties, 7 are part of the New York Metropolitan Area, 4 are part of the Washington Metropolitan Area, and 3 are part of the San Francisco Bay Area. By Census region, 7 counties are located in the Northeast, 6 in the South, and 6 in the West.
| Average per capita income 2009 | ||
|---|---|---|
| Rank | County | Average Per Capita Income |
| 1 | Teton County, Wyoming | $132,728 |
| 2 | New York County, New York | $120,790 |
| 3 | Loving County, Texas | $99,593 |
| 4 | Pitkin County, Colorado | $93,465 |
| 5 | Marin County, California | $91,483 |
| 6 | Suffolk County, New York | $91,376 |
| 7 | Fairfield County, Connecticut | $74,878 |
| 8 | San Mateo County, California | $71,753 |
| 9 | Morris County, New Jersey | $71,713 |
| 10 | City and County of San Francisco, California | $71,342 |
| 11 | Somerset County, New Jersey | $70,949 |
| 12 | City of Alexandria, Virginia | $70,632 |
| 13 | Arlington County, Virginia | $68,270 |
| 14 | Fairfax County, City of Fairfax, and Falls Church, Virginia | $67,909 |
| 15 | Montgomery County, Maryland | $67,525 |
| 16 | Bergen County, New Jersey | $67,125 |
| 17 | Hunterdon County, New Jersey | $66,449 |
| 18 | Sully County, South Dakota | $64,352 |
| 19 | Blaine County, Idaho | $64,207 |
| 20 | Collier County, Florida | $63,276 |
2000 Census
Number of counties by state in the top 100: Colorado 10, Virginia 7 counties plus 3 independent cities, New Jersey 9, California 8, Florida 6, New York 6, Georgia 4, Maryland 4, Minnesota 4, Connecticut 3, Massachusetts 3, Michigan 3, Pennsylvania 3, Texas 3, Illinois 2, North Carolina 2, Ohio 2, Washington 2, Wisconsin 2, Idaho 1, Alaska 1, Alabama 1, District of Columbia 1, Indiana 1, Kansas 1, Missouri 1, Nevada 1, New Hampshire 1, New Mexico 1, Rhode Island 1, Tennessee 1, Utah 1, Wyoming 1. Eighteen states do not have any counties in the top 100. United States of America per capita average: $21,587
Highest-income counties and places by state
For more detailed lists of rankings of counties and places in the individual states, see the following pages:
- Alabama
- Alaska
- Arizona
- Arkansas
- California
- Colorado
- Connecticut
- Delaware
- Florida
- Georgia
- Hawaii
- Idaho
- Illinois
- Indiana
- Iowa
- Kansas
- Kentucky
- Louisiana
- Maine
- Maryland
- Massachusetts
- Michigan
- Minnesota
- Mississippi
- Missouri
- Montana
- Nebraska
- Nevada
- New Hampshire
- New Jersey
- New Mexico
- New York
- North Carolina
- North Dakota
- Ohio
- Oklahoma
- Oregon
- Pennsylvania
- Rhode Island
- South Carolina
- South Dakota
- Tennessee
- Texas
- Utah
- Vermont
- Virginia
- Washington
- West Virginia
- Wisconsin
- Wyoming
See also
Notes and references
- Frasier, Steve (2005). Ruling America. Harvard University Press. ISBN 9780674017474.
- "District of Columbia region boasts four richest counties in U.S." American City Business Journals.
- "QuickFacts". United States Census Bureau. Retrieved September 7, 2022.
- State and County QuickFacts Archived March 4, 2012, at the Wayback Machine. Quickfacts.census.gov (February 20, 2013). Retrieved on July 21, 2013.
- Median Household Income in 2009 Inflation-Adjusted Dollars based on the 2005–09 American Community Survey, United States Census Bureau. Retrieved December 24, 2011.
- "Census Bureau Homepage". Census.gov. March 26, 2012. Retrieved April 14, 2012.
- "Income, Earnings, and Poverty Data From the 2007 American Community Survey" (PDF). Retrieved April 14, 2012.
- Matt Woolsey, America's Richest Counties, Forbes.com, 01.22.08, 6:00 PM ET Forbes.com Web site. Retrieved February 8, 2008.
- "Census 2000 Demographic Profiles". Censtats.census.gov. Archived from the original on July 15, 2011. Retrieved April 14, 2012.
- "Interactive Data". U.S. Bureau of Economic Analysis. Retrieved October 7, 2012.
- Aristide Economoupolos/The Star-Leder. "N.J. has four of nation's 20 highest-income counties". Nj.com. Retrieved April 14, 2012.
| General | ||
|---|---|---|
| Demographics | ||
| Economy | ||
| Geography | ||
| Name origins | ||
| See also | ||