California's 5th congressional district
California's 5th congressional district is a U.S. congressional district in California.
| California's 5th congressional district | |||
|---|---|---|---|
Interactive map of district boundaries since 2023 (Used in the 2022 elections) | |||
| Representative |
| ||
| Population (2022) | 778,853[1] | ||
| Median household income | $84,734[2] | ||
| Ethnicity |
| ||
| Cook PVI | R+9[3] | ||
.svg.png.webp)
The district is located in the northern San Joaquin Valley and central Sierra Nevada. The district includes all of Amador, Calaveras, Tuolumne and Mariposa counties, western El Dorado County, and eastern Stanislaus, Madera and Fresno counties. Cities in the district include most of Modesto, northern Turlock, northern Fresno, Oakdale, Hughson, Riverbank, Sonora, Jackson, and Placerville. It also includes the census-designated places of Mariposa, the County seat of Mariposa County, and El Dorado Hills. It also includes Yosemite National Park and part of Kings Canyon National Park. It is represented by Republican Tom McClintock.[1]
From 2013 to 2022, the district was located in the northern part of the San Francisco Bay Area, including Santa Rosa, Vallejo, and most of Wine Country. The district was represented by Mike Thompson, a Democrat.
Election results from statewide races
| Year | U.S. President | U.S. Senator (Class 1) | U.S. Senator (Class 3) | Governor |
|---|---|---|---|---|
| 1992 | Clinton (D) 50.9–31.1% | Feinstein (D) 59.8–32.6% | Boxer (D) 55.2–35.3% | — |
| 1994 | — | [data missing] | — | Brown (D) 48.6–47.2% |
| 1996 | Clinton (D) 57.1–33.8% | — | — | — |
| 1998 | — | — | [data missing] | [data missing] |
| 2000 | Gore (D) 57.1–37.0%[4] | Feinstein (D) 61.6–31.1%[5] | — | — |
| 2002 | — | — | — | Davis (D) 50.4–35.3%[6] |
| 2003 | — | — | — | Recall: |
| Schwarzenegger (R) 43.1–35.4% | ||||
| 2004 | Kerry (D) 61.1–37.9%[9] | — | Boxer (D) 68.3–27.5%[10] | — |
| 2006 | — | Feinstein (D) 66.7–27.1%[11] | — | Schwarzenegger (R) 49.6–43.8% |
| 2008 | Obama (D) 69.5–28.4%[12] | — | — | — |
| 2010 | — | — | Boxer (D) 62.2–33.3%[13] | Brown (D) 68.1–27.1%[14] |
| 2012 | Obama (D) 69.7–27.4%[15] | Feinstein (D) 72.5–27.5%[16] | — | — |
| 2014 | — | — | — | Brown (D) 72.6–27.4%[17] |
| 2016 | Clinton (D) 69.4–22.2%[18] | — | Harris (D) 73.0–27%[19]| | — |
| 2018 | — | Feinstein (D) 56.3–43.7%[20] | — | Newsom (D) 70.0–30.0%[21] |
| 2020 | Biden (D) 72.4–25.3%[22] | — | — | — |
| 2021 | — | — | — | Recall: |
| 2022 | — | — | Meuser (R) 60.3–39.7% | Dahle (R) 62.7–37.3%[24] |
List of members representing the district
| Member | Party | Years | Cong ress(es) |
Electoral history | Counties |
|---|---|---|---|---|---|
| District created March 4, 1885 | |||||
 Charles N. Felton (San Francisco) |
Republican | March 4, 1885 – March 3, 1889 |
49th 50th |
Elected in 1884. Re-elected in 1886. Retired. |
1885–1893 San Francisco, San Mateo, Santa Clara, Santa Cruz |
 Thomas J. Clunie (San Francisco) |
Democratic | March 4, 1889 – March 3, 1891 |
51st | Elected in 1888. Retired. | |
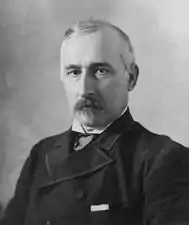
 Eugene F. Loud (San Francisco) |
Republican | March 4, 1891 – March 3, 1903 |
52nd 53rd 54th 55th 56th 57th |
Elected in 1890. Re-elected in 1892. Re-elected in 1894. Re-elected in 1896. Re-elected in 1898. Re-elected in 1900. Lost re-election. | |
| 1893–1913 San Francisco, San Mateo, Santa Clara | |||||
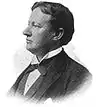
.jpg.webp) William J. Wynn (San Francisco) |
Democratic-Union Labor | March 4, 1903 – March 3, 1905 |
58th | Elected in 1902. Lost re-election. | |
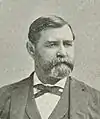
 Everis A. Hayes (San Jose) |
Republican | March 4, 1905 – March 3, 1913 |
59th 60th 61st 62nd |
Elected in 1904. Re-elected in 1906. Re-elected in 1908. Re-elected in 1910. Redistricted to the 8th district. | |
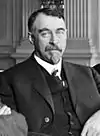
.jpg.webp) John I. Nolan (San Francisco) |
Republican | March 4, 1913 – November 18, 1922 |
63rd 64th 65th 66th 67th |
Elected in 1912. Re-elected in 1914. Re-elected in 1916. Re-elected in 1918. Re-elected in 1920. Re-elected in 1922. Died. |
1913–1967 San Francisco |
| Vacant | November 18, 1922 – January 23, 1923 |
67th | |||
 Mae Nolan (San Francisco) |
Republican | January 23, 1923 – March 3, 1925 |
67th 68th |
Elected only to finish her husband's term. Retired. | |
.jpg.webp) Lawrence J. Flaherty (San Francisco) |
Republican | March 4, 1925 – June 13, 1926 |
69th | Elected in 1924. Died. | |
| Vacant | June 13, 1926 – August 31, 1926 | ||||
.jpg.webp) Richard J. Welch (San Francisco) |
Republican | August 31, 1926 – September 10, 1949 |
69th 70th 71st 72nd 73rd 74th 75th 76th 77th 78th 79th 80th 81st |
Elected to finish Flaherty's term. Re-elected in 1928. Re-elected in 1930. Re-elected in 1932. Re-elected in 1934. Re-elected in 1936. Re-elected in 1938. Re-elected in 1940. Re-elected in 1942. Re-elected in 1944. Re-elected in 1946. Re-elected in 1948. Died. | |
| Vacant | September 10, 1949 – November 8, 1949 |
81st | |||
 John F. Shelley (San Francisco) |
Democratic | November 8, 1949 – January 7, 1964 |
81st 82nd 83rd 84th 85th 86th 87th 88th |
Elected to finish Welch's term. Re-elected in 1950. Re-elected in 1952. Re-elected in 1954. Re-elected in 1956. Re-elected in 1958. Re-elected in 1960. Re-elected in 1962. Resigned to become Mayor of San Francisco. | |
| Vacant | January 7, 1964 – February 18, 1964 |
88th | |||
 Phillip Burton (San Francisco) |
Democratic | February 18, 1964 – January 3, 1975 |
88th 89th 90th 91st 92nd 93rd |
Elected to finish Shelley's term. Re-elected later in 1964. Re-elected in 1966. Re-elected in 1968. Re-elected in 1970. Re-elected in 1972. Redistricted to the 6th district. | |
| Eastern San Francisco | |||||
 John Burton (San Francisco) |
Democratic | January 3, 1975 – January 3, 1983 |
94th 95th 96th 97th |
Redistricted from the 6th district and re-elected in 1974. Re-elected in 1976. Re-elected in 1978. Re-elected in 1980. Retired. |
1975–1983 Marin, northwestern San Francisco |
Phillip Burton (San Francisco) |
Democratic | January 3, 1983 – April 10, 1983 |
98th | Redistricted from the 6th district and re-elected in 1982. Died. |
1983–1993 Western San Francisco |
| Vacant | April 10, 1983 – June 21, 1983 |
||||
.jpg.webp) Sala Burton (San Francisco) |
Democratic | June 21, 1983 – February 1, 1987 |
98th 99th 100th |
Elected to finish her husband's term. Re-elected in 1984. Re-elected in 1986. Died. | |
| Vacant | February 1, 1987 – June 2, 1987 |
100th | |||
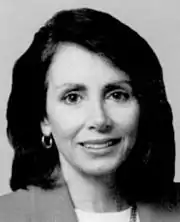 Nancy Pelosi (San Francisco) |
Democratic | June 2, 1987 – January 3, 1993 |
100th 101st 102nd |
Elected to finish Burton's term. Re-elected in 1988. Re-elected in 1990. Redistricted to the 8th district. | |
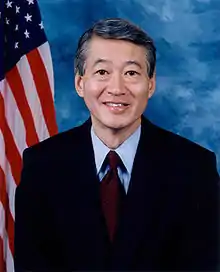 Bob Matsui (Sacramento) |
Democratic | January 3, 1993 – January 1, 2005 |
103rd 104th 105th 106th 107th 108th |
Redistricted from the 3rd district and re-elected in 1992. Re-elected in 1994. Re-elected in 1996. Re-elected in 1998. Re-elected in 2000. Re-elected in 2002. Re-elected in 2004, but died before his term began. |
1993–2003 Sacramento (Sacramento city) |
2003–2013 Sacramento (Sacramento city) | |||||
| Vacant | January 1, 2005 – March 8, 2005 |
108th 109th | |||
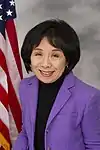 Doris Matsui (Sacramento) |
Democratic | March 8, 2005 – January 3, 2013 |
109th 110th 111th 112th |
Elected to finish her husband's term. Re-elected in 2006. Re-elected in 2008. Re-elected in 2010. Redistricted to the 6th district. | |
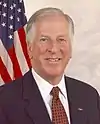 Mike Thompson (St. Helena) |
Democratic | January 3, 2013 – January 3, 2023 |
113th 114th 115th 116th 117th |
Redistricted from the 1st district and re-elected in 2012. Re-elected in 2014. Re-elected in 2016. Re-elected in 2018. Re-elected in 2020. Redistricted to the 4th district. |
2013–2023.tif.png.webp) North Bay area including Napa, Santa Rosa, and Vallejo |
 Tom McClintock (Elk Grove) |
Republican | January 3, 2023 – present |
118th | Redistricted from the 4th district and re-elected in 2022. | 2023–present_(new_version).svg.png.webp) Amador, Calaveras, Tuolumne. Mariposa, western El Dorado, eastern Stanislaus, Madera and Fresno. |
Complete election results
|
1884 • 1886 • 1888 • 1890 • 1892 • 1894 • 1896 • 1898 • 1900 • 1902 • 1904 • 1906 • 1908 • 1910 • 1912 • 1914 • 1916 • 1918 • 1920 • 1922 • 1923 (Special) • 1924 • 1926 (Special) • 1926 • 1928 • 1930 • 1932 • 1934 • 1936 • 1927 (Special) • 1938 • 1940 • 1942 • 1944 • 1946 • 1948 • 1949 (Special) • 1950 • 1952 • 1954 • 1956 • 1958 • 1960 • 1962 • 1964 • 1966 • 1968 • 1970 • 1972 • 1974 • 1976 • 1978 • 1980 • 1982 • 1983 (Special) • 1984 • 1986 • 1987 (Special) • 1988 • 1990 • 1992 • 1994 • 1996 • 1998 • 2000 • 2002 • 2004 • 2005 (Special) • 2006 • 2008 • 2010 • 2012 • 2014 • 2016 • 2018 • 2020 • 2022 |
1884
| Party | Candidate | Votes | % | |||
|---|---|---|---|---|---|---|
| Republican | Charles N. Felton | 17,014 | 51.7 | |||
| Democratic | Frank J. Sullivan | 15,676 | 47.6 | |||
| Prohibition | William Crowhurst | 232 | 0.7 | |||
| Total votes | 32,922 | 100.0 | ||||
| Turnout | {{{votes}}} | |||||
| Republican gain from Democratic | ||||||
1886
| Party | Candidate | Votes | % | |
|---|---|---|---|---|
| Republican | Charles N. Felton (Incumbent) | 16,328 | 48.8 | |
| Democratic | Frank J. Sullivan | 16,209 | 48.4 | |
| Independent | Albert E. Redstone | 470 | 1.4 | |
| Prohibition | C. Henderson | 460 | 1.4 | |
| Total votes | 33,467 | 100.0 | ||
| Turnout | {{{votes}}} | |||
| Republican hold | ||||
1888
| Party | Candidate | Votes | % | |||
|---|---|---|---|---|---|---|
| Democratic | Thomas J. Clunie | 20,276 | 49.3 | |||
| Republican | Timothy Guy Phelps | 20,225 | 49.2 | |||
| Independent | Henry French | 613 | 1.5 | |||
| Total votes | 41,114 | 100.0 | ||||
| Turnout | {{{votes}}} | |||||
| Democratic gain from Republican | ||||||
1890
| Party | Candidate | Votes | % | |||
|---|---|---|---|---|---|---|
| Republican | Eugene F. Loud | 22,871 | 52.8 | |||
| Democratic | Thomas J. Clunie (Incumbent) | 19,899 | 45.9 | |||
| Socialist | E. F. Howe | 574 | 1.3 | |||
| Total votes | 43,344 | 100.0 | ||||
| Turnout | {{{votes}}} | |||||
| Republican gain from Democratic | ||||||
1892
| Party | Candidate | Votes | % | |
|---|---|---|---|---|
| Republican | Eugene F. Loud (Incumbent) | 14,660 | 46.4 | |
| Democratic | J. W. Ryland | 13,694 | 43.3 | |
| Populist | Jonas J. Morrison | 2,484 | 7.9 | |
| Prohibition | William Kelly | 771 | 2.4 | |
| Total votes | 31,609 | 100.0 | ||
| Turnout | {{{votes}}} | |||
| Republican hold | ||||
1894
| Party | Candidate | Votes | % | |
|---|---|---|---|---|
| Republican | Eugene F. Loud (Incumbent) | 13,379 | 36.8 | |
| Democratic | Joseph P. Kelly | 8,384 | 23.0 | |
| Populist | James T. Rogers | 7,820 | 21.5 | |
| Prohibition | James Denman | 6,811 | 18.7 | |
| Total votes | 36,394 | 100.0 | ||
| Turnout | {{{votes}}} | |||
| Democratic hold | ||||
1896
| Party | Candidate | Votes | % | |
|---|---|---|---|---|
| Republican | Eugene F. Loud (Incumbent) | 19,351 | 48.6 | |
| Democratic | Joseph P. Kelly | 10,494 | 26.3 | |
| Populist | A. B. Kinne | 8,825 | 22.2 | |
| Socialist Labor | Henry Daniels | 757 | 1.9 | |
| Prohibition | T. H. Lawson | 404 | 1.0 | |
| Total votes | 39,831 | 100.0 | ||
| Turnout | {{{votes}}} | |||
| Republican hold | ||||
1898
| Party | Candidate | Votes | % | |
|---|---|---|---|---|
| Republican | Eugene F. Loud (Incumbent) | 20,254 | 51.8 | |
| Democratic | William Craig | 17,352 | 44.3 | |
| Socialist Labor | E. T. Kingsley | 1,532 | 3.9 | |
| Total votes | 39,138 | 100.0 | ||
| Turnout | {{{votes}}} | |||
| Republican hold | ||||
1900
| Party | Candidate | Votes | % | |
|---|---|---|---|---|
| Republican | Eugene F. Loud (Incumbent) | 23,443 | 55.7 | |
| Democratic | J. H. Henry | 17,365 | 41.3 | |
| Socialist | C. H. King | 942 | 2.2 | |
| Prohibition | Fred E. Caton | 322 | 0.8 | |
| Total votes | 42,072 | 100.0 | ||
| Turnout | {{{votes}}} | |||
| Republican hold | ||||
1902
| Party | Candidate | Votes | % | |||
|---|---|---|---|---|---|---|
| Democratic | William J. Wynn | 22,712 | 56.5 | |||
| Republican | Eugene F. Loud (Incumbent) | 16,577 | 41.2 | |||
| Socialist | Joseph Lawrence | 620 | 1.5 | |||
| Prohibition | Fred E. Caton | 301 | 0.8 | |||
| Total votes | 40,210 | 100.0 | ||||
| Turnout | {{{votes}}} | |||||
| Democratic gain from Republican | ||||||
1904
| Party | Candidate | Votes | % | |||
|---|---|---|---|---|---|---|
| Republican | Everis A. Hayes | 23,701 | 52.3 | |||
| Democratic | William J. Wynn (Incumbent) | 18,025 | 39.7 | |||
| Union Labor | F. R. Whitney | 2,263 | 5.0 | |||
| Socialist | Charles J. Williams | 916 | 2.0 | |||
| Prohibition | George B. Pratt | 445 | 1.0 | |||
| Total votes | 45,350 | 100.0 | ||||
| Turnout | {{{votes}}} | |||||
| Republican gain from Democratic | ||||||
1906
| Party | Candidate | Votes | % | |
|---|---|---|---|---|
| Republican | Everis A. Hayes (Incumbent) | 22,530 | 53.4 | |
| Democratic | Hiram G. Davis | 17,295 | 41.0 | |
| Socialist | Joseph Lawrence | 2,343 | 5.6 | |
| Total votes | 42,168 | 100.0 | ||
| Turnout | {{{votes}}} | |||
| Republican hold | ||||
1908
| Party | Candidate | Votes | % | |
|---|---|---|---|---|
| Republican | Everis A. Hayes (Incumbent) | 28,127 | 49.1 | |
| Democratic | George A. Tracy | 24,531 | 42.8 | |
| Socialist | E. H. Misner | 3,640 | 6.3 | |
| Prohibition | Walter E. Vail | 1,045 | 1.8 | |
| Total votes | 57,343 | 100.0 | ||
| Turnout | {{{votes}}} | |||
| Republican hold | ||||
1910
| Party | Candidate | Votes | % | |
|---|---|---|---|---|
| Republican | Everis A. Hayes (Incumbent) | 33,265 | 59.4 | |
| Democratic | Thomas E. Hayden | 15,345 | 27.4 | |
| Socialist | E. L. Reguin | 7,052 | 12.6 | |
| Prohibition | T. E. Caton | 359 | 0.6 | |
| Total votes | 56,021 | 100.0 | ||
| Turnout | {{{votes}}} | |||
| Republican hold | ||||
1912
| Party | Candidate | Votes | % | ||
|---|---|---|---|---|---|
| Republican | John I. Nolan | 27,902 | 52.3 | ||
| Socialist | Stephen V. Costello | 18,516 | 34.7 | ||
| Prohibition | E. L. Requin | 6,962 | 13.0 | ||
| Total votes | 53,380 | 100.0 | |||
| Turnout | {{{votes}}} | ||||
| Republican win (new seat) | |||||
1914
| Party | Candidate | Votes | % | |
|---|---|---|---|---|
| Republican | John I. Nolan (Incumbent) | 53,875 | 83.3 | |
| Socialist | Mads Peter Christensen | 7,366 | 11.4 | |
| Prohibition | Frederick Head | 3,410 | 5.3 | |
| Total votes | 64,651 | 100.0 | ||
| Turnout | {{{votes}}} | |||
| Republican hold | ||||
1916
| Party | Candidate | Votes | % | |
|---|---|---|---|---|
| Republican | John I. Nolan (Incumbent) | 59,333 | 84.7 | |
| Socialist | Charles A. Preston | 6,708 | 9.6 | |
| Prohibition | Frederick Head | 4,046 | 5.8 | |
| Total votes | 70,087 | 100.0 | ||
| Turnout | {{{votes}}} | |||
| Republican hold | ||||
1918
| Party | Candidate | Votes | % | |
|---|---|---|---|---|
| Republican | John I. Nolan (Incumbent) | 40,375 | 87 | |
| Socialist | Thomas F. Feeley | 6,032 | 13 | |
| Total votes | 46,407 | 100.0 | ||
| Turnout | {{{votes}}} | |||
| Republican hold | ||||
1920
| Party | Candidate | Votes | % | |
|---|---|---|---|---|
| Republican | John I. Nolan (Incumbent) | 50,274 | 81.8 | |
| Socialist | Hugo Ernst | 10,952 | 18.2 | |
| Total votes | 61,226 | 100.0 | ||
| Turnout | {{{votes}}} | |||
| Republican hold | ||||
1922
| Party | Candidate | Votes | % | |
|---|---|---|---|---|
| Republican | John I. Nolan (Incumbent) | 49,414 | 100.0 | |
| Turnout | {{{votes}}} | |||
| Republican hold | ||||
1923 (Special)
Republican Mae Nolan won the special election to replace her husband John I. Nolan, who won re-election but died before the 68th Congress convened. Data for this special election is not available.[27]
1924
| Party | Candidate | Votes | % | |
|---|---|---|---|---|
| Republican | Lawrence J. Flaherty | 38,893 | 72.6 | |
| Socialist | Isabel C. King | 12,175 | 27.4 | |
| Total votes | 51,068 | 100.0 | ||
| Turnout | {{{votes}}} | |||
| Republican hold | ||||
1926 (Special)
Republican Richard J. Welch won the special election to replace fellow Republican Lawrence J. Flaherty, who died in office. Data for this special election is not available.[29]
1926
| Party | Candidate | Votes | % | |
|---|---|---|---|---|
| Republican | Richard J. Welch (Incumbent) | 47,694 | 100.0 | |
| Turnout | {{{votes}}} | |||
| Republican hold | ||||
1928
| Party | Candidate | Votes | % | |
|---|---|---|---|---|
| Republican | Richard J. Welch (Incumbent) | 51,708 | 100.0 | |
| Turnout | {{{votes}}} | |||
| Republican hold | ||||
1930
| Party | Candidate | Votes | % | |
|---|---|---|---|---|
| Republican | Richard J. Welch (Incumbent) | 59,853 | 100.0 | |
| Turnout | {{{votes}}} | |||
| Republican hold | ||||
1932
| Party | Candidate | Votes | % | |
|---|---|---|---|---|
| Republican | Richard J. Welch (Incumbent) | 67,349 | 100.0 | |
| Turnout | {{{votes}}} | |||
| Republican hold | ||||
1934
| Party | Candidate | Votes | % | |
|---|---|---|---|---|
| Republican | Richard J. Welch (Incumbent) | 89,751 | 93.8 | |
| Communist | Alexander Noral | 5,933 | 6.2 | |
| Total votes | 95,684 | 100.0 | ||
| Turnout | {{{votes}}} | |||
| Republican hold | ||||
1936
| Party | Candidate | Votes | % | |
|---|---|---|---|---|
| Republican | Richard J. Welch (Incumbent) | 82,910 | 94.8 | |
| Communist | Lawrence Ross | 4,545 | 5.2 | |
| Total votes | 87,455 | 100.0 | ||
| Turnout | {{{votes}}} | |||
| Republican hold | ||||
1938
| Party | Candidate | Votes | % | |
|---|---|---|---|---|
| Republican | Richard J. Welch (Incumbent) | 91,868 | 100.0 | |
| Turnout | {{{votes}}} | |||
| Republican hold | ||||
1940
| Party | Candidate | Votes | % | |
|---|---|---|---|---|
| Republican | Richard J. Welch (Incumbent) | 119,122 | 95.8 | |
| Communist | Walter R. Lambert | 5,232 | 4.2 | |
| Total votes | 124,354 | 100.0 | ||
| Turnout | {{{votes}}} | |||
| Republican hold | ||||
1942
| Party | Candidate | Votes | % | |
|---|---|---|---|---|
| Republican | Richard J. Welch (Incumbent) | 85,747 | 92.7 | |
| Communist | Walter R. Lambert | 6,749 | 7.3 | |
| Total votes | 92,496 | 100.0 | ||
| Turnout | {{{votes}}} | |||
| Republican hold | ||||
1944
| Party | Candidate | Votes | % | |
|---|---|---|---|---|
| Republican | Richard J. Welch (Incumbent) | 112,151 | 100.0 | |
| Turnout | {{{votes}}} | |||
| Republican hold | ||||
1946
| Party | Candidate | Votes | % | |
|---|---|---|---|---|
| Republican | Richard J. Welch (Incumbent) | 94,293 | 100.0 | |
| Turnout | {{{votes}}} | |||
| Republican hold | ||||
1948
| Party | Candidate | Votes | % | |
|---|---|---|---|---|
| Republican | Richard J. Welch (Incumbent) | 116,347 | 100.0 | |
| Turnout | {{{votes}}} | |||
| Republican hold | ||||
1949 (Special)
Democrat John F. Shelley won the special election to replace Republican Richard J. Welch, who died in office. Data for this special election is not available.[42]
1950
| Party | Candidate | Votes | % | |
|---|---|---|---|---|
| Democratic | John F. Shelley (Incumbent) | 117,888 | 100.0 | |
| Turnout | {{{votes}}} | |||
| Democratic hold | ||||
1952
| Party | Candidate | Votes | % | |
|---|---|---|---|---|
| Democratic | John F. Shelley (Incumbent) | 107,542 | 100.0 | |
| Turnout | {{{votes}}} | |||
| Democratic hold | ||||
1954
| Party | Candidate | Votes | % | |
|---|---|---|---|---|
| Democratic | John F. Shelley (Incumbent) | 86,428 | 100.0 | |
| Turnout | {{{votes}}} | |||
| Democratic hold | ||||
1956
| Party | Candidate | Votes | % | |
|---|---|---|---|---|
| Democratic | John F. Shelley (Incumbent) | 104,358 | 100.0 | |
| Turnout | {{{votes}}} | |||
| Democratic hold | ||||
1958
| Party | Candidate | Votes | % | |
|---|---|---|---|---|
| Democratic | John F. Shelley (Incumbent) | 99,171 | 100.0 | |
| Turnout | {{{votes}}} | |||
| Democratic hold | ||||
1960
| Party | Candidate | Votes | % | |
|---|---|---|---|---|
| Democratic | John F. Shelley (Incumbent) | 104,507 | 83.7 | |
| Republican | Vick Verreos | 20,305 | 16.3 | |
| Total votes | 124,812 | 100.0 | ||
| Turnout | {{{votes}}} | |||
| Democratic hold | ||||
1962
| Party | Candidate | Votes | % | |
|---|---|---|---|---|
| Democratic | John F. Shelley (Incumbent) | 64,493 | 80.4 | |
| Republican | Roland S. Charles | 15,670 | 19.6 | |
| Total votes | 80,163 | 100.0 | ||
| Turnout | {{{votes}}} | |||
| Democratic hold | ||||
1964
| Party | Candidate | Votes | % | |
|---|---|---|---|---|
| Democratic | Phillip Burton (Incumbent) | 71,638 | 100.0 | |
| Turnout | {{{votes}}} | |||
| Democratic hold | ||||
1966
| Party | Candidate | Votes | % | |
|---|---|---|---|---|
| Democratic | Phillip Burton (Incumbent) | 56,476 | 71.3 | |
| Republican | Terry R. Macken | 22,778 | 28.7 | |
| Total votes | 79,254 | 100.0 | ||
| Turnout | {{{votes}}} | |||
| Democratic hold | ||||
1968
| Party | Candidate | Votes | % | |
|---|---|---|---|---|
| Democratic | Phillip Burton (Incumbent) | 86,647 | 72.0 | |
| Republican | Waldo Velasquez | 29,123 | 24.2 | |
| Peace and Freedom | Marvin Garson | 4,549 | 3.8 | |
| Total votes | 120,319 | 100.0 | ||
| Turnout | {{{votes}}} | |||
| Democratic hold | ||||
1970
| Party | Candidate | Votes | % | |
|---|---|---|---|---|
| Democratic | Phillip Burton (Incumbent) | 76,567 | 70.8 | |
| Republican | John E. Parks | 31,570 | 29.2 | |
| Total votes | 108,137 | 100.0 | ||
| Turnout | {{{votes}}} | |||
| Democratic hold | ||||
1972
| Party | Candidate | Votes | % | |
|---|---|---|---|---|
| Democratic | Phillip Burton (Incumbent) | 120,819 | 81.8 | |
| Republican | Edlo E. Powell | 26,963 | 18.2 | |
| Total votes | 147,782 | 100.0 | ||
| Turnout | {{{votes}}} | |||
| Democratic hold | ||||
1974
| Party | Candidate | Votes | % | |
|---|---|---|---|---|
| Democratic | John Burton (Incumbent) | 87,323 | 59.6 | |
| Republican | Thomas Caylor | 55,881 | 37.7 | |
| Peace and Freedom | Raymond Broshears | 3,999 | 2.7 | |
| Total votes | 147,203 | 100.0 | ||
| Turnout | {{{votes}}} | |||
| Democratic hold | ||||
1976
| Party | Candidate | Votes | % | |
|---|---|---|---|---|
| Democratic | John Burton (Incumbent) | 103,746 | 61.8 | |
| Republican | Branwell Fanning | 64,008 | 38.2 | |
| Total votes | 167,754 | 100.0 | ||
| Turnout | {{{votes}}} | |||
| Democratic hold | ||||
1978
| Party | Candidate | Votes | % | |
|---|---|---|---|---|
| Democratic | John Burton (Incumbent) | 106,046 | 66.8 | |
| Republican | Dolores Skore | 52,603 | 33.2 | |
| Total votes | 158,649 | 100.0 | ||
| Turnout | {{{votes}}} | |||
| Democratic hold | ||||
1980
| Party | Candidate | Votes | % | |
|---|---|---|---|---|
| Democratic | John Burton (Incumbent) | 101,105 | 51.1 | |
| Republican | Dennis McQuaid | 89,624 | 45.3 | |
| Libertarian | Dan P. Dougherty | 7,092 | 3.6 | |
| Total votes | 197,821 | 100.0 | ||
| Turnout | {{{votes}}} | |||
| Democratic hold | ||||
1982
| Party | Candidate | Votes | % | |
|---|---|---|---|---|
| Democratic | Phillip Burton (Incumbent) | 103,268 | 50.5 | |
| Republican | Milton Marks | 72,139 | 35.3 | |
| Libertarian | Justin Raimondo | 2,904 | 14.2 | |
| Total votes | 178,311 | 100.0 | ||
| Turnout | {{{votes}}} | |||
| Democratic hold | ||||
1983 (Special)
| Party | Candidate | Votes | % | |
|---|---|---|---|---|
| Democratic | Sala Burton | 56.9 | ||
| Republican | Duncan Lent Howard | 23.3 | ||
| Democratic | Richard Doyle | 8.4 | ||
| Republican | Tom Spinosa | 3.7 | ||
| Republican | Gary Richard Arnold | 2.0 | ||
| Democratic | Tibor Uskert | 1.4 | ||
| Republican | Bill Dunlap | 1.3 | ||
| Democratic | Evelyn K. Lantz | 1.1 | ||
| Democratic | Michael O. Plunkett | 0.7 | ||
| Peace and Freedom | Andrew R. "Paul" Kangas | 0.6 | ||
| Libertarian | Eric A. Garris | 0.5 | ||
| No party | Richard Stypman (Write-in) | |||
| No party | Samuel Unger (write-in) | |||
| Total votes | 100.0 | |||
| Turnout | {{{votes}}} | |||
| Democratic hold | ||||
1984
| Party | Candidate | Votes | % | |
|---|---|---|---|---|
| Democratic | Sala Burton (Incumbent) | 139,692 | 72.3 | |
| Republican | Tom Spinosa | 45,930 | 23.8 | |
| Libertarian | Joseph Fuhrig | 4,008 | 2.1 | |
| Peace and Freedom | Henry Clark | 3,574 | 1.8 | |
| Total votes | 193,204 | 100.0 | ||
| Turnout | {{{votes}}} | |||
| Democratic hold | ||||
1986
| Party | Candidate | Votes | % | |
|---|---|---|---|---|
| Democratic | Sala Burton (Incumbent) | 122,688 | 75.2 | |
| Republican | Mike Garza | 36,039 | 22.1 | |
| Libertarian | Samuel K. "Sam" Grove | 2,409 | 1.5 | |
| Peace and Freedom | Theodore Adrian "Ted" Zuur | 2,078 | 1.3 | |
| Total votes | 163,214 | 100.0 | ||
| Turnout | {{{votes}}} | |||
| Democratic hold | ||||
1987 (Special)
| Party | Candidate | Votes | % | |
|---|---|---|---|---|
| Democratic | Nancy Pelosi | 63.4 | ||
| Republican | Harriet Ross | 23.3 | ||
| Independent | Karen Edwards | 2.2 | ||
| Independent | Cathy Sedwick | 0.9 | ||
| Peace and Freedom | Theodore Adrian "Ted" Zurr | 1.5 | ||
| Libertarian | Samuel K. "Sam" Grove | 1.4 | ||
| Total votes | 100.0 | |||
| Turnout | {{{votes}}} | |||
| Democratic hold | ||||
1988
| Party | Candidate | Votes | % | |
|---|---|---|---|---|
| Democratic | Nancy Pelosi (Incumbent) | 133,530 | 76.4 | |
| Republican | Bruce Michael O'Neill | 33,692 | 19.3 | |
| Peace and Freedom | Theodore Adrian "Ted" Zuur | 3,975 | 2.3 | |
| Libertarian | Sam Grove | 3,561 | 2.0 | |
| Total votes | 174,758 | 100.0 | ||
| Turnout | {{{votes}}} | |||
| Democratic hold | ||||
1990
| Party | Candidate | Votes | % | |
|---|---|---|---|---|
| Democratic | Nancy Pelosi (Incumbent) | 120,633 | 77.2 | |
| Republican | Alan Nichols | 35,671 | 22.8 | |
| Total votes | 156,304 | 100.0 | ||
| Turnout | {{{votes}}} | |||
| Democratic hold | ||||
1992
| Party | Candidate | Votes | % | |
|---|---|---|---|---|
| Democratic | Robert Matsui (Incumbent) | 158,250 | 68.6 | |
| Republican | Robert S. Dinsmore | 58,698 | 25.5 | |
| American Independent | Gordon Mors | 4,745 | 2.1 | |
| Libertarian | Chris J. Rufer | 4,547 | 2.0 | |
| Green | Tian Harter | 4,316 | 1.9 | |
| No party | Bergeron (write-in) | 4 | 0.0 | |
| Total votes | 230,560 | 100.0 | ||
| Turnout | {{{votes}}} | |||
| Democratic hold | ||||
1994
| Party | Candidate | Votes | % | |
|---|---|---|---|---|
| Democratic | Robert Matsui (Incumbent) | 125,042 | 68.48 | |
| Republican | Robert S. Dinsmore | 52,905 | 28.97 | |
| American Independent | Gordon Mors | 4,649 | 2.55 | |
| Total votes | 182,596 | 100.0 | ||
| Turnout | {{{votes}}} | |||
| Democratic hold | ||||
1996
| Party | Candidate | Votes | % | |
|---|---|---|---|---|
| Democratic | Robert Matsui (Incumbent) | 142,618 | 70.5 | |
| Republican | Robert Dinsmore | 52,940 | 26.2 | |
| Libertarian | Joseph Miller | 2,548 | 1.2 | |
| American Independent | Gordon Mors | 2,231 | 1.1 | |
| Natural Law | Charles Kersey | 2,123 | 1.0 | |
| Total votes | 202,460 | 100.0 | ||
| Turnout | {{{votes}}} | |||
| Democratic hold | ||||
1998
| Party | Candidate | Votes | % | |
|---|---|---|---|---|
| Democratic | Robert Matsui (Incumbent) | 130,715 | 71.89 | |
| Republican | Robert Dinsmore | 47,307 | 26.02 | |
| Libertarian | Douglas Arthur Tuma | 3,746 | 2.06 | |
| Green | Ken Adams (write-in) | 70 | 0.04 | |
| Total votes | 181,838 | 100.0 | ||
| Turnout | {{{votes}}} | |||
| Democratic hold | ||||
2000
| Party | Candidate | Votes | % | |
|---|---|---|---|---|
| Democratic | Robert Matsui (Incumbent) | 147,025 | 68.1 | |
| Republican | Ken Payne | 55,945 | 25.9 | |
| Green | Ken Adams | 6,195 | 2.9 | |
| Libertarian | Cullene Lang | 3,746 | 1.7 | |
| Natural Law | Alan Barreca | 2,894 | 1.3 | |
| Total votes | 215,805 | 100.0 | ||
| Turnout | {{{votes}}} | |||
| Democratic hold | ||||
2002
| Party | Candidate | Votes | % | |
|---|---|---|---|---|
| Democratic | Robert Matsui (Incumbent) | 90,697 | 70.9 | |
| Republican | Richard Frankhuizen | 33,313 | 26.1 | |
| Libertarian | Timothy E. Roloff | 3,923 | 3.0 | |
| Total votes | 189,717 | 100.0 | ||
| Turnout | {{{votes}}} | |||
| Democratic hold | ||||
2004
| Party | Candidate | Votes | % | |
|---|---|---|---|---|
| Democratic | Robert Matsui (Incumbent) | 138,004 | 71.4 | |
| Republican | Mike Dugas | 45,120 | 23.4 | |
| Green | Pat Driscoll | 6,593 | 3.4 | |
| Peace and Freedom | John C. Reiger | 3,670 | 1.8 | |
| Total votes | 193,387 | 100.0 | ||
| Turnout | {{{votes}}} | |||
| Democratic hold | ||||
2005 (special)
Incumbent Robert Matsui died January 1, 2005. In a special election held on March 8, 2005, to fill the vacancy, Matsui's widow, Doris, won the seat with almost 68% of the vote. She was sworn in on March 10, 2005.
| Party | Candidate | Votes | % | |
|---|---|---|---|---|
| Democratic | Doris Matsui | 56,175 | 67.65 | |
| Democratic | Julie Padilla | 7,158 | 8.62 | |
| Republican | John Flynn | 6,559 | 7.90 | |
| Republican | Serge Chernay | 3,742 | 4.51 | |
| Republican | Michael O'Brien | 2,591 | 3.12 | |
| Republican | Shane Singh | 1,753 | 2.11 | |
| Republican | Bruce Stevens | 1,124 | 1.35 | |
| Green | Pat Driscoll | 976 | 1.18 | |
| Independent | Leonard Padilla | 916 | 1.10 | |
| Democratic | Charles Pineda | 659 | 0.79 | |
| Libertarian | Gale Morgan | 451 | 0.54 | |
| Peace and Freedom | John Reiger | 286 | 0.34 | |
| Democratic | Lara Shapiro (write-in) | 6 | 0.01 | |
| Invalid or blank votes | 637 | 0.77 | ||
| Total votes | 83,033 | 100.0 | ||
| Turnout | {{{votes}}} | 27.72 | ||
| Democratic hold | ||||
2006
| Party | Candidate | Votes | % | |
|---|---|---|---|---|
| Democratic | Doris Matsui (Incumbent) | 89,119 | 70.7 | |
| Republican | Xiaochin Claire Yan | 29,824 | 23.7 | |
| Green | Jeff Kravitz | 5,394 | 4.3 | |
| Peace and Freedom | John C. Reiger | 1,716 | 1.3 | |
| Total votes | 126,053 | 100.0 | ||
| Turnout | {{{votes}}} | |||
| Democratic hold | ||||
2008
| Party | Candidate | Votes | % | |
|---|---|---|---|---|
| Democratic | Doris Matsui (Incumbent) | 164,242 | 74.3 | |
| Republican | Paul A. Smith | 46,002 | 20.9 | |
| Peace and Freedom | L. R. Roberts | 10,731 | 4.8 | |
| Independent | David B.Lynch (write-in candidate) | 180 | 0.0 | |
| Total votes | 221,155 | 100 | ||
| Turnout | {{{votes}}} | |||
| Democratic hold | ||||
2010
| Party | Candidate | Votes | % | |
|---|---|---|---|---|
| Democratic | Doris Matsui (Incumbent) | 124,220 | 72% | |
| Republican | Paul A. Smith | 43,577 | 25% | |
| Peace and Freedom | Gerald Allen Frink | 4,594 | 3% | |
| Total votes | 172,391 | 100% | ||
| Turnout | {{{votes}}} | |||
| Democratic hold | ||||
2012
| Party | Candidate | Votes | % | |
|---|---|---|---|---|
| Democratic | Mike Thompson (Incumbent) | 202,872 | 74.5% | |
| Republican | Randy Loftin | 69,545 | 25.5% | |
| Total votes | 272,417 | 100.0% | ||
| Democratic hold | ||||
2014
| Party | Candidate | Votes | % | |
|---|---|---|---|---|
| Democratic | Mike Thompson (Incumbent) | 129,613 | 75.7% | |
| No party preference | James Hinton | 41,535 | 24.3% | |
| Total votes | 171,148 | 100.0% | ||
| Democratic hold | ||||
2016
| Party | Candidate | Votes | % | |
|---|---|---|---|---|
| Democratic | Mike Thompson (Incumbent) | 224,526 | 76.9% | |
| Republican | Carlos Santamaria | 67,565 | 23.1% | |
| Total votes | 292,091 | 100.0% | ||
| Democratic hold | ||||
2018
| Party | Candidate | Votes | % | |
|---|---|---|---|---|
| Democratic | Mike Thompson (Incumbent) | 205,860 | 78.9% | |
| No party preference | Anthony Mills | 55,158 | 21.1% | |
| Total votes | 261,018 | 100.0% | ||
| Democratic hold | ||||
2020
| Party | Candidate | Votes | % | |
|---|---|---|---|---|
| Democratic | Mike Thompson (incumbent) | 271,233 | 76.1 | |
| Republican | Scott Giblin | 85,227 | 23.9 | |
| Total votes | 356,460 | 100.0 | ||
| Democratic hold | ||||
2022
| Party | Candidate | Votes | % | |
|---|---|---|---|---|
| Republican | Tom McClintock (incumbent) | 173,524 | 61.3 | |
| Democratic | Michael J. Barkley | 109,506 | 38.7 | |
| Total votes | 283,030 | 100.0 | ||
| Republican hold | ||||
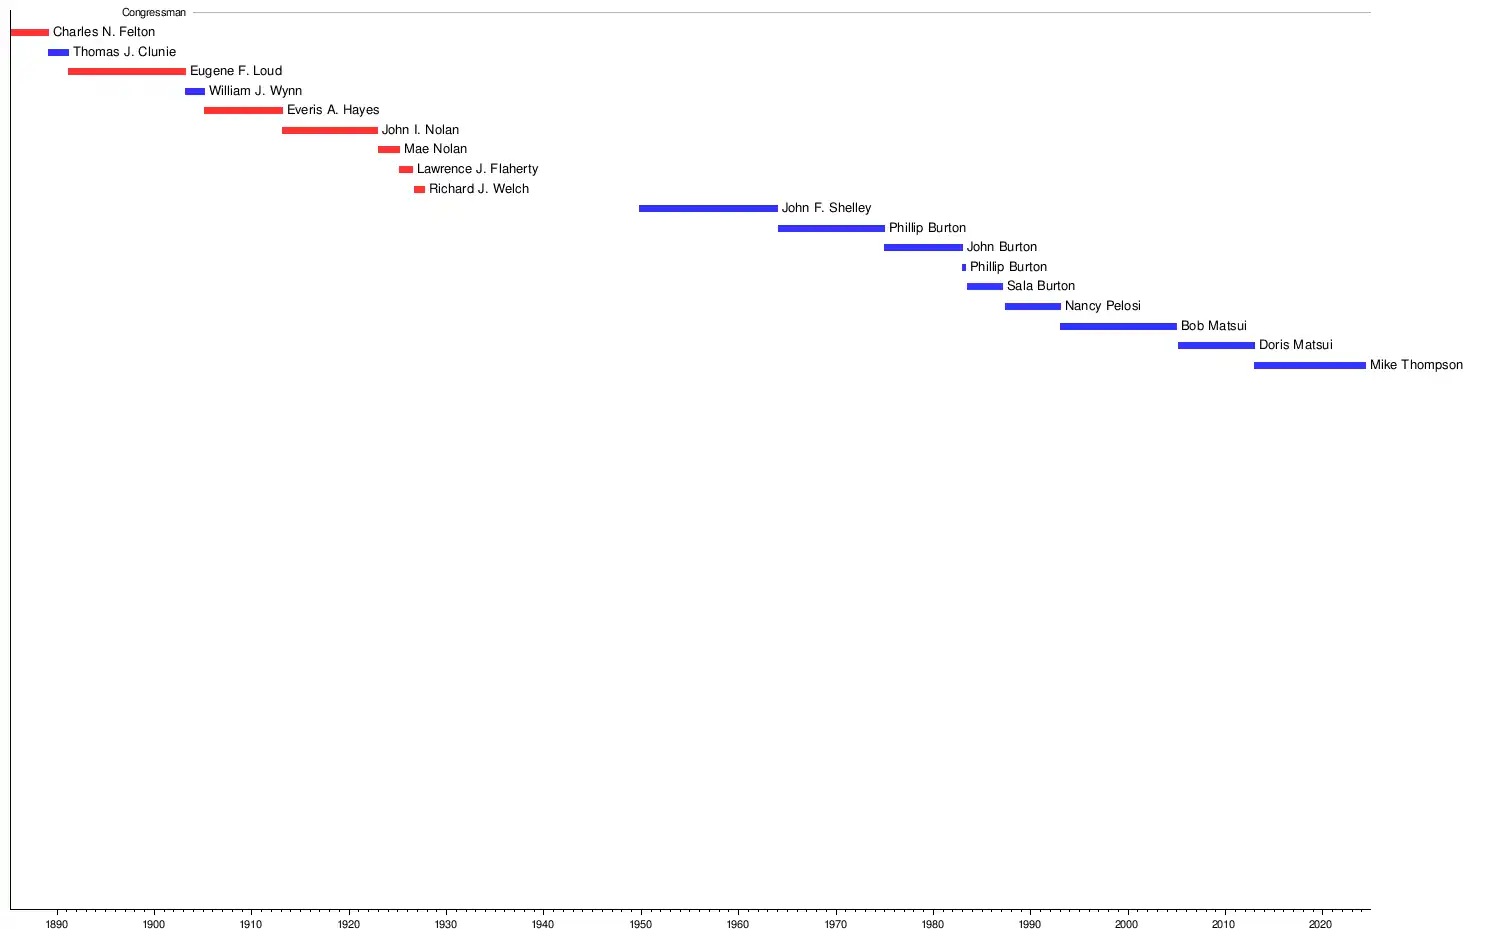
Timeline of representatives
The following timeline depicts the progression of the representatives and their political affiliation at the time of assuming office.
References
- "CA 2022 Congressional". Dave's Redistricting. January 4, 2022. Retrieved January 3, 2023.
- "My Congressional District".
- "2022 Cook PVI: District Map and List". The Cook Political Report. July 12, 2022. Retrieved January 3, 2023.
- Statement of Vote (2000 President) Archived June 11, 2007, at the Wayback Machine
- Statement of Vote (2000 Senator) Archived June 11, 2007, at the Wayback Machine
- Statement of Vote (2002 Governor) Archived November 11, 2010, at the Wayback Machine
- Statement of Vote (2003 Recall Question) Archived May 20, 2011, at the Wayback Machine
- Statement of Vote (2003 Governor) Archived May 20, 2011, at the Wayback Machine
- Statement of Vote (2004 President) Archived August 1, 2010, at the Wayback Machine
- Statement of Vote (2004 Senator) Archived August 10, 2011, at the Wayback Machine
- Statement of Vote (2006 Senator) Archived August 10, 2011, at the Wayback Machine
- "California Secretary of State. Supplement to the Statement of Vote. President. Counties by Congressional District" (PDF). Archived from the original (PDF) on October 18, 2012. Retrieved April 13, 2015.
- Statement of Vote (2010 Governor Archived May 20, 2011, at the Wayback Machine
- Statement of Vote (2010 Governor) Archived May 20, 2011, at the Wayback Machine
- Supplement to the Statement of Vote. Counties by Congressional Districts for President ca.gov
- Supplement to the Statement of Vote
- Supplement to the Statement of Vote ca.gov
- "General Election–Statement of Vote, November 8, 2016 :: California Secretary of State".
- "General Election–Statement of Vote, November 8, 2016 :: California Secretary of State".
- Supplement to the Statement of Vote ca.gov
- Supplement to the Statement of Vote ca.gov
- "Daily Kos Elections' presidential results by congressional district for 2020, 2016, and 2012".
- "Counties by Congressional District for Recall Question" (PDF). sos.ca.gov. September 14, 2021. Retrieved May 2, 2022.
- Supplement to the Statement of Vote ca.gov
- 1920 election results
- 1922 election results
- 1923 special election results
- 1924 election results
- 1926 special election results
- 1926 election results
- 1928 election results
- 1930 election results
- 1932 election results
- 1934 election results
- 1936 election results
- 1938 election results
- 1940 election results
- 1942 election results
- 1944 election results
- 1946 election results
- 1948 election results
- 1949 special election results
- 1950 election results
- 1952 election results
- 1954 election results
- 1956 election results
- 1958 election results
- 1960 election results
- 1962 election results
- 1964 election results
- 1966 election results
- 1968 election results
- 1970 election results
- 1972 election results
- 1974 election results
- 1976 election results
- 1978 election results
- 1980 election results
- 1982 election results
- 1983 special election results
- 1984 election results
- 1986 election results
- 1987 special election results
- 1988 election results
- 1990 election results
- 1992 election results
- 1994 election results
- 1996 election results
- 1998 election results
- 2000 election results
- 2002 election results Archived February 3, 2009, at the Wayback Machine
- 2004 election results
- "Special Election Results" (PDF). Secretary of State of California. Archived from the original (PDF) on May 29, 2008. Retrieved May 29, 2008.
- 2006 election results Archived November 27, 2008, at the Wayback Machine
- Office of the California Secretary of State Archived December 21, 2008, at the Wayback Machine "United States Representative in Congress, (retrieved on August 9, 2009).
- Office of the California Secretary of State "United States Representative in Congress, (retrieved on March 24, 2011).
- https://elections.cdn.sos.ca.gov/sov/2012-general/06-sov-summary.xls
- https://elections.cdn.sos.ca.gov/sov/2014-general/xls/06-summary.xls
- https://elections.cdn.sos.ca.gov/sov/2016-general/sov/csv-candidates.xls
External links
- GovTrack.us: California's 5th congressional district
- RAND California Election Returns: District Definitions (out of date)
- California Voter Foundation map - CD05 (out of date)
- Interview of Paul Smith, Republican candidate for the 5th CD recorded July 15, 2008 in Sacramento, CA