California's 8th congressional district
California's 8th congressional district is a congressional district in the U.S. state of California. As of 2023, Democrat John Garamendi represents the district. Currently, the 8th district includes parts of the Bay Area counties of Contra Costa County and Solano County, including the cities of Vallejo, Fairfield, Richmond and parts of Martinez.
| California's 8th congressional district | |||
|---|---|---|---|
Interactive map of district boundaries since 2023 (Used in the 2022 elections) | |||
| Representative |
| ||
| Population (2022) | 748,189 | ||
| Median household income | $91,501[1] | ||
| Ethnicity |
| ||
| Cook PVI | D+26[2] | ||
.svg.png.webp)
Competitiveness
Before the 2011 redistricting, the 8th district was a Democratic stronghold. It gave John Kerry his best performance in California in 2004, backing the Democrat with 84.2% of the vote. Barack Obama continued on this trend in 2008 when he received 85.22% of the vote in the district while John McCain received 12.38%.
The 8th district from 2013-2023 was located in a politically conservative region of the state with a "Strongly Republican" Cook Partisan Voting Index of R+10. The Cook Political Report ranked it the 87th most Republican-leaning congressional district in the United States.[3]
In the 2012 election, the first after the state's adoption of top-two primaries, the 8th district was one of only two in California where two Republicans faced each other in a runoff election.[4] In 2018, it was the only such California district.[5]
Election results from statewide races
| Year | Office | Winner | Tally |
|---|---|---|---|
| 1992 | President | Clinton | 75.6 – 15.9% |
| Senator | Boxer | 79.1 – 16.3% | |
| Senator | Feinstein | 82.4 – 14.0% | |
| 1994 | Governor[6] | Brown | 72.1 – 24.8% |
| Senator[7] | Feinstein | 80.7 – 13.7% | |
| 1996 | President[8] | Clinton | 66.0 – 18.0% |
| 1998 | Governor[9] | Davis | 81.8 – 13.2% |
| Senator[10] | Boxer | 78.0 – 19.2% | |
| 2000 | President[11] | Gore | 76.7 – 14.6% |
| Senator[12] | Feinstein | 72.6 – 14.1% | |
| 2002 | Governor[13] | Davis | 66.7 – 13.9% |
| 2003 | Recall[14][15] | No | 81.4 – 18.6% |
| Bustamante | 64.7 – 17.8% | ||
| 2004 | President[16] | Kerry | 84.2 – 14.0% |
| Senator[17] | Boxer | 83.7 – 11.7% | |
| 2006 | Governor[18] | Angelides | 64.3 – 27.9% |
| Senator[19] | Feinstein | 80.4 – 7.7% | |
| 2008 | President[20] | Obama | 85.2 – 12.4% |
| 2010 | Governor | Brown | 80.0 – 16.4% |
| Senator | Boxer | 81.3 – 14.7% | |
| 2012 | President | Romney | 55.6 – 41.7% |
| 2014 | Governor[21] | Kashkari | 62.3 – 37.7% |
| 2016 | President | Trump | 54.7 – 39.6% |
| Senator[22] | Harris | 55.1 – 44.9% | |
| 2018 | Governor[23] | Cox | 59.8 – 40.2% |
| Senator[24] | de Leon | 54.3 – 45.7% | |
| 2020 | President | Trump | 54 – 43.6% |
| 2021 | Recall[25] | Yes | 60.2 – 39.8% |
| 2022 | Governor[26] | Newsom | 73.9 – 26.1% |
| Senator | Padilla | 75.4 – 24.6% |
Composition
| # | County | Seat | Population |
|---|---|---|---|
| 13 | Contra Costa | Martinez | 1,161,413 |
| 95 | Solano | Fairfield | 451,716 |
As of 2023, California's 8th congressional district was significantly changed, now being located between the Sacramento and San Joaquin Valleys. It encompasses part of Contra Costa and Solano Counties.
Contra Costa County is split between this district and the 10th district. They are partitioned by Grizzly Peak Blvd, Seaview Trail, Camino Pablo, Bear Creek Rd, San Pablo Creek, Bear Creek, Brianes Reservoir, Burlington Northern Santa Fe, Highway 4, Alhambra Ave, Pacheco Blvd, Grandview Ave, Central Ave, Imhoff Dr, Bares Ave, Mount Diablo Creek, Union Pacific, Contra Costa Canal, 4WD Rd, Bailey Rd, James Donlon Blvd, Cambridge Dr, Reseda Way, S Royal links Cir, Carpinteria Dr, Barmouth Dr, Hillcrest Ave, Highway 4, and Highway 160. The 8th district takes in the north side of the cities of Antioch and Martinez, the cities of Pittsburg, Richmond, San Pablo, El Cerrito, Pinole, and Hercules.
Solano County is split between this district and the 4th district. They are partitioned by Soda Springs Rd, Union Pacific, Alamo Dr, Leisure Town Rd, Hawkins Rd, Bay Area Exxextric, Shilo Rd, Collinsville Rd, and Montezuma Slough. The 8th district takes in the cities of Vallejo, Fairfield, Suisun City, and Benicia.
List of members representing the district
| Member | Party | Dates | Cong ress(es) |
Electoral history | Counties |
|---|---|---|---|---|---|
| District created March 4, 1903 | |||||
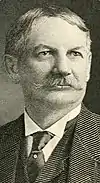
.jpg.webp) Milton J. Daniels (Riverside) |
Republican | March 4, 1903 – March 3, 1905 |
58th | Elected in 1902. Retired. |
1903–1913 Imperial, Inyo, Kern, Orange, Riverside, San Bernardino, San Diego, San Luis Obispo, Santa Barbara, Tulare, Ventura |
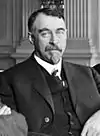
 Sylvester C. Smith (Bakersfield) |
Republican | March 4, 1905 – January 26, 1913 |
59th 60th 61st 62nd |
Elected in 1904. Re-elected in 1906. Re-elected in 1908. Re-elected in 1910. Died. | |
| Vacant | January 27, 1913 – March 3, 1913 |
62nd | |||
 Everis A. Hayes (San Jose) |
Republican | March 4, 1913 – March 3, 1919 |
63rd 64th 65th |
Redistricted from the 5th district and re-elected in 1912. Re-elected in 1914. Re-elected in 1916. Lost re-election. |
1913–1933 Monterey, San Benito, San Luis Obispo, San Mateo, Santa Barbara, Santa Clara, Santa Cruz, Ventura |
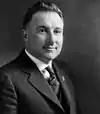
 Hugh S. Hersman (Gilroy) |
Democratic | March 4, 1919 – March 3, 1921 |
66th | Elected in 1918. Lost re-election. | |
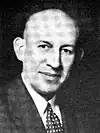
 Arthur M. Free (San Jose) |
Republican | March 4, 1921 – March 3, 1933 |
67th 68th 69th 70th 71st 72nd |
Elected in 1920. Re-elected in 1922. Re-elected in 1924. Re-elected in 1926. Re-elected in 1928. Re-elected in 1930. Lost re-election. | |
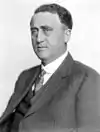
.jpg.webp) John J. McGrath (San Mateo) |
Democratic | March 4, 1933 – January 3, 1939 |
73rd 74th 75th |
Elected in 1932. Re-elected in 1934. Re-elected in 1936. Lost re-election. |
1933–1943 Monterey, San Benito, San Mateo, Santa Clara, Santa Cruz |
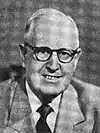
 Jack Z. Anderson (San Juan Bautista) |
Republican | January 3, 1939 – January 3, 1953 |
76th 77th 78th 79th 80th 81st 82nd |
Elected in 1938. Re-elected in 1940. Re-elected in 1942. Re-elected in 1944. Re-elected in 1946. Re-elected in 1948. Re-elected in 1950. Retired. | |
| 1943–1953 San Benito, San Mateo, Santa Clara, Santa Cruz | |||||
 George P. Miller (Alameda) |
Democratic | January 3, 1953 – January 3, 1973 |
83rd 84th 85th 86th 87th 88th 89th 90th 91st 92nd |
Redistricted from the 6th district and re-elected in 1952. Re-elected in 1954. Re-elected in 1956. Re-elected in 1958. Re-elected in 1960. Re-elected in 1962. Re-elected in 1964. Re-elected in 1966. Re-elected in 1968. Re-elected in 1970. Lost renomination. |
1953–1975 Alameda outside Oakland |
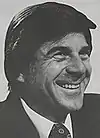 Pete Stark (Danville) |
Democratic | January 3, 1973 – January 3, 1975 |
93rd | Elected in 1972. Redistricted to the 9th district. | |
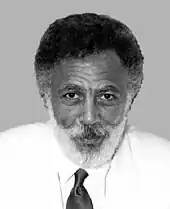 Ron Dellums (Berkeley) |
Democratic | January 3, 1975 – January 3, 1993 |
94th 95th 96th 97th 98th 99th 100th 101st 102nd |
Redistricted from the 7th district and re-elected in 1974. Re-elected in 1976. Re-elected in 1978. Re-elected in 1980. Re-elected in 1982. Re-elected in 1984. Re-elected in 1986. Re-elected in 1988. Re-elected in 1990. Redistricted to the 9th district. |
1975–1983 Alameda (Oakland) |
| 1983–1993 Alameda (Oakland), southwestern Contra Costa | |||||
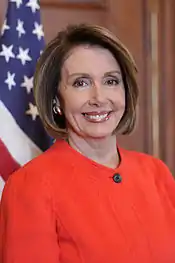 Nancy Pelosi (San Francisco) |
Democratic | January 3, 1993 – January 3, 2013 |
103rd 104th 105th 106th 107th 108th 109th 110th 111th 112th |
Redistricted from the 5th district and re-elected in 1992. Re-elected in 1994. Re-elected in 1996. Re-elected in 1998. Re-elected in 2000. Re-elected in 2002. Re-elected in 2004. Re-elected in 2006. Re-elected in 2008. Re-elected in 2010. Redistricted to the 12th district. |
1993–2003 Most of San Francisco |
2003–2013: Most of San Francisco | |||||
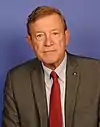 Paul Cook (Yucca Valley) |
Republican | January 3, 2013 – December 7, 2020 |
113th 114th 115th 116th |
Elected in 2012. Re-elected in 2014. Re-elected in 2016. Re-elected in 2018. Resigned when elected to the San Bernardino County Board of Supervisors. |
2013–2023.tif.png.webp) Inyo, Mono, most of San Bernardino |
| Vacant | December 7, 2020 – January 3, 2021 |
116th | |||
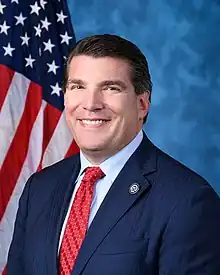 Jay Obernolte (Big Bear Lake) |
Republican | January 3, 2021 – January 3, 2023 |
117th | Elected in 2020. Redistricted to the 23rd district. | |
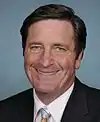 John Garamendi (Walnut Grove) |
Democratic | January 3, 2023 – present |
118th | Redistricted from the 3rd district and re-elected in 2022. | 2023–present_(new_version).svg.png.webp) Parts of Contra Costa and Solano |
Election results
1902
| Party | Candidate | Votes | % | ||
|---|---|---|---|---|---|
| Republican | Milton J. Daniels | 20,135 | 55.6% | ||
| Democratic | William E. Smythe | 15,819 | 40.8% | ||
| Socialist | Noble A. Richardson | 2,091 | 5.4% | ||
| Prohibition | Ellsworth Leonardson | 762 | 2.0% | ||
| Total votes | 38,807 | 100.0% | |||
| Republican win (new seat) | |||||
1904
| Party | Candidate | Votes | % | |
|---|---|---|---|---|
| Republican | Sylvester C. Smith | 23,683 | 55.6% | |
| Democratic | William T. Lucas | 12,861 | 34.5% | |
| Socialist | Noble A. Richardson | 4,636 | 9.9% | |
| Prohibition | Benjamin J. Cloes | 1,430 | 3.4% | |
| Total votes | 42,610 | 100.0% | ||
| Republican hold | ||||
1906
| Party | Candidate | Votes | % | |
|---|---|---|---|---|
| Republican | Sylvester C. Smith (Incumbent) | 22,548 | 55.6% | |
| Democratic | Charles A. Barlow | 13,992 | 34.5% | |
| Socialist | Noble A. Richardson | 4,003 | 9.9% | |
| Total votes | 40,543 | 100.0% | ||
| Republican hold | ||||
1908
| Party | Candidate | Votes | % | |
|---|---|---|---|---|
| Republican | Sylvester C. Smith (Incumbent) | 28,202 | 50.5% | |
| Democratic | William G. Irving | 18,958 | 33.9% | |
| Socialist | George A. Garrett | 7,302 | 13.1% | |
| Prohibition | James S. Edwards | 1,379 | 2.5% | |
| Total votes | 45,831 | 100.0% | ||
| Republican hold | ||||
1910
| Party | Candidate | Votes | % | |
|---|---|---|---|---|
| Republican | Sylvester C. Smith (Incumbent) | 28,202 | 50.5% | |
| Democratic | William G. Irving | 18,958 | 33.9% | |
| Socialist | George A. Garrett | 7,302 | 13.1% | |
| Prohibition | James S. Edwards | 1,379 | 2.5% | |
| Total votes | 45,831 | 100.0% | ||
| Republican hold | ||||
1912
| Party | Candidate | Votes | % | |
|---|---|---|---|---|
| Republican | Everis A. Hayes (Incumbent) | 29,861 | 50.9% | |
| Democratic | James B. Holohan | 20,620 | 35.2% | |
| Progressive | Robert Whitaker | 8,125 | 13.9% | |
| Total votes | 58,606 | 100.0% | ||
| Republican hold | ||||
1914
| Party | Candidate | Votes | % | |
|---|---|---|---|---|
| Republican | Everis A. Hayes (Incumbent) | 36,499 | 49.1% | |
| Progressive | Lewis Dan Bohnett | 33,706 | 45.3% | |
| Prohibition | Joseph Merritt Horton | 4,157 | 5.6% | |
| Total votes | 74,362 | 100.0% | ||
| Republican hold | ||||
1916
| Party | Candidate | Votes | % | |
|---|---|---|---|---|
| Republican | Everis A. Hayes (Incumbent) | 50,659 | 68.6% | |
| Progressive | George S. Walker | 17,576 | 23.8% | |
| Socialist | Cora Pattleton Wilson | 5,564 | 7.5% | |
| Total votes | 73,799 | 100.0% | ||
| Republican hold | ||||
1918
| Party | Candidate | Votes | % | |||
|---|---|---|---|---|---|---|
| Democratic | Hugh S. Hersman | 31,167 | 53% | |||
| Republican | Everis A. Hayes (Incumbent) | 27,641 | 47% | |||
| Total votes | 58,808 | 100% | ||||
| Democratic gain from Republican | ||||||
1920
| Party | Candidate | Votes | % | |||
|---|---|---|---|---|---|---|
| Republican | Arthur M. Free | 46,823 | 64% | |||
| Democratic | Hugh S. Hersman (Incumbent) | 26,311 | 36% | |||
| Total votes | 73,134 | 100% | ||||
| Republican gain from Democratic | ||||||
1922
| Party | Candidate | Votes | % | |
|---|---|---|---|---|
| Republican | Arthur M. Free (Incumbent) | 57,926 | 100.0% | |
| Republican hold | ||||
1924
| Party | Candidate | Votes | % | |
|---|---|---|---|---|
| Republican | Arthur M. Free (Incumbent) | 55,713 | 100.0% | |
| Republican hold | ||||
1926
| Party | Candidate | Votes | % | |
|---|---|---|---|---|
| Republican | Arthur M. Free (Incumbent) | 60,384 | 67.7% | |
| Democratic | Philip G. Sheehy | 28,836 | 32.3% | |
| Total votes | 89,220 | 100.0% | ||
| Republican hold | ||||
1928
| Party | Candidate | Votes | % | |
|---|---|---|---|---|
| Republican | Arthur M. Free (Incumbent) | 80,613 | 68% | |
| Democratic | Cecelia M. Casserly | 37,947 | 32% | |
| Total votes | 118,560 | 100% | ||
| Republican hold | ||||
1930
| Party | Candidate | Votes | % | |
|---|---|---|---|---|
| Republican | Arthur M. Free (Incumbent) | 93,377 | 100.0% | |
| Republican hold | ||||
1932
| Party | Candidate | Votes | % | |||
|---|---|---|---|---|---|---|
| Democratic | John J. McGrath | 65,455 | 56.9% | |||
| Republican | Arthur M. Free (Incumbent) | 49,487 | 43.1% | |||
| Total votes | 114,942 | 100.0% | ||||
| Democratic gain from Republican | ||||||
1934
| Party | Candidate | Votes | % | |
|---|---|---|---|---|
| Democratic | John J. McGrath (Incumbent) | 107,325 | 100.0% | |
| Democratic hold | ||||
1936
| Party | Candidate | Votes | % | |
|---|---|---|---|---|
| Democratic | John J. McGrath (Incumbent) | 78,557 | 57.6% | |
| Republican | Alonzo L. Baker | 57,808 | 43.4% | |
| Total votes | 136,365 | 100.0% | ||
| Democratic hold | ||||
1938
| Party | Candidate | Votes | % | |||
|---|---|---|---|---|---|---|
| Republican | Jack Z. Anderson | 84,084 | 55% | |||
| Democratic | John J. McGrath (Incumbent) | 68,681 | 45% | |||
| Total votes | 152,765 | 100% | ||||
| Republican gain from Democratic | ||||||
1940
| Party | Candidate | Votes | % | |
|---|---|---|---|---|
| Republican | Jack Z. Anderson (Incumbent) | 148,180 | 96.7% | |
| Communist | Elizabeth Nichols | 5,186 | 3.3% | |
| Democratic | John J. McGrath (write-in) | 37 | 0.1% | |
| Total votes | 153,403 | 100.0% | ||
| Republican hold | ||||
1942
| Party | Candidate | Votes | % | |
|---|---|---|---|---|
| Republican | Jack Z. Anderson (Incumbent) | 91,536 | 99.9% | |
| Communist | Elizabeth Nichols (write-in) | 102 | 0.1% | |
| Total votes | 91,638 | 100.0% | ||
| Republican hold | ||||
1944
| Party | Candidate | Votes | % | |
|---|---|---|---|---|
| Republican | Jack Z. Anderson (Incumbent) | 94,218 | 56.5% | |
| Democratic | Arthur L. Johnson | 72,420 | 43.5% | |
| Total votes | 166,638 | 100.0% | ||
| Republican hold | ||||
1946
| Party | Candidate | Votes | % | |
|---|---|---|---|---|
| Republican | Jack Z. Anderson (Incumbent) | 113,325 | 100.0% | |
| Republican hold | ||||
1948
| Party | Candidate | Votes | % | |
|---|---|---|---|---|
| Republican | Jack Z. Anderson (Incumbent) | 161,743 | 79.9% | |
| Progressive | Paul Taylor | 40,670 | 20.1% | |
| Total votes | 202,413 | 100.0% | ||
| Republican hold | ||||
1950
| Party | Candidate | Votes | % | |
|---|---|---|---|---|
| Republican | Jack Z. Anderson (Incumbent) | 168,510 | 83.1% | |
| Progressive | John A. Peterson | 34,176 | 16.9% | |
| Total votes | 202,686 | 100.0% | ||
| Republican hold | ||||
1952
| Party | Candidate | Votes | % | |
|---|---|---|---|---|
| Democratic | George P. Miller (Incumbent) | 156,445 | 100.0% | |
| Democratic hold | ||||
1954
| Party | Candidate | Votes | % | |
|---|---|---|---|---|
| Democratic | George P. Miller (Incumbent) | 101,803 | 65.4% | |
| Republican | Jessie M. Ritchie | 53,869 | 34.6% | |
| Total votes | 155,672 | 100.0% | ||
| Democratic hold | ||||
1956
| Party | Candidate | Votes | % | |
|---|---|---|---|---|
| Democratic | George P. Miller (Incumbent) | 136,720 | 65.6% | |
| Republican | Robert Lee Watkins | 71,700 | 34.4% | |
| Total votes | 208,420 | 100.0% | ||
| Democratic hold | ||||
1958
| Party | Candidate | Votes | % | |
|---|---|---|---|---|
| Democratic | George P. Miller (Incumbent) | 181,437 | 100.0% | |
| Democratic hold | ||||
1960
| Party | Candidate | Votes | % | |
|---|---|---|---|---|
| Democratic | George P. Miller (Incumbent) | 152,476 | 62% | |
| Republican | Robert E. Hannon | 93,403 | 38% | |
| Total votes | 245,879 | 100% | ||
| Democratic hold | ||||
1962
| Party | Candidate | Votes | % | |
|---|---|---|---|---|
| Democratic | George P. Miller (Incumbent) | 97,014 | 72.5% | |
| Republican | Harold Petersen | 36,810 | 27.5% | |
| Total votes | 133,824 | 100.0% | ||
| Democratic hold | ||||
1964
| Party | Candidate | Votes | % | |
|---|---|---|---|---|
| Democratic | George P. Miller (Incumbent) | 108,771 | 70.3% | |
| Republican | Donald E. McKay | 46,063 | 29.7% | |
| Total votes | 154,834 | 100.0% | ||
| Democratic hold | ||||
1966
| Party | Candidate | Votes | % | |
|---|---|---|---|---|
| Democratic | George P. Miller (Incumbent) | 92,263 | 65.4% | |
| Republican | Raymond P. Britton | 48,727 | 34.6% | |
| Total votes | 140,990 | 100.0% | ||
| Democratic hold | ||||
1968
| Party | Candidate | Votes | % | |
|---|---|---|---|---|
| Democratic | George P. Miller (Incumbent) | 104,231 | 64% | |
| Republican | Raymond P. Britton | 58,584 | 36% | |
| Total votes | 162,815 | 100% | ||
| Democratic hold | ||||
1970
| Party | Candidate | Votes | % | |
|---|---|---|---|---|
| Democratic | George P. Miller (Incumbent) | 104,311 | 69% | |
| Republican | Michael A. Crane | 46,872 | 31% | |
| Total votes | 151,183 | 100% | ||
| Democratic hold | ||||
1972
| Party | Candidate | Votes | % | |
|---|---|---|---|---|
| Democratic | Pete Stark | 101,024 | 52.9% | |
| Republican | Lew M. Warden Jr. | 89,948 | 47.1% | |
| Total votes | 190,972 | 100.0% | ||
| Democratic hold | ||||
1974
| Party | Candidate | Votes | % | |
|---|---|---|---|---|
| Democratic | Ron Dellums (Incumbent) | 93,106 | 56.6% | |
| Republican | Jack Redden | 65,432 | 39.6% | |
| American Independent | John Holland | 6,324 | 3.8% | |
| Total votes | 164,862 | 100.0% | ||
| Democratic hold | ||||
1976
| Party | Candidate | Votes | % | |
|---|---|---|---|---|
| Democratic | Ron Dellums (Incumbent) | 122,342 | 62.1% | |
| Republican | Philip Stiles Breck Jr. | 68,374 | 34.7% | |
| Peace and Freedom | Robert J. Evans | 6,238 | 3.2% | |
| Total votes | 196,954 | 100.0% | ||
| Democratic hold | ||||
1978
| Party | Candidate | Votes | % | |
|---|---|---|---|---|
| Democratic | Ron Dellums (Incumbent) | 94,824 | 57.4% | |
| Republican | Charles V. Hughes | 70,481 | 42.6% | |
| Total votes | 165,305 | 100.0% | ||
| Democratic hold | ||||
1980
| Party | Candidate | Votes | % | |
|---|---|---|---|---|
| Democratic | Ron Dellums (Incumbent) | 108,380 | 55.5% | |
| Republican | Charles V. Hughes | 76,580 | 39.2% | |
| Libertarian | Tod Mikuriya | 10,465 | 5.4% | |
| Total votes | 195,425 | 100.0% | ||
| Democratic hold | ||||
1982
| Party | Candidate | Votes | % | |
|---|---|---|---|---|
| Democratic | Ron Dellums (Incumbent) | 121,537 | 55.9% | |
| Republican | Claude B. Hutchinson Jr. | 95,694 | 44.1% | |
| Total votes | 217,231 | 100.0% | ||
| Democratic hold | ||||
1984
| Party | Candidate | Votes | % | |
|---|---|---|---|---|
| Democratic | Ron Dellums (Incumbent) | 144,316 | 60.3% | |
| Republican | Charles Connor | 94,907 | 39.7% | |
| Total votes | 239,223 | 100.0% | ||
| Democratic hold | ||||
1986
| Party | Candidate | Votes | % | |
|---|---|---|---|---|
| Democratic | Ron Dellums (Incumbent) | 121,790 | 60.0% | |
| Republican | Steven Eigenberg | 76,850 | 37.9% | |
| Peace and Freedom | Lawrence R. Manuel | 4,295 | 2.1% | |
| Total votes | 202,935 | 100.0% | ||
| Democratic hold | ||||
1988
| Party | Candidate | Votes | % | |
|---|---|---|---|---|
| Democratic | Ron Dellums (Incumbent) | 163,221 | 66.6% | |
| Republican | John J. Cuddihy Jr. | 76,531 | 31.2% | |
| Peace and Freedom | Tom Condit | 5,444 | 2.2% | |
| Total votes | 245,196 | 100.0% | ||
| Democratic hold | ||||
1990
| Party | Candidate | Votes | % | |
|---|---|---|---|---|
| Democratic | Ron Dellums (Incumbent) | 119,645 | 61.3% | |
| Republican | Barbara Galewski | 75,544 | 38.7% | |
| Total votes | 195,189 | 100.0% | ||
| Democratic hold | ||||
1992
| Party | Candidate | Votes | % | |
|---|---|---|---|---|
| Democratic | Nancy Pelosi (Incumbent) | 191,906 | 82.5% | |
| Republican | Marc Wolin | 25,693 | 11.0% | |
| Peace and Freedom | Cesar G. Cadabes | 7,572 | 3.3% | |
| Libertarian | James R. Elwood | 7,511 | 3.2% | |
| No party | Goldwater (write-in) | 9 | 0.0% | |
| Total votes | 222,691 | 100.0% | ||
| Democratic hold | ||||
1994
| Party | Candidate | Votes | % | |
|---|---|---|---|---|
| Democratic | Nancy Pelosi (Incumbent) | 137,642 | 81.85% | |
| Republican | Elsa C. Cheung | 30,528 | 18.15% | |
| No party | Bowman (write-in) | 1 | 0.00% | |
| Total votes | 168,171 | 100.0% | ||
| Democratic hold | ||||
1996
| Party | Candidate | Votes | % | |
|---|---|---|---|---|
| Democratic | Nancy Pelosi (Incumbent) | 175,216 | 84.4% | |
| Republican | Justin Raimondo | 25,739 | 12.4% | |
| Natural Law | David Smithstein | 6,783 | 3.2% | |
| Republican | Ed Murray (write-in) | 22 | 0.0% | |
| Total votes | 207,760 | 100.0% | ||
| Democratic hold | ||||
1998
| Party | Candidate | Votes | % | |
|---|---|---|---|---|
| Democratic | Nancy Pelosi (Incumbent) | 148,027 | 85.83% | |
| Republican | David J. Martz | 20,781 | 12.05% | |
| Natural Law | David Smithstein | 6,783 | 2.12% | |
| Total votes | 175,591 | 100.0% | ||
| Democratic hold | ||||
2000
| Party | Candidate | Votes | % | |
|---|---|---|---|---|
| Democratic | Nancy Pelosi (Incumbent) | 181,847 | 84.5% | |
| Republican | Adam Sparks | 25,298 | 11.7% | |
| Libertarian | Erik Bauman | 5,645 | 2.6% | |
| Natural Law | David Smithstein | 2,638 | 1.2% | |
| Total votes | 215,428 | 100.0% | ||
| Democratic hold | ||||
2002
| Party | Candidate | Votes | % | |
|---|---|---|---|---|
| Democratic | Nancy Pelosi (Incumbent) | 127,684 | 79.6% | |
| Republican | G. Michael German | 20,063 | 12.6% | |
| Green | Jay Pond | 10,033 | 6.2% | |
| Libertarian | Ira Spivack | 2,659 | 1.6% | |
| Socialist Workers | Deborah Liatos (write-in) | 2 | 0.0% | |
| Total votes | 160,441 | 100.0% | ||
| Democratic hold | ||||
2004
| Party | Candidate | Votes | % | |
|---|---|---|---|---|
| Democratic | Nancy Pelosi (Incumbent) | 224,017 | 83.0% | |
| Republican | Jennifer Depalma | 31,074 | 11.5% | |
| Green | Leilani Dowell | 9,527 | 3.5% | |
| Green | Terry Baum (write-in) | 5,446 | 2.0% | |
| Total votes | 270,064 | 100.0% | ||
| Democratic hold | ||||
2006
| Party | Candidate | Votes | % | |
|---|---|---|---|---|
| Democratic | Nancy Pelosi (Incumbent) | 148,435 | 80.4% | |
| Republican | Mike DeNunzio | 19,800 | 10.8% | |
| Green | Krissy Keefer | 13,653 | 7.4% | |
| Libertarian | Philip Zimt Berg | 2,751 | 1.4% | |
| Total votes | 184,639 | 100.0% | ||
| Democratic hold | ||||
2008
| Party | Candidate | Votes | % | |
|---|---|---|---|---|
| Democratic | Nancy Pelosi (Incumbent) | 204,996 | 71.7% | |
| Independent | Cindy Sheehan | 46,118 | 16.1% | |
| Republican | Dana Walsh | 27,614 | 9.7% | |
| Libertarian | Philip Zimt Berg | 6,504 | 2.3% | |
| Total votes | 285,247 | 100.0% | ||
| Democratic hold | ||||
2010
| Party | Candidate | Votes | % | |
|---|---|---|---|---|
| Democratic | Nancy Pelosi (Incumbent) | 167,957 | 80% | |
| Republican | John Dennis | 31,711 | 15% | |
| Peace and Freedom | Gloria La Riva | 5,161 | 3% | |
| Libertarian | Philip Berg | 4,843 | 2% | |
| Total votes | 209,672 | 100% | ||
| Democratic hold | ||||
2012
| Party | Candidate | Votes | % | |
|---|---|---|---|---|
| Republican | Paul Cook | 103,093 | 57.4% | |
| Republican | Gregg Imus | 76,551 | 42.6% | |
| Total votes | 179,644 | 100.0% | ||
| Republican hold | ||||
2014
| Party | Candidate | Votes | % | |
|---|---|---|---|---|
| Republican | Paul Cook (Incumbent) | 77,480 | 67.6% | |
| Democratic | Bob Conaway | 37,056 | 32.4% | |
| Total votes | 114,536 | 100.0% | ||
| Republican hold | ||||
2016
| Party | Candidate | Votes | % | |
|---|---|---|---|---|
| Republican | Paul Cook (Incumbent) | 136,972 | 62.3% | |
| Democratic | Rita Ramirez | 83,035 | 37.7% | |
| Total votes | 220,007 | 100.0% | ||
| Republican hold | ||||
2018
| Party | Candidate | Votes | % | |
|---|---|---|---|---|
| Republican | Paul Cook | 102,415 | 60.0% | |
| Republican | Tim Donnelly | 68,370 | 40.0% | |
| Total votes | 170,785 | 100.0% | ||
| Republican hold | ||||
2020
| Party | Candidate | Votes | % | |
|---|---|---|---|---|
| Republican | Jay Obernolte | 158,711 | 56.1% | |
| Democratic | Christine Bubser | 124,400 | 43.9% | |
| Total votes | 283,111 | 100% | ||
| Republican hold | ||||
2022
| Party | Candidate | Votes | % | |
|---|---|---|---|---|
| Democratic | John Garamendi (incumbent) | 145,501 | 75.7% | |
| Republican | Rudy Recile | 46,634 | 24.3% | |
| Total votes | 192,135 | 100% | ||
| Democratic hold | ||||
References
- Center for New Media & Promotion (CNMP), US Census Bureau. "My Congressional District". www.census.gov.
- "2022 Cook Partisan Voting Index (Cook PVI) District Map". Cook PVI. Retrieved January 8, 2023.
- "Partisan Voting Index Districts of the 113th Congress: 2004 & 2008" (PDF). The Cook Political Report. Archived from the original (PDF) on March 5, 2013. Retrieved February 13, 2013.
- "California Election Results, Nov. 6th, 2012". Los Angeles Times. Retrieved February 14, 2013.
- Panzar, Javier. "Democrats look likely to get locked out of this Republican-held congressional district in California". Los Angeles Times. Retrieved July 31, 2018.
- "Results" (PDF). elections.cdn.sos.ca.gov. 1994. Retrieved August 23, 2019.
- "Results" (PDF). elections.cdn.sos.ca.gov. 1994. Retrieved August 23, 2019.
- "Results" (PDF). elections.cdn.sos.ca.gov. 1996. Retrieved August 23, 2019.
- "Statement of Vote (1998 Governor)" (PDF). September 29, 2011. Archived from the original (PDF) on September 29, 2011.
- "Statement of Vote (1998 Senator)" (PDF). September 29, 2011. Archived from the original (PDF) on September 29, 2011.
- "Statement of Vote (2000 President)" (PDF). Archived from the original (PDF) on June 11, 2007.
- "Statement of Vote (2000 Senator)" (PDF). Archived from the original (PDF) on June 11, 2007.
- "Statement of Vote (2002 Governor)" (PDF). Archived from the original (PDF) on November 11, 2010.
- "Statement of Vote (2003 Recall Question)" (PDF). Archived from the original (PDF) on May 20, 2011.
- "Statement of Vote (2003 Governor)" (PDF). Archived from the original (PDF) on May 20, 2011.
- "Statement of Vote (2004 President)" (PDF). Archived from the original (PDF) on August 1, 2010.
- "Statement of Vote (2004 Senator)" (PDF). Archived from the original (PDF) on August 10, 2011.
- "Statement of Vote (2006 Governor)" (PDF). Archived from the original (PDF) on August 10, 2011.
- "Statement of Vote (2006 Senator)" (PDF). Archived from the original (PDF) on August 10, 2011.
- "(2008 President)". Archived from the original on February 11, 2009.
- "Results" (PDF). elections.cdn.sos.ca.gov. 2014. Retrieved August 23, 2019.
- "Results" (PDF). elections.cdn.sos.ca.gov. 2016. Retrieved August 23, 2019.
- Coleman, J. Miles (January 1, 2019). "Happy New Year everyone! To celebrate, #ElectionTwitter style, we're gonna be breaking down California's statewide races - all nine of them - from last year by Congressional District. (thread)".
- "Results" (PDF). elections.cdn.sos.ca.gov. 2018. Retrieved August 23, 2019.
- "Counties by Congressional District for Recall Question" (PDF). sos.ca.gov. September 14, 2021. Retrieved May 2, 2022.
- "Counties by Congressional Districts for Governor" (PDF). sos.ca.gov. November 8, 2022. Retrieved May 4, 2023.
- 1920 election results
- 1922 election results
- 1924 election results
- 1926 election results
- 1928 election results
- 1930 election results
- 1932 election results
- 1934 election results
- 1936 election results
- 1938 election results
- 1940 election results
- 1942 election results
- 1944 election results
- 1946 election results
- 1948 election results
- 1950 election results
- 1952 election results
- 1954 election results
- 1956 election results
- 1958 election results
- 1960 election results
- 1962 election results
- 1964 election results
- 1966 election results
- 1968 election results
- 1970 election results
- 1972 election results
- 1974 election results
- 1976 election results
- 1978 election results
- 1980 election results
- 1982 election results
- 1984 election results
- 1986 election results
- 1988 election results
- 1990 election results
- 1992 election results
- 1994 election results
- 1996 election results
- 1998 election results
- 2000 election results
- 2002 general election results Archived February 3, 2009, at the Wayback Machine
- "2004 Election Results" (PDF). Clerk of the United States House of Representatives. p. 6. Retrieved October 26, 2022.
- 2006 general election results Archived November 27, 2008, at the Wayback Machine
- 2008 general election results Archived November 6, 2008, at the Wayback Machine
- "House Results Map". The New York Times.
- https://elections.cdn.sos.ca.gov/sov/2012-general/06-sov-summary.xls
- https://elections.cdn.sos.ca.gov/sov/2014-general/xls/06-summary.xls
- https://elections.cdn.sos.ca.gov/sov/2016-general/sov/csv-candidates.xls
- "2018 California general election results" (PDF). Retrieved June 16, 2020.
- "2020 California general election results". Retrieved December 8, 2020.