California's 14th congressional district
California's 14th congressional district is a congressional district in the U.S. state of California. Eric Swalwell, a Democrat, has represented the district since January 2023.
| California's 14th congressional district | |||
|---|---|---|---|
Interactive map of district boundaries since 2023 (Used in the 2022 elections) | |||
| Representative |
| ||
| Population (2022) | 733,220 | ||
| Median household income | $135,760[1] | ||
| Ethnicity |
| ||
| Cook PVI | D+22[2] | ||
.svg.png.webp)
As of the 2022 United States House of Representatives elections, the 14th district is in Alameda County and includes the cities of Hayward, Pleasanton, Livermore, Union City, Castro Valley, and parts of Dublin and Fremont.[3] Immediately prior to that, the district included most of San Mateo County and the southwest side of San Francisco.
Recent results from statewide races
| Year | Office | Results |
|---|---|---|
| 1992 | President | Clinton 53.5 – 26.7 |
| Senator | Boxer 59.5 – 32.2 | |
| Senator | Feinstein 65.9 – 29.1% | |
| 1994 | Governor[4] | Brown 49.1 – 46.8 |
| Senator[5] | Feinstein 63.3 – 30.5% | |
| 1996 | President[6] | B. Clinton 57.8 – 30.8% |
| 1998 | Governor[7] | Davis 65.8 – 30.3 |
| Senator[8] | Boxer 60.8 – 36% | |
| 2000 | President[9] | Gore 62.2 – 32.2 |
| Senator[10] | Feinstein 60.8 – 33.2% | |
| 2002 | Governor[11] | Davis 54.9 – 38.3% |
| 2003 | Recall[12][13] | |
| Bustamante 43.1 – 36.4% | ||
| 2004 | President[14] | Kerry 67.6 – 28.6 |
| Senator[15] | Boxer 68.3 – 27.5% | |
| 2006 | Governor[16] | Schwarzenegger 50.9 – 42.7 |
| Senator[17] | Feinstein 72.2 – 22.1% | |
| 2008 | President[18] | Obama 73.1 – 24.9% |
| 2010 | Governor[19] | Brown 63.9 – 32.7 |
| Senator[20] | Boxer 65.5 – 30.3% | |
| 2012 | President | Obama 74.2 – 23.6 |
| Senator | Feinstein 79.3 – 20.7% | |
| 2014 | Governor | Brown 77.5 – 22.5% |
| 2016 | President | H. Clinton 76.9 – 18.2 |
| Senator | Harris 70.9 – 29.1% | |
| 2018 | Governor | Newsom 76.0 – 24.0 |
| Senator | Feinstein 63.5 – 36.5% | |
| 2020 | President | Biden 77.7 – 20.5 |
| 2021 | Recall[21] | |
| 2022 | Governor[22] | Newsom 68.3 - 31.7% |
| Senator | Padilla 69.6 - 30.4% |
Composition
| # | County | Seat | Population |
|---|---|---|---|
| 1 | Alameda | Oakland | 1,648,556 |
Due to the 2020 redistricting, California's 14th congressional district has been shifted geographically to the East Bay. It encompasses most of Alameda County, except for the Oakland Area and the Tri-City Area, which are taken in by the 12th district and 17th district respectively. This district and the 12th are partitioned by Grant Ave, Union Pacific, Lewelling Blvd, Wicks Blvd, Manor Blvd, Juniper St, Dayton Ave, Padre Ave, Fargo Ave, Edgemoor St, Trojan Ave, Beatty St, Fleming St, Highway 880, Floresta Blvd, Halcyon Dr, Hesperian Blvd, Thornally Dr, Highway 185, 150th Ave, Highway 580, Benedict Dr, San Leandro Creek, and Lake Chabot Regional Park.This district and the 17th are partitioned by Mission Peak Regional Park, Witherly Ln, Mission Blvd, Washington Blvd, Farallon Cmn, Paseo Padre Parkway, Grimmer Blvd, Blacow Rd, Omar St, Butano Park Dr, Farina Ln, Nimitz Freeway, Highway 84. The 14th district takes in the north side of the city of Fremont, cities of Hayward, Livermore, Pleasanton, Union City, and Dublin, as well as the census-designated places Ashland, San Lorenzo, Cherryland, Fairview, and Castro Valley.
Cities & CDP with 10,000 or more people
- Hayward - 162,954
- Livermore - 87,955
- Pleasanton - 79,871
- Dublin - 72,589
- Union City - 70,143
- Castro Valley - 66,441
- San Lorenzo - 29,581
- Ashland - 23,823
- Cherryland - 15,808
- Fairview - 11,341
List of members representing the district
| Member | Party | Dates | Cong ress(es) |
Electoral history | Counties |
|---|---|---|---|---|---|
| District created March 4, 1933 | |||||
 Thomas F. Ford (Los Angeles) |
Democratic | March 4, 1933 – January 3, 1945 |
73rd 74th 75th 76th 77th 78th |
Elected in 1932. Re-elected in 1934. Re-elected in 1936. Re-elected in 1938. Re-elected in 1940. Re-elected in 1942. Retired. |
1933–1953 Los Angeles |
 Helen Gahagan Douglas (Los Angeles) |
Democratic | January 3, 1945 – January 3, 1951 |
79th 80th 81st |
Elected in 1944. Re-elected in 1946. Re-elected in 1948. Retired to run for U.S. Senator. | |
 Sam Yorty (Los Angeles) |
Democratic | January 3, 1951 – January 3, 1953 |
82nd | Elected in 1950. Redistricted to the 26th district. | |
 Harlan Hagen (Hanford) |
Democratic | January 3, 1953 – January 3, 1963 |
83rd 84th 85th 86th 87th |
Elected in 1952. Re-elected in 1954. Re-elected in 1956. Re-elected in 1958. Re-elected in 1960. Redistricted to the 18th district. |
1953–1963 Kern, Kings, Tulare |
 John F. Baldwin Jr. (Martinez) |
Republican | January 3, 1963 – March 9, 1966 |
88th 89th |
Redistricted from the 6th district and re-elected in 1962. Re-elected in 1964. Died. |
1963–1975 Contra Costa |
| Vacant | March 9, 1966 – June 7, 1966 |
89th | |||
 Jerome Waldie (Antioch) |
Democratic | June 7, 1966 – January 3, 1975 |
89th 90th 91st 92nd 93rd |
Elected to finish Baldwin's term. Re-elected in 1966. Re-elected in 1968. Re-elected in 1970. Re-elected in 1972. Retired to run for Governor of California. | |
 John J. McFall (Manteca) |
Democratic | January 3, 1975 – December 31, 1978 |
94th 95th |
Redistricted from the 15th district and re-elected in 1974. Re-elected in 1976. Lost re-election and resigned. |
1975–1983 Alameda, Amador, Calaveras, El Dorado, Mono, San Joaquin, Stanislaus, Tuolumne |
| Vacant | December 31, 1978 – January 3, 1979 |
95th | |||
 Norman D. Shumway (Stockton) |
Republican | January 3, 1979 – January 3, 1991 |
96th 97th 98th 99th 100th 101st |
Elected in 1978. Re-elected in 1980. Re-elected in 1982. Re-elected in 1984. Re-elected in 1986. Re-elected in 1988. Retired. | |
| 1983–1993 Alpine, Amador, El Dorado, Lassen, Modoc, Nevada, Placer, Plumas, San Joaquin, Sierra | |||||
 John Doolittle (Rocklin) |
Republican | January 3, 1991 – January 3, 1993 |
102nd | Elected in 1990. Redistricted to the 4th district. | |
 Anna Eshoo (Atherton) |
Democratic | January 3, 1993 – January 3, 2013 |
103rd 104th 105th 106th 107th 108th 109th 110th 111th 112th |
Elected in 1992. Re-elected in 1994. Re-elected in 1996. Re-elected in 1998. Re-elected in 2000. Re-elected in 2002. Re-elected in 2004. Re-elected in 2006. Re-elected in 2008. Re-elected in 2010. Redistricted to the 18th district. |
1993–2003 San Mateo, northwestern Santa Clara |
2003–2013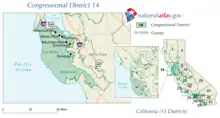 Southern San Mateo, northwestern Santa Clara, Santa Cruz | |||||
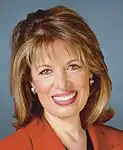 Jackie Speier (Hillsborough) |
Democratic | January 3, 2013 – January 3, 2023 |
113th 114th 115th 116th 117th |
Redistricted from the 12th district and re-elected in 2012. Re-elected in 2014. Re-elected in 2016. Re-elected in 2018. Re-elected in 2020. Redistricted to the 15th district and retired. |
2013–2023.tif.png.webp) San Mateo, southwestern San Francisco |
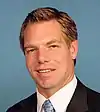 Eric Swalwell (Livermore) |
Democratic | January 3, 2023 – present |
118th | Redistricted from the 15th district and re-elected in 2022. | 2023–present_(new_version).svg.png.webp) Part of Alameda |
Election results
|
1932 • 1934 • 1936 • 1938 • 1940 • 1942 • 1944 • 1946 • 1948 • 1950 • 1952 • 1954 • 1956 • 1958 • 1960 • 1962 • 1964 • 1966 (Special) • 1966 • 1968 • 1970 • 1972 • 1974 • 1976 • 1978 • 1980 • 1982 • 1984 • 1986 • 1988 • 1990 • 1992 • 1994 • 1996 • 1998 • 2000 • 2002 • 2004 • 2006 • 2008 • 2010 • 2012 • 2014 • 2016 • 2018 • 2020 • 2022 |
1932
| Party | Candidate | Votes | % | ||
|---|---|---|---|---|---|
| Democratic | Thomas F. Ford | 47,368 | 57.1 | ||
| Republican | William D. Campbell | 35,598 | 42.9 | ||
| Total votes | 82,966 | 100.0 | |||
| Turnout | {{{votes}}} | ||||
| Democratic win (new seat) | |||||
1934
| Party | Candidate | Votes | % | |
|---|---|---|---|---|
| Democratic | Thomas F. Ford (Incumbent) | 52,761 | 61.0 | |
| Republican | William D. Campbell | 33,945 | 37.1 | |
| Progressive | Lyndon R. Foster | 2,487 | 2.7 | |
| Socialist | Harry Sherr | 1,130 | 1.2 | |
| Communist | Lawrence Ross | 1,086 | 1.2 | |
| Total votes | 91,409 | 100.0 | ||
| Turnout | {{{votes}}} | |||
| Democratic hold | ||||
1936
| Party | Candidate | Votes | % | |
|---|---|---|---|---|
| Democratic | Thomas F. Ford (Incumbent) | 63,365 | 61.0 | |
| Republican | William D. Campbell | 25,497 | 24.6 | |
| Progressive | Albert L. Johnson | 12,874 | 12.4 | |
| Communist | Harold J. Ashe | 1,329 | 1.3 | |
| Socialist | Glen Trimble | 770 | 0.7 | |
| Total votes | 103,855 | 100.0 | ||
| Turnout | {{{votes}}} | |||
| Democratic hold | ||||
1938
| Party | Candidate | Votes | % | |
|---|---|---|---|---|
| Democratic | Thomas F. Ford (Incumbent) | 67,588 | 68.3 | |
| Republican | William D. Campbell | 31,375 | 31.7 | |
| Total votes | 98,963 | 100.0 | ||
| Turnout | {{{votes}}} | |||
| Democratic hold | ||||
1940
| Party | Candidate | Votes | % | |
|---|---|---|---|---|
| Democratic | Thomas F. Ford (Incumbent) | 73,137 | 64.3 | |
| Republican | Herbert L. Herberts | 37,939 | 33.3 | |
| Communist | Pettis Perry | 2,732 | 2.4 | |
| Total votes | 113,808 | 100.0 | ||
| Turnout | {{{votes}}} | |||
| Democratic hold | ||||
1942
| Party | Candidate | Votes | % | |
|---|---|---|---|---|
| Democratic | Thomas F. Ford (Incumbent) | 49,326 | 67 | |
| Republican | Herbert L. Herberts | 24,349 | 33 | |
| Total votes | 73,675 | 100 | ||
| Turnout | {{{votes}}} | |||
| Democratic hold | ||||
1944
| Party | Candidate | Votes | % | |
|---|---|---|---|---|
| Democratic | Helen Gahagan Douglas | 65,729 | 51.6 | |
| Republican | William D. Campbell | 61,767 | 48.4 | |
| Total votes | 127,496 | 100.0 | ||
| Turnout | {{{votes}}} | |||
| Democratic hold | ||||
1946
| Party | Candidate | Votes | % | |
|---|---|---|---|---|
| Democratic | Helen Gahagan Douglas (Incumbent) | 53,536 | 54.4 | |
| Republican | Frederick M. Roberts | 44,914 | 45.6 | |
| Total votes | 98,450 | 100.0 | ||
| Turnout | {{{votes}}} | |||
| Democratic hold | ||||
1948
| Party | Candidate | Votes | % | |
|---|---|---|---|---|
| Democratic | Helen Gahagan Douglas (Incumbent) | 89,581 | 65.3 | |
| Republican | W. Wallace Braden | 44,611 | 32.5 | |
| Progressive | Sidney Moore | 2,904 | 2.2 | |
| Total votes | 137,096 | 100.0 | ||
| Turnout | {{{votes}}} | |||
| Democratic hold | ||||
1950
| Party | Candidate | Votes | % | |
|---|---|---|---|---|
| Democratic | Sam Yorty | 47,653 | 49.4 | |
| Republican | Jack W. Hardy | 35,543 | 36.8 | |
| Progressive | Charlotta A. Bass | 13,364 | 13.8 | |
| Total votes | 96,560 | 100.0 | ||
| Turnout | {{{votes}}} | |||
| Democratic hold | ||||
1952
| Party | Candidate | Votes | % | |||
|---|---|---|---|---|---|---|
| Democratic | Harlan Hagen | 70,809 | 51 | |||
| Republican | Thomas H. Werdel (Incumbent) | 68,011 | 49 | |||
| Total votes | 138,820 | 100 | ||||
| Turnout | {{{votes}}} | |||||
| Democratic gain from Republican | ||||||
1954
| Party | Candidate | Votes | % | |
|---|---|---|---|---|
| Democratic | Harlan Hagen | 75,194 | 65 | |
| Republican | Al Blain | 40,270 | 35 | |
| Total votes | 115,464 | 100 | ||
| Turnout | {{{votes}}} | |||
| Democratic hold | ||||
1956
| Party | Candidate | Votes | % | |
|---|---|---|---|---|
| Democratic | Harlan Hagen (Incumbent) | 94,461 | 63 | |
| Republican | Myron F. Tisdel | 55,509 | 37 | |
| Total votes | 149,970 | 100 | ||
| Turnout | {{{votes}}} | |||
| Democratic hold | ||||
1958
| Party | Candidate | Votes | % | |
|---|---|---|---|---|
| Democratic | Harlan Hagen (Incumbent) | 120,347 | 100.0 | |
| Turnout | {{{votes}}} | |||
| Democratic hold | ||||
1960
| Party | Candidate | Votes | % | |
|---|---|---|---|---|
| Democratic | Harlan Hagen (Incumbent) | 97,026 | 56.5 | |
| Republican | G. Ray Arnett | 74,800 | 43.5 | |
| Total votes | 171,826 | 100.0 | ||
| Turnout | {{{votes}}} | |||
| Democratic hold | ||||
1962
| Party | Candidate | Votes | % | |
|---|---|---|---|---|
| Republican | John F. Baldwin Jr. (Incumbent) | 99,040 | 62.9 | |
| Democratic | Charles R. Weidner | 58,469 | 37.1 | |
| Total votes | 157,509 | 100.0 | ||
| Turnout | ||||
| Republican hold | ||||
1964
| Party | Candidate | Votes | % | |
|---|---|---|---|---|
| Republican | John F. Baldwin Jr. (Incumbent) | 117,272 | 64.9 | |
| Democratic | Russell M. Koch | 63,469 | 35.1 | |
| Total votes | 180,741 | 100.0 | ||
| Turnout | {{{votes}}} | |||
| Republican hold | ||||
1966 (Special)
| Party | Candidate | Votes | % | |||
|---|---|---|---|---|---|---|
| Democratic | Jerome R. Waldie | 53.7 | ||||
| Republican | Frank J. Newman | 31.2 | ||||
| Republican | John A. Richardson | 10.5 | ||||
| Democratic | Leo Antonio Costa | 4.3 | ||||
| Republican | Dooris G. "Duke" Johnston | 1.6 | ||||
| Republican | Tallak B. Wralstad | 1.2 | ||||
| Total votes | 100.0 | |||||
| Turnout | {{{votes}}} | |||||
| Democratic gain from Republican | ||||||
1966
| Party | Candidate | Votes | % | |
|---|---|---|---|---|
| Democratic | Jerome R. Waldie (Incumbent) | 108,668 | 56.4 | |
| Republican | Frank J. Newman | 83,878 | 43.6 | |
| Total votes | 192,546 | 100.0 | ||
| Turnout | {{{votes}}} | |||
| Democratic hold | ||||
1968
| Party | Candidate | Votes | % | |
|---|---|---|---|---|
| Democratic | Jerome R. Waldie (Incumbent) | 152,500 | 71.6 | |
| Republican | David W. Schuh | 56,598 | 26.6 | |
| American Independent | Luis W. Hamilton | 3,945 | 1.9 | |
| Total votes | 213,043 | 100.0 | ||
| Turnout | {{{votes}}} | |||
| Democratic hold | ||||
1970
| Party | Candidate | Votes | % | |
|---|---|---|---|---|
| Democratic | Jerome R. Waldie (Incumbent) | 148,655 | 74.5 | |
| Republican | Byron D. Athan | 50,750 | 25.5 | |
| Total votes | 199,405 | 100.0 | ||
| Turnout | {{{votes}}} | |||
| Democratic hold | ||||
1972
| Party | Candidate | Votes | % | |
|---|---|---|---|---|
| Democratic | Jerome R. Waldie (Incumbent) | 158,948 | 77.6 | |
| Republican | Floyd E. Sims | 45,985 | 22.4 | |
| Total votes | 204,933 | 100.0 | ||
| Turnout | {{{votes}}} | |||
| Democratic hold | ||||
1974
| Party | Candidate | Votes | % | |
|---|---|---|---|---|
| Democratic | John J. McFall (Incumbent) | 101,932 | 70.9 | |
| Republican | Charles M. "Chuck" Gibson | 34,679 | 24.1 | |
| American Independent | Roger A. Blaine | 7,367 | 4.9 | |
| Total votes | 143,978 | 100.0 | ||
| Turnout | {{{votes}}} | |||
| Democratic hold | ||||
1976
| Party | Candidate | Votes | % | |
|---|---|---|---|---|
| Democratic | John J. McFall (Incumbent) | 123,285 | 72.5 | |
| Republican | Roger A. Blaine | 46,674 | 27.5 | |
| Total votes | 169,959 | 100.0 | ||
| Turnout | {{{votes}}} | |||
| Democratic hold | ||||
1978
| Party | Candidate | Votes | % | |||
|---|---|---|---|---|---|---|
| Republican | Norman D. Shumway (Incumbent) | 95,962 | 53.4 | |||
| Democratic | John J. McFall (Incumbent) | 76,602 | 42.6 | |||
| American Independent | George Darold Waldron | 7,163 | 4.0 | |||
| Total votes | 179,727 | 100.0 | ||||
| Turnout | {{{votes}}} | |||||
| Republican gain from Democratic | ||||||
1980
| Party | Candidate | Votes | % | |
|---|---|---|---|---|
| Republican | Norman D. Shumway (Incumbent) | 133,979 | 60.7 | |
| Democratic | Ann Cerney | 79,883 | 36.2 | |
| Libertarian | Douglas G. Housley | 6,717 | 3.0 | |
| Total votes | 220,579 | 100.0 | ||
| Turnout | {{{votes}}} | |||
| Republican hold | ||||
1982
| Party | Candidate | Votes | % | |
|---|---|---|---|---|
| Republican | Norman D. Shumway (Incumbent) | 134,225 | 63.4 | |
| Democratic | Baron Reed | 77,400 | 36.6 | |
| Total votes | 211,625 | 100.0 | ||
| Turnout | {{{votes}}} | |||
| Republican hold | ||||
1984
| Party | Candidate | Votes | % | |
|---|---|---|---|---|
| Republican | Norman D. Shumway (Incumbent) | 179,238 | 73.3 | |
| Democratic | Ruth Paula Carlson | 58,384 | 23.9 | |
| Libertarian | Fred W. Colburn | 6,850 | 2.8 | |
| Total votes | 244,472 | 100.0 | ||
| Turnout | {{{votes}}} | |||
| Republican hold | ||||
1986
| Party | Candidate | Votes | % | |
|---|---|---|---|---|
| Republican | Norman D. Shumway (Incumbent) | 146,906 | 71.6 | |
| Democratic | Bill Steele | 53,597 | 26.1 | |
| Libertarian | Bruce A. Daniel | 4,658 | 2.3 | |
| Total votes | 205,161 | 100.0 | ||
| Turnout | {{{votes}}} | |||
| Republican hold | ||||
1988
| Party | Candidate | Votes | % | |
|---|---|---|---|---|
| Republican | Norman D. Shumway (Incumbent) | 173,876 | 62.6 | |
| Democratic | Patricia Malberg | 103,899 | 37.4 | |
| Total votes | 277,775 | 100.0 | ||
| Turnout | {{{votes}}} | |||
| Republican hold | ||||
1990
| Party | Candidate | Votes | % | |
|---|---|---|---|---|
| Republican | John Doolittle | 128,309 | 51.5 | |
| Democratic | Patricia Malberg | 120,742 | 48.5 | |
| Total votes | 249,051 | 100.0 | ||
| Turnout | {{{votes}}} | |||
| Republican hold | ||||
1992
| Party | Candidate | Votes | % | |||
|---|---|---|---|---|---|---|
| Democratic | Anna Eshoo | 146,873 | 56.7 | |||
| Republican | Tom Huening | 101,202 | 39.0 | |||
| Libertarian | Chuck Olson | 7,220 | 2.8 | |||
| Peace and Freedom | David Wald | 3,912 | 1.5 | |||
| No party | Sims (write-in) | 12 | 0.0 | |||
| No party | Maginnis (write-in) | 3 | 0.0 | |||
| Total votes | 259,232 | 100.0 | ||||
| Turnout | {{{votes}}} | |||||
| Democratic gain from Republican | ||||||
1994
| Party | Candidate | Votes | % | |
|---|---|---|---|---|
| Democratic | Anna Eshoo (Incumbent) | 130,713 | 60.60 | |
| Republican | Ben Brink | 78,475 | 39.40 | |
| Total votes | 199,188 | 100.0 | ||
| Turnout | {{{votes}}} | |||
| Democratic hold | ||||
1996
| Party | Candidate | Votes | % | |
|---|---|---|---|---|
| Democratic | Anna Eshoo (Incumbent) | 149,313 | 64.9 | |
| Republican | Ben Brink | 71,573 | 31.1 | |
| Peace and Freedom | Timothy Thompson | 3,653 | 1.6 | |
| Libertarian | Joseph Dehn | 3,492 | 1.5 | |
| Natural Law | Robert Wells | 2,144 | 0.9 | |
| Total votes | 230,175 | 100.0 | ||
| Turnout | {{{votes}}} | |||
| Democratic hold | ||||
1998
| Party | Candidate | Votes | % | |
|---|---|---|---|---|
| Democratic | Anna Eshoo (Incumbent) | 129,663 | 68.64 | |
| Republican | Chris Haugen | 53,719 | 28.44 | |
| Libertarian | Joseph W. Dehn III | 3,166 | 1.68 | |
| Natural Law | Anna Currivan | 2,362 | 1.25 | |
| Total votes | 188,910 | 100.0 | ||
| Turnout | {{{votes}}} | |||
| Democratic hold | ||||
2000
| Party | Candidate | Votes | % | |
|---|---|---|---|---|
| Democratic | Anna Eshoo (Incumbent) | 161,720 | 70.3 | |
| Republican | Bill Quraishi | 59,338 | 25.8 | |
| Libertarian | Joseph W. Dehn III | 4,715 | 2.0 | |
| Natural Law | John Black | 4,489 | 1.9 | |
| Total votes | 230,262 | 100.0 | ||
| Turnout | {{{votes}}} | |||
| Democratic hold | ||||
2002
| Party | Candidate | Votes | % | |
|---|---|---|---|---|
| Democratic | Anna Eshoo (Incumbent) | 117,055 | 68.2 | |
| Republican | Joe Nixon | 48,346 | 28.2 | |
| Libertarian | Andrew B. Carver | 6,277 | 3.6 | |
| Total votes | 171,678 | 100.0 | ||
| Turnout | {{{votes}}} | |||
| Democratic hold | ||||
2004
| Party | Candidate | Votes | % | |
|---|---|---|---|---|
| Democratic | Anna Eshoo (Incumbent) | 182,712 | 69.8 | |
| Republican | Chris Haugen | 69,564 | 26.6 | |
| Libertarian | Brian Holtz | 9,588 | 3.6 | |
| No party | Dennis Mitrzyk (write-in) | 24 | 0.0 | |
| Total votes | 262,088 | 100.0 | ||
| Turnout | {{{votes}}} | |||
| Democratic hold | ||||
2006
| Party | Candidate | Votes | % | |
|---|---|---|---|---|
| Democratic | Anna Eshoo (Incumbent) | 141,153 | 71.1 | |
| Republican | Rob Smith | 48,097 | 24.3 | |
| Libertarian | Brian Holtz | 4,692 | 2.3 | |
| Green | Carol Brouillet | 4,633 | 2.3 | |
| Total votes | 198,575 | 100.0 | ||
| Turnout | {{{votes}}} | |||
| Democratic hold | ||||
2008
| Party | Candidate | Votes | % | |
|---|---|---|---|---|
| Democratic | Anna Eshoo (Incumbent) | 141,623 | 70.1 | |
| Republican | Ronny Santana | 44,902 | 22.2 | |
| Libertarian | Brian Holtz | 8,670 | 4.2 | |
| Green | Carol Brouillet | 7,090 | 3.5 | |
| Total votes | 202,285 | 100.0 | ||
| Turnout | {{{votes}}} | |||
| Democratic hold | ||||
2010
| Party | Candidate | Votes | % | |
|---|---|---|---|---|
| Democratic | Anna Eshoo (Incumbent) | 151,217 | 69.1 | |
| Republican | Dave Chapman | 60,917 | 27.8 | |
| Libertarian | Paul Lazaga | 6,735 | 3.1 | |
| Total votes | 218,869 | 100.00 | ||
| Turnout | {{{votes}}} | |||
| Democratic hold | ||||
2012
| Party | Candidate | Votes | % | |
|---|---|---|---|---|
| Democratic | Jackie Speier | 203,828 | 79% | |
| Republican | Deborah (Debbie) Bacigalupi | 54,455 | 21% | |
| Total votes | 258,283 | 100.00% | ||
| Democratic hold | ||||
2014
| Party | Candidate | Votes | % | |
|---|---|---|---|---|
| Democratic | Jackie Speier | 114,389 | 77% | |
| Republican | Robin Chew | 34,757 | 23% | |
| Total votes | 149,146 | 100.00% | ||
| Democratic hold | ||||
2016
| Party | Candidate | Votes | % | |
|---|---|---|---|---|
| Democratic | Jackie Speier | 231,630 | 81% | |
| Republican | Angel Cardenas | 54,817 | 19% | |
| Total votes | 286,447 | 100% | ||
| Democratic hold | ||||
2018
| Party | Candidate | Votes | % | |
|---|---|---|---|---|
| Democratic | Jackie Speier | 211,384 | 79% | |
| Republican | Cristina Osmeña | 55,439 | 20% | |
| Total votes | 266,823 | 100% | ||
| Democratic hold | ||||
2020
| Party | Candidate | Votes | % | |
|---|---|---|---|---|
| Democratic | Jackie Speier (incumbent) | 278,227 | 79.3 | |
| Republican | Ran Petel | 72,684 | 20.7 | |
| Total votes | 350,911 | 100.0 | ||
| Democratic hold | ||||
2022
| Party | Candidate | Votes | % | |
|---|---|---|---|---|
| Democratic | Eric Swalwell (incumbent) | 137,612 | 69.3 | |
| Republican | Alison Hayden | 60,852 | 30.7 | |
| Total votes | 198,464 | 100.0 | ||
| Democratic hold | ||||
Historical district boundaries
.tif.png.webp)
References
- "My Congressional District".
- "2022 Cook PVI: District Map and List". Cook Political Report. Retrieved January 10, 2023.
- "CA 2022 Congressional". Dave's Redistricting. January 4, 2022. Retrieved November 11, 2022.
- Supplement to the Statement of Vote ca.gov
- Supplement to the Statement of Vote ca.gov
- Supplement to the Statement of Vote ca.gov
- "Archived copy" (PDF). www.sos.ca.gov. Archived from the original (PDF) on September 29, 2011. Retrieved January 11, 2022.
{{cite web}}: CS1 maint: archived copy as title (link) - "Archived copy" (PDF). www.sos.ca.gov. Archived from the original (PDF) on September 29, 2011. Retrieved January 11, 2022.
{{cite web}}: CS1 maint: archived copy as title (link) - "Statement of Vote (2000 President)" (PDF). Archived from the original (PDF) on June 11, 2007. Retrieved September 17, 2008.
- "Statement of Vote (2000 Senator)" (PDF). Archived from the original (PDF) on June 11, 2007. Retrieved September 17, 2008.
- Statement of Vote (2002 Governor) Archived November 11, 2010, at the Wayback Machine
- "Statement of Vote (2003 Recall Question)" (PDF). Archived from the original (PDF) on May 20, 2011. Retrieved October 8, 2007.
- "Statement of Vote (2003 Governor)" (PDF). Archived from the original (PDF) on May 20, 2011. Retrieved October 8, 2007.
- "Statement of Vote (2004 President)" (PDF). Archived from the original (PDF) on August 1, 2010. Retrieved August 8, 2007.
- Statement of Vote (2004 Senator) Archived August 10, 2011, at the Wayback Machine
- Statement of Vote (2006 Governor) Archived August 10, 2011, at the Wayback Machine
- Statement of Vote (2006 Senator) Archived August 10, 2011, at the Wayback Machine
- "(2008 President)". Archived from the original on February 12, 2009. Retrieved March 5, 2009.
- "Statement of Vote (2010 Governor)" (PDF). Archived from the original (PDF) on June 1, 2011. Retrieved February 7, 2012.
- "Statement of Vote (2010 Senator)" (PDF). Archived from the original (PDF) on June 1, 2011. Retrieved February 7, 2012.
- "Counties by Congressional District for Recall Question" (PDF). sos.ca.gov. September 14, 2021. Retrieved May 2, 2022.
- "Counties by Congressional Districts for Governor" (PDF). sos.ca.gov. November 8, 2022. Retrieved May 4, 2023.
- 1932 election results
- 1934 election results
- 1936 election results
- 1938 election results
- 1940 election results
- 1942 election results
- 1944 election results
- 1946 election results
- 1948 election results
- 1950 election results
- 1952 election results
- 1954 election results
- 1956 election results
- 1958 election results
- 1960 election results
- 1962 election results
- 1964 election results
- 1966 special election results
- 1966 election results
- 1968 election results
- 1970 election results
- 1972 election results
- 1974 election results
- 1976 election results
- 1978 election results
- 1980 election results
- 1982 election results
- 1984 election results
- 1986 election results
- 1988 election results
- 1990 election results
- 1992 election results
- 1994 election results
- 1996 election results
- 1998 election results
- 2000 election results
- 2002 general election results Archived February 3, 2009, at the Wayback Machine
- 2004 general election results Archived August 21, 2008, at the Wayback Machine
- 2006 general election results Archived November 27, 2008, at the Wayback Machine
- 2008 general election results Archived December 21, 2008, at the Wayback Machine
- 2010 general election results
- 2012 general election results Archived October 19, 2013, at the Wayback Machine
- "2014 general election results". Archived from the original on December 21, 2014. Retrieved December 21, 2014.
External links
- GovTrack.us: California's 14th congressional district
- RAND California Election Returns: District Definitions (out of date)
- California Voter Foundation map - CD14 (out of date)