California's 18th congressional district
California's 18th congressional district is a congressional district located in the U.S. state of California. The district is currently represented by Democrat Zoe Lofgren. Since the 2022 election, the district is landlocked and includes all of San Benito County and parts of Santa Clara and Monterey counties, including Salinas, Hollister, Watsonville, Gilroy, Soledad, and downtown and eastern San Jose.[3]
| California's 18th congressional district | |||
|---|---|---|---|
Interactive map of district boundaries since 2023 (Used in the 2022 elections) | |||
| Representative |
| ||
| Population (2022) | 734,686 | ||
| Median household income | $96,509[1] | ||
| Ethnicity |
| ||
| Cook PVI | D+21[2] | ||
.svg.png.webp)
Due to the presence of Silicon Valley, the district had a median household income of $149,375, the second highest of any congressional district in the country.[1][4] After redistricting, the district picked up agricultural areas of Monterey County, and its median household income dropped substantially, to $90,456.
History
2020 redistricting
Following the 2020 census and the subsequent 2020 United States redistricting cycle, California lost a congressional district, leading to significant changes across California's districts. Most of the area previously part of the 18th district was split into the new 16th district and 19th district. The 18th district was moved to cover the Salinas Valley in Monterey County and the downtown and east side of San Jose. With the changes, the 18th became a Latino majority district.[5]
2010 redistricting
Following the 2010 census and the subsequent 2010 United States redistricting cycle, California's 18th congressional district was redrawn by the California Citizens Redistricting Commission. Cities and CDPs in the district include Palo Alto, Stanford, Los Altos, Woodside, Mountain View, Los Altos Hills, Campbell, Saratoga, Los Gatos, and Scotts Valley; most of Menlo Park and Redwood City; and part of San Jose.
2000 redistricting
Following the 2000 census and the subsequent 2000 United States redistricting cycle, California's congressional districts were redrawn by the California State Legislature. From 2003 to 2013, the district was located in the San Joaquin Valley. It included Merced County and portions of San Joaquin, Stanislaus, Madera, and Fresno counties. Cities in the district included Modesto, most of Stockton, Ceres, Atwater, Merced, and Los Banos.
Recent election results from statewide races
| Year | Office | Results |
|---|---|---|
| 2012 | President[6] | Obama 68.2 – 28.9% |
| Senator[7] | Feinstein 71.6 – 28.4% | |
| 2014 | Governor[8] | Brown 71.6 – 28.4% |
| 2016 | President[9] | Clinton 73.4 – 20.2% |
| Senator[10] | Harris 73.8 – 26.2% | |
| 2018 | Governor[11] | Newsom 72.5 – 27.5% |
| Senator[12] | Feinstein 60.9 – 39.1% | |
| 2020 | President[13] | Biden 76.2 – 21.5% |
| 2021 | Recall[14] | |
| 2022 | Governor[15] | Newsom 65.2 - 34.8% |
| Senator | Padilla 68.0 - 32.0% |
Election results from statewide races before 2012
| Year | Office | Results |
|---|---|---|
| 1992 | President | Clinton 40.9 – 37.3% |
| Senator | Herschensohn 46.6 – 43.1% | |
| Senator | Feinstein 49.0 – 42.6% | |
| 1994 | Governor | [data missing] |
| Senator | [data missing] | |
| 1996 | President | [data missing] |
| 1998 | Governor | [data missing] |
| Senator | [data missing] | |
| 2000 | President[16] | Bush 52.6 – 43.9% |
| Senator[17] | Feinstein 49.0 – 43.6% | |
| 2002 | Governor[18] | Davis 50.5 – 40.2% |
| 2003 | Recall[19][20] | |
| Schwarzenegger 44.1 – 33.4% | ||
| 2004 | President[21] | Bush 49.6 – 49.3% |
| Senator[22] | Boxer 56.5 – 39.2% | |
| 2006 | Governor[23] | Schwarzenegger 55.7 – 39.7% |
| Senator[24] | Feinstein 58.6 – 36.2% | |
| 2008 | President[25] | Obama 59.2 – 38.3% |
| 2010 | Governor[26] | Brown 52.3 – 40.9% |
| Senator[27] | Boxer 47.9 – 44.5% |
Composition
| # | County | Seat | Population |
|---|---|---|---|
| 81 | San Mateo | Redwood City | 737,888 |
| 85 | Santa Clara | San Jose | 1,885,508 |
| 87 | Santa Cruz | Santa Cruz | 267,792 |
As of the 2020 redistricting, California's 18th congressional district was shifted geographically to cover the Salinas Valley. It encompasses San Benito, the southernmost point of Santa Cruz County, and the interiors of Santa Clara and Monterey Counties.
Santa Cruz County is split between this district and the 19th district. They are partitioned by Pajaro River, Highway 129, W Beach St, Lee Rd, Highway 1, Harkins Slough Rd, Harkins Slough, Old Adobe Rd, Corralitos Creek, Varin Rd, Pioneer Rd, Green Valley Rd, Casserly Rd, Mt Madonna Rd. The 18th district takes in the city of Watsonville.
Santa Clara County is split between this district, the 19th district, the 16th district, and the 17th district. The 18th, 16th, and 19th are partitioned by Bella Vista Ln, Bodfish Creek, Burchell Rd, Bluebell Dr, Day Rd, Highway G8, W San Martin Ave, Santa Teresa Blvd, Sunnyside Ave, Morgan Hill City Limits, Hale Ave, Tilton Ave, Monterey Rd, Highway 101, Coyote Rd, Anderson Lake, Las Animas Rd, Metcalf Rd, Yerba Buena Creek, Old Yerba Buena Rd, Aborn Rd, Quincy Rd, Norwood Ave, Murillo Ave, Pleasant Acres Dr, Westview Dr, Pleasant Knoll Dr, Guluzzo Dr, Flint Ave, Marten Ave, Coldwater Dr, Ocala Ave, Wonderama Dr, Cunningham Ave, Swift Ave, Highway 101, Story Rd, Monterey Rd, Highway 87, Highway 280, Highway 880. The 18th and 17th are partitioned by Steven's Creek Blvd, Di Salvo Ave, Bellerose Dr, Forest Ave, Wabash Ave, W San Carlos St, Race St, The Alameda, University Ave, Elm St, Highway 82, Newhall St, Morse St, Idaho St, Alameda Ct, Sherwood Ave, Hamline St, Highway 880, Highway 101, McKee Rd, Toyon Ave, Penitencia Creek Rd, Canon Vista Ave, Crothers Rd, Alum Rock Park, Sierra Rd, Felter Rd, Weller Rd. The 18th district takes in the center of the city of San Jose and the San Jose district of Alum Rock. It also takes in the cities of Morgan Hill and Gilroy.
Monterey County is split between this district and the 19th district. They are partitioned by Union Pacific, Highway G12, Elkhorn Rd, Echo Valley Rd, Maher Rd, Maher Ct, La Encina Dr, Crazy Horse Canyon Rd, San Juan Grade Rd, Highway 101, Espinosa Rd, Castroville Blvd, Highway 156, Highway 1, Tembladero Slough, Highway 183, Cooper Rd, Blanco Rd, Salinas River, Davis Rd, Hitchcock Rd, Highway 68, E Blanco Rd, Nutting St, Abbott St, Highway G17, Limekiln Creek, Likekiln Rd, Rana Creek, Tularcitos Creek, Highway G16, Tassajara Rd, Camp Creek, Lost Valley Creek, Lost Valley Conn, N Coast Rdg, 2 Central Coa, Cone Peak Rd, Nacimiento Fergusson Rd, Los Bueyes Creek, and the Monterey County Southern border. The 18th district takes in the cities of Salinas, Soledad, Greenfield, King City, and the north side of the census-designated place Prunedale.
Cities & CDP with 10,000 or more people
- San Jose - 1,013,240
- Salinas - 163,542
- Gilroy - 56,766
- Watsonville - 52,590
- Morgan Hill - 44,686
- Hollister - 41,678
- Soledad - 25,999
- Prunedale - 20,560
- Greenfield - 17,516
- King City - 14,077
List of members representing the district
| Member | Party | Dates | Cong ress(es) |
Electoral history | Counties |
|---|---|---|---|---|---|
| District created March 4, 1933 | |||||
 John H. Burke (Long Beach) |
Democratic | March 4, 1933 – January 3, 1935 |
73rd | Elected in 1932. Retired. |
1933–1963 Los Angeles County |
 Byron N. Scott (Long Beach) |
Democratic | January 3, 1935 – January 3, 1939 |
74th 75th |
Elected in 1934. Re-elected in 1936. Lost re-election. | |
.jpg.webp) Thomas M. Eaton (Long Beach) |
Republican | January 3, 1939 – September 16, 1939 |
76th | Elected in 1938. Died. | |
| Vacant | September 16, 1939 – January 3, 1941 | ||||
 William Ward Johnson (Long Beach) |
Republican | January 3, 1941 – January 3, 1945 |
77th 78th |
Elected in 1940. Re-elected in 1942. Lost re-election. | |
 Clyde Doyle (Long Beach) |
Democratic | January 3, 1945 – January 3, 1947 |
79th | Elected in 1944. Lost re-election. | |
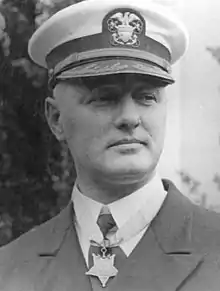 Willis W. Bradley (Long Beach) |
Republican | January 3, 1947 – January 3, 1949 |
80th | Elected in 1946. Lost re-election. | |
Clyde Doyle (Long Beach) |
Democratic | January 3, 1949 – January 3, 1953 |
81st 82nd |
Elected in 1948. Re-elected in 1950. Redistricted to the 23rd district. | |
 Craig Hosmer (Long Beach) |
Republican | January 3, 1953 – January 3, 1963 |
83rd 84th 85th 86th 87th |
Elected in 1952. Re-elected in 1954. Re-elected in 1956. Re-elected in 1958. Re-elected in 1960. Redistricted to the 32nd district. | |
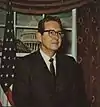
 Harlan Hagen (Hanford) |
Democratic | January 3, 1963 – January 3, 1967 |
88th 89th |
Redistricted from the 14th district and re-elected in 1962. Re-elected in 1964. Lost re-election. |
1963–1967 Kern County, Kings County, Tulare County |
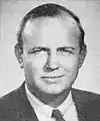
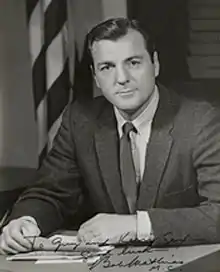 Bob Mathias (Tulare) |
Republican | January 3, 1967 – January 3, 1975 |
90th 91st 92nd 93rd |
Elected in 1966. Re-elected in 1968. Re-elected in 1970. Re-elected in 1972. Redistricted to the 17th district and lost re-election. |
1967–1973 Kern County, Tulare County |
| 1973–1975 Amador County, Calaveras County, Inyo County, Kern County (sliver in north), Madera County, Mariposa County, Mono County, Tulare County, Tuolumne County | |||||
 William M. Ketchum (Bakersfield) |
Republican | January 3, 1975 – June 24, 1978 |
94th 95th |
Redistricted from the 36th district and re-elected in 1974. Re-elected in 1976. Died. |
Inyo County, Kern County, northern Los Angeles County, Tulare County |
| Vacant | June 24, 1978 – January 3, 1979 |
95th | |||
 Bill Thomas (Bakersfield) |
Republican | January 3, 1979 – January 3, 1983 |
96th 97th |
Elected in 1978. Re-elected in 1980. Redistricted to the 20th district. | |
 Richard Lehman (Fresno) |
Democratic | January 3, 1983 – January 3, 1993 |
98th 99th 100th 101st 102nd |
Elected in 1982. Re-elected in 1984. Re-elected in 1986. Re-elected in 1988. Re-elected in 1990. Redistricted to the 19th district. |
1983–1993 Calaveras County, Fresno County (Fresno city), Madera County, Mono County, eastern San Joaquin County, Tuolumne County |
 Gary Condit (Ceres) |
Democratic | January 3, 1993 – January 3, 2003 |
103rd 104th 105th 106th 107th |
Redistricted from the 15th district and re-elected in 1992. Re-elected in 1994. Re-elected in 1996. Re-elected in 1998. Re-elected in 2000. Lost renomination. |
1993–2003 Northwestern Fresno County, western Madera County, Merced County, southwestern San Joaquin County, Stanislaus County |
 Dennis Cardoza (Atwater) |
Democratic | January 3, 2003 – August 14, 2012 |
108th 109th 110th 111th 112th |
Elected in 2002. Re-elected in 2004. Re-elected in 2006. Re-elected in 2008. Re-elected in 2010. Resigned to become a lobbyist. |
2003–2013 Small part of western Fresno County, Merced County, San Joaquin County (Stockton), western Stanislaus County |
| Vacant | August 14, 2012 – January 3, 2013 |
112th | Redistricted to the 10th district | ||
 Anna Eshoo (Atherton) |
Democratic | January 3, 2013 – January 3, 2023 |
113th 114th 115th 116th 117th |
Redistricted from the 14th district and re-elected in 2012. Re-elected in 2014. Re-elected in 2016. Re-elected in 2018. Re-elected in 2020. Redistricted to the 16th district. |
2013–2023.tif.png.webp) Portions of San Mateo, Santa Clara, and Santa Cruz |
 Zoe Lofgren (San Jose) |
Democratic | January 3, 2023 – present |
118th | Redistricted from the 19th district and re-elected in 2022. | 2023–present_(new_version).svg.png.webp) Much of Santa Clara County, including most of the city of San Jose |
Election results
|
1932 • 1934 • 1936 • 1938 • 1940 • 1942 • 1944 • 1946 • 1948 • 1950 • 1952 • 1954 • 1956 • 1958 • 1960 • 1962 • 1964 • 1966 • 1968 • 1970 • 1972 • 1974 • 1976 • 1978 • 1980 • 1982 • 1984 • 1986 • 1988 • 1990 • 1992 • 1994 • 1996 • 1998 • 2000 • 2002 • 2004 • 2006 • 2008 • 2010 • 2012 • 2014 • 2016 • 2018 • 2020 • 2022 |
1932
| Party | Candidate | Votes | % | ||
|---|---|---|---|---|---|
| Democratic | John H. Burke | 48,179 | 53.3 | ||
| Republican | Robert Henderson | 33,817 | 37.4 | ||
| Independent | William E. Hinshaw | 8,399 | 9.3 | ||
| Total votes | 90,395 | 100.0 | |||
| Turnout | {{{votes}}} | ||||
| Democratic win (new seat) | |||||
1934
| Party | Candidate | Votes | % | |
|---|---|---|---|---|
| Democratic | Byron N. Scott | 52,377 | 56.3 | |
| Republican | William Brayton | 40,179 | 43.2 | |
| Communist | Clyde Champion | 507 | 0.5 | |
| Total votes | 93,063 | 100.0 | ||
| Turnout | {{{votes}}} | |||
| Democratic hold | ||||
1936
| Party | Candidate | Votes | % | |
|---|---|---|---|---|
| Democratic | Byron N. Scott (incumbent) | 61,415 | 59 | |
| Republican | James F. Collins | 42,748 | 41 | |
| Total votes | 134,163 | 100 | ||
| Turnout | {{{votes}}} | |||
| Democratic hold | ||||
1938
| Party | Candidate | Votes | % | |||
|---|---|---|---|---|---|---|
| Republican | Thomas M. Eaton | 52,216 | 48.6 | |||
| Democratic | Byron N. Scott (incumbent) | 51,874 | 48.3 | |||
| Progressive | Solomon Carr | 3,384 | 3.1 | |||
| Total votes | 107,474 | 100.0 | ||||
| Turnout | {{{votes}}} | |||||
| Republican gain from Democratic | ||||||
1940
| Party | Candidate | Votes | % | |
|---|---|---|---|---|
| Republican | William Ward Johnson (inc.) | 73,932 | 54.4 | |
| Democratic | Byron N. Scott | 60,764 | 44.7 | |
| Communist | George R. Ashby | 1,355 | 0.9 | |
| Total votes | 136,051 | 100.0 | ||
| Turnout | {{{votes}}} | |||
| Republican hold | ||||
1942
| Party | Candidate | Votes | % | |
|---|---|---|---|---|
| Republican | William Ward Johnson (inc.) | 53,136 | 56.8 | |
| Democratic | Francis H. Gentry | 40,339 | 43.2 | |
| Total votes | 93,475 | 100.0 | ||
| Turnout | {{{votes}}} | |||
| Republican hold | ||||
1944
| Party | Candidate | Votes | % | |||
|---|---|---|---|---|---|---|
| Democratic | Clyde Doyle | 95,090 | 55.7 | |||
| Republican | William Ward Johnson (inc.) | 75,749 | 44.3 | |||
| Total votes | 170,839 | 100.0 | ||||
| Turnout | {{{votes}}} | |||||
| Democratic gain from Republican | ||||||
1946
| Party | Candidate | Votes | % | |||
|---|---|---|---|---|---|---|
| Republican | Willis W. Bradley | 67,363 | 52.8 | |||
| Democratic | Clyde Doyle (incumbent) | 60,218 | 47.2 | |||
| Total votes | 127,581 | 100.0 | ||||
| Turnout | {{{votes}}} | |||||
| Republican gain from Democratic | ||||||
1948
| Party | Candidate | Votes | % | |||
|---|---|---|---|---|---|---|
| Democratic | Clyde Doyle | 105,687 | 51.1 | |||
| Republican | Willis W. Bradley (incumbent) | 92,721 | 44.9 | |||
| Progressive | Stanley Moffatt | 8,232 | 4.0 | |||
| Total votes | 206,640 | 100.0 | ||||
| Turnout | {{{votes}}} | |||||
| Democratic gain from Republican | ||||||
1950
| Party | Candidate | Votes | % | |
|---|---|---|---|---|
| Democratic | Clyde Doyle (incumbent) | 97,177 | 50.5 | |
| Republican | Craig Hosmer | 95,308 | 49.5 | |
| Total votes | 192,485 | 100.0 | ||
| Turnout | {{{votes}}} | |||
| Democratic hold | ||||
1952
| Party | Candidate | Votes | % | ||
|---|---|---|---|---|---|
| Republican | Craig Hosmer | 90,438 | 55.5 | ||
| Democratic | Joseph M. Kennick | 72,457 | 44.5 | ||
| Total votes | 162,895 | 100.0 | |||
| Turnout | {{{votes}}} | ||||
| Republican win (new seat) | |||||
1954
| Party | Candidate | Votes | % | |
|---|---|---|---|---|
| Republican | Craig Hosmer (incumbent) | 71,731 | 55 | |
| Democratic | Joseph M. Kennick | 58,647 | 45 | |
| Total votes | 130,378 | 100 | ||
| Turnout | {{{votes}}} | |||
| Republican hold | ||||
1956
| Party | Candidate | Votes | % | |
|---|---|---|---|---|
| Republican | Craig Hosmer (incumbent) | 103,108 | 59.3 | |
| Democratic | Raymond C. "Ray" Simpson | 70,911 | 40.7 | |
| Total votes | 174,019 | 100.0 | ||
| Turnout | {{{votes}}} | |||
| Republican hold | ||||
1958
| Party | Candidate | Votes | % | |
|---|---|---|---|---|
| Republican | Craig Hosmer (incumbent) | 95,682 | 60 | |
| Democratic | Harry S. May | 63,684 | 40 | |
| Total votes | 159,366 | 100 | ||
| Turnout | {{{votes}}} | |||
| Republican hold | ||||
1960
| Party | Candidate | Votes | % | |
|---|---|---|---|---|
| Republican | Craig Hosmer (incumbent) | 129,851 | 70 | |
| Democratic | D. Patrick Ahern | 55,735 | 30 | |
| Total votes | 185,586 | 100 | ||
| Turnout | {{{votes}}} | |||
| Republican hold | ||||
1962
| Party | Candidate | Votes | % | |
|---|---|---|---|---|
| Democratic | Harlan Hagen (incumbent) | 91,684 | 58.9 | |
| Republican | G. Ray Arnett | 64,037 | 41.1 | |
| Total votes | 155,721 | 100.0 | ||
| Turnout | {{{votes}}} | |||
| Democratic hold | ||||
1964
| Party | Candidate | Votes | % | |
|---|---|---|---|---|
| Democratic | Harlan Hagen (incumbent) | 121,304 | 66.7 | |
| Republican | James E. Williams Jr. | 60,523 | 33.3 | |
| Total votes | 181,827 | 100.0 | ||
| Turnout | {{{votes}}} | |||
| Democratic hold | ||||
1966
| Party | Candidate | Votes | % | |||
|---|---|---|---|---|---|---|
| Republican | Bob Mathias | 96,699 | 55.9 | |||
| Democratic | Harlan Hagen (incumbent) | 76,346 | 44.1 | |||
| Total votes | 173,045 | 100.0 | ||||
| Turnout | {{{votes}}} | |||||
| Republican gain from Democratic | ||||||
1968
| Party | Candidate | Votes | % | |
|---|---|---|---|---|
| Republican | Bob Mathias (incumbent) | 100,008 | 65.2 | |
| Democratic | Harlan Hagen | 51,274 | 33.4 | |
| American Independent | Edward Calvin Williams | 2,186 | 1.4 | |
| Total votes | 153,468 | 100.0 | ||
| Turnout | {{{votes}}} | |||
| Republican hold | ||||
1970
| Party | Candidate | Votes | % | |
|---|---|---|---|---|
| Republican | Bob Mathias (incumbent) | 86,071 | 63.2 | |
| Democratic | Milton Spartacus Miller | 48,415 | 33.4 | |
| American Independent | Nora E. Hensley | 1,709 | 3.4 | |
| Total votes | 136,195 | 100.0 | ||
| Turnout | {{{votes}}} | |||
| Republican hold | ||||
1972
| Party | Candidate | Votes | % | |
|---|---|---|---|---|
| Republican | Bob Mathias (incumbent) | 109,993 | 66.5 | |
| Democratic | Vincent J. Lavery | 55,484 | 33.5 | |
| Total votes | 165,477 | 100.0 | ||
| Turnout | {{{votes}}} | |||
| Republican hold | ||||
1974
| Party | Candidate | Votes | % | |
|---|---|---|---|---|
| Republican | William M. Ketchum (inc.) | 66,603 | 52.7 | |
| Democratic | George A. Seielstad | 59,931 | 47.3 | |
| Total votes | 126,534 | 100.0 | ||
| Turnout | {{{votes}}} | |||
| Republican hold | ||||
1976
| Party | Candidate | Votes | % | |
|---|---|---|---|---|
| Republican | William M. Ketchum (inc.) | 101,658 | 64.2 | |
| Democratic | Dean Close | 56,683 | 35.8 | |
| Total votes | 158,341 | 100.0 | ||
| Turnout | {{{votes}}} | |||
| Republican hold | ||||
1978
| Party | Candidate | Votes | % | |
|---|---|---|---|---|
| Republican | Bill Thomas | 85,663 | 59.3 | |
| Democratic | Bob Sogge | 58,900 | 40.7 | |
| Total votes | 144,563 | 100.0 | ||
| Turnout | {{{votes}}} | |||
| Republican hold | ||||
1980
| Party | Candidate | Votes | % | |
|---|---|---|---|---|
| Republican | Bill Thomas (incumbent) | 126,046 | 71 | |
| Democratic | Mary Pat Timmermans | 51,415 | 29 | |
| Total votes | 177,461 | 100 | ||
| Turnout | {{{votes}}} | |||
| Republican hold | ||||
1982
| Party | Candidate | Votes | % | ||
|---|---|---|---|---|---|
| Democratic | Richard H. Lehman | 92,762 | 59.5 | ||
| Republican | Adrian C. Fondse | 59,664 | 38.3 | ||
| Libertarian | Marshall William Fritz | 3,501 | 2.2 | ||
| Total votes | 155,927 | 100.0 | |||
| Turnout | {{{votes}}} | ||||
| Democratic win (new seat) | |||||
1984
| Party | Candidate | Votes | % | |
|---|---|---|---|---|
| Democratic | Richard H. Lehman (inc.) | 128,186 | 67.3 | |
| Republican | Dale L. Ewen | 62,339 | 32.7 | |
| Total votes | 190,525 | 100.0 | ||
| Turnout | {{{votes}}} | |||
| Democratic hold | ||||
1986
| Party | Candidate | Votes | % | |
|---|---|---|---|---|
| Democratic | Richard H. Lehman (inc.) | 101,480 | 71.3 | |
| Republican | David C. Crevelt | 40,907 | 28.7 | |
| Total votes | 142,387 | 100.0 | ||
| Turnout | {{{votes}}} | |||
| Democratic hold | ||||
1988
| Party | Candidate | Votes | % | |
|---|---|---|---|---|
| Democratic | Richard H. Lehman (inc.) | 125,715 | 69.9 | |
| Republican | David A. Linn | 54,034 | 30.1 | |
| Total votes | 179,749 | 100.0 | ||
| Turnout | {{{votes}}} | |||
| Democratic hold | ||||
1990
| Party | Candidate | Votes | % | |
|---|---|---|---|---|
| Democratic | Richard H. Lehman (inc.) | 98,804 | 100.0 | |
| Turnout | {{{votes}}} | |||
| Democratic hold | ||||
1992
| Party | Candidate | Votes | % | |
|---|---|---|---|---|
| Democratic | Gary Condit (incumbent) | 139,704 | 84.7 | |
| Libertarian | Kim R. Almstrom | 25,307 | 15.3 | |
| Total votes | 165,011 | 100.0 | ||
| Turnout | {{{votes}}} | |||
| Democratic hold | ||||
1994
| Party | Candidate | Votes | % | |
|---|---|---|---|---|
| Democratic | Gary Condit (incumbent) | 91,106 | 65.52 | |
| Republican | Tom Carter | 44,046 | 31.68 | |
| Libertarian | James B. Morzella | 3,902 | 2.81 | |
| Total votes | 139,054 | 100.0 | ||
| Turnout | {{{votes}}} | |||
| Democratic hold | ||||
1996
| Party | Candidate | Votes | % | |
|---|---|---|---|---|
| Democratic | Gary Condit (incumbent) | 108,827 | 65.8% | |
| Republican | Bill Conrad | 52,695 | 31.8% | |
| Libertarian | James Morzella | 2,233 | 1.3% | |
| Natural Law | Page Riskin | 1,831 | 1.1% | |
| Total votes | 165,586 | 100.0% | ||
| Turnout | {{{votes}}} | |||
| Democratic hold | ||||
1998
| Party | Candidate | Votes | % | |
|---|---|---|---|---|
| Democratic | Gary Condit (incumbent) | 118,842 | 86.79% | |
| Libertarian | Linda M. Degroat | 18,089 | 13.21% | |
| Total votes | 136,931 | 100.0% | ||
| Turnout | {{{votes}}} | |||
| Democratic hold | ||||
2000
| Party | Candidate | Votes | % | |
|---|---|---|---|---|
| Democratic | Gary Condit (incumbent) | 118,842 | 67.2% | |
| Republican | Steve R. Wilson | 56,465 | 31.3% | |
| Natural Law | Page Roth Riskin | 2,860 | 1.5% | |
| Total votes | 178,167 | 100.0% | ||
| Turnout | {{{votes}}} | |||
| Democratic hold | ||||
2002
| Party | Candidate | Votes | % | |
|---|---|---|---|---|
| Democratic | Dennis Cardoza | 56,181 | 51.3 | |
| Republican | Dick Monteith | 47,528 | 43.4 | |
| American Independent | Kevin H. Cripe | 3,641 | 3.3 | |
| Libertarian | Linda De Groat | 2,194 | 2.0 | |
| No party | Donna Crowder (write-in) | 49 | 0.0 | |
| Turnout | 109,593 | |||
| Democratic hold | ||||
2004
| Party | Candidate | Votes | % | |
|---|---|---|---|---|
| Democratic | Dennis Cardoza (incumbent) | 103,732 | 67.5 | |
| Republican | Charles F. Pringle Sr. | 49,973 | 32.5 | |
| Total votes | 153,705 | 100.0 | ||
| Turnout | {{{votes}}} | |||
| Democratic hold | ||||
2006
| Party | Candidate | Votes | % | |
|---|---|---|---|---|
| Democratic | Dennis Cardoza (incumbent) | 71,182 | 65.5 | |
| Republican | John A. Kanno | 37,531 | 34.5 | |
| Total votes | 108,713 | 100.0 | ||
| Turnout | {{{votes}}} | |||
| Democratic hold | ||||
2008
| Party | Candidate | Votes | % | |
|---|---|---|---|---|
| Democratic | Dennis Cardoza (incumbent) | 130,192 | 100.0 | |
| Total votes | 130,192 | 100.0 | ||
| Turnout | {{{votes}}} | |||
| Democratic hold | ||||
2010
| Party | Candidate | Votes | % | |
|---|---|---|---|---|
| Democratic | Dennis Cardoza (incumbent) | 72,853 | 58.48 | |
| Republican | Michael Clare Berryhill Sr. | 51,716 | 41.52 | |
| Total votes | 124,569 | 100.00 | ||
| Turnout | {{{votes}}} | |||
| Democratic hold | ||||
2012
| Party | Candidate | Votes | % | |
|---|---|---|---|---|
| Democratic | Anna Eshoo | 212,831 | 70.5 | |
| Republican | Dave Chapman | 89,103 | 29.5 | |
| Total votes | 301,934 | 100.0 | ||
| Democratic hold | ||||
2014
| Party | Candidate | Votes | % | |
|---|---|---|---|---|
| Democratic | Anna Eshoo (incumbent) | 133,060 | 68% | |
| Republican | Richard B. Fox | 63,326 | 32% | |
| Total votes | 196,386 | 100% | ||
| Democratic hold | ||||
2016
| Party | Candidate | Votes | % | |
|---|---|---|---|---|
| Democratic | Anna Eshoo (incumbent) | 230,460 | 71% | |
| Republican | Richard B. Fox | 93,470 | 29% | |
| Total votes | 323,930 | 100% | ||
| Democratic hold | ||||
2018
| Party | Candidate | Votes | % | |
|---|---|---|---|---|
| Democratic | Anna Eshoo (incumbent) | 225,142 | 74.5% | |
| Republican | Christine Russell | 77,096 | 25.5% | |
| Total votes | 302,238 | 100% | ||
| Democratic hold | ||||
2020
| Party | Candidate | Votes | % | |
|---|---|---|---|---|
| Democratic | Anna Eshoo (incumbent) | 217,377 | 63.2 | |
| Democratic | Rishi Kumar | 126,750 | 36.8 | |
| Total votes | 344,127 | 100.0 | ||
| Democratic hold | ||||
2022
| Party | Candidate | Votes | % | |
|---|---|---|---|---|
| Democratic | Zoe Lofgren (incumbent) | 99,776 | 65.9 | |
| Republican | Peter Hernandez | 51,737 | 34.1 | |
| Total votes | 151,513 | 100.0 | ||
| Democratic hold | ||||
References
- "My Congressional District".
- "2022 Cook PVI: District Map and List". Cook Political Report. Retrieved January 10, 2023.
- "CA 2022 Congressional". Dave's Redistricting. January 4, 2022. Retrieved November 11, 2022.
- DePietro, Andrew. "The Wealthiest Congressional Districts Of 2022". Forbes. Retrieved November 22, 2022.
- "Lofgren Builds Support in New Congressional District that Stretches from San Jose to Salinas". San Jose Inside. January 18, 2022. Retrieved March 17, 2022.
- Supplement to the Statement of Vote Counties by Congressional Districts for President
- Supplement to the Statement of Vote Counties by Congressional Districts for United States Senator
- Supplement to the Statement of Vote Counties by Congressional Districts for Governor 2014
- Supplement to the Statement of Vote Counties by Congressional Districts for President 2016
- Supplement to the Statement of Vote Counties by Congressional Districts for United States Senator
- Supplement to the Statement of Vote Counties by Congressional Districts for Governor
- Supplement to the Statement of Vote Counties by Congressional Districts for United States Senator
- "Daily Kos Elections' presidential results by congressional district for 2020". Daily Kos. Retrieved November 20, 2022.
- "Counties by Congressional District for Recall Question" (PDF). sos.ca.gov. September 14, 2021. Retrieved May 2, 2022.
- "Counties by Congressional Districts for Governor" (PDF). sos.ca.gov. November 8, 2022. Retrieved May 4, 2023.
- "Statement of Vote (2000 President)" (PDF). Archived from the original (PDF) on May 20, 2011. Retrieved September 17, 2008.
- "Statement of Vote (2000 Senator)" (PDF). Archived from the original (PDF) on May 20, 2011. Retrieved September 17, 2008.
- "Statement of Vote (2002 Governor)" (PDF). Archived from the original (PDF) on November 11, 2010. Retrieved November 20, 2022.
- "Statement of Vote (2003 Recall Question)" (PDF). Archived from the original (PDF) on May 20, 2011. Retrieved October 8, 2007.
- "Statement of Vote (2003 Governor)" (PDF). Archived from the original (PDF) on May 20, 2011. Retrieved October 8, 2007.
- "Statement of Vote (2004 President)" (PDF). Archived from the original (PDF) on May 20, 2011. Retrieved August 8, 2007.
- "Statement of Vote (2004 Senator)" (PDF). Archived from the original (PDF) on August 10, 2011. Retrieved November 20, 2022.
- "Statement of Vote (2006 Governor)" (PDF). Archived from the original (PDF) on August 10, 2011. Retrieved November 20, 2022.
- "Statement of Vote (2006 Senator)" (PDF). Archived from the original (PDF) on August 10, 2011. Retrieved November 20, 2022.
- "(2008 President)". Archived from the original on February 11, 2009. Retrieved March 5, 2009.
- "Statement of Vote (2010 Governor)" (PDF). Archived from the original (PDF) on June 1, 2011. Retrieved July 27, 2011.
- "Statement of Vote (2010 Senator)" (PDF). Archived from the original (PDF) on June 1, 2011. Retrieved July 27, 2011.
- "1932 election results" (PDF). Retrieved November 20, 2022.
- "1934 election results" (PDF). Retrieved November 20, 2022.
- "1936 election results" (PDF). Retrieved November 20, 2022.
- "1938 election results" (PDF). Retrieved November 20, 2022.
- "1940 election results" (PDF). Retrieved November 20, 2022.
- 1942 election results
- 1944 election results
- 1946 election results
- 1948 election results
- 1950 election results
- 1952 election results
- "1954 election results" (PDF). Retrieved November 20, 2022.
- 1956 election results
- 1958 election results
- 1960 election results
- 1962 election results
- 1964 election results
- 1966 election results
- 1968 election results
- 1970 election results
- 1972 election results
- 1974 election results
- 1976 election results
- 1978 election results
- 1980 election results
- 1982 election results
- 1984 election results
- 1986 election results
- 1988 election results
- 1990 election results
- 1992 election results
- 1994 election results
- 1996 election results
- 1998 election results
- 2000 election results
- 2002 general election results Archived February 3, 2009, at the Wayback Machine
- 2004 general election results Archived August 21, 2008, at the Wayback Machine
- 2006 general election results Archived November 27, 2008, at the Wayback Machine
- 2008 general election results Archived December 21, 2008, at the Wayback Machine
- 2010 general election results
- 2012 general election results Archived October 19, 2013, at the Wayback Machine
- "U.S. House of Representatives District 18 - Districtwide Results". Archived from the original on December 21, 2014. Retrieved December 21, 2014.