California's 25th congressional district
California's 25th congressional district is a congressional district in the U.S. state of California. The district is currently represented by Democrat Raul Ruiz.
| California's 25th congressional district | |||
|---|---|---|---|
Interactive map of district boundaries since 2023 (Used in the 2022 elections) | |||
| Representative |
| ||
| Population (2022) | 773,601 | ||
| Median household income | $65,453[1] | ||
| Ethnicity |
| ||
| Cook PVI | D+6[2] | ||
.svg.png.webp)
The district includes all of Imperial County and parts of Riverside County and San Bernardino County. Cities in the new 25th district include Cathedral City, Indio, Coachella, El Centro, Calexico, San Jacinto, Hemet, and Needles.[3] Most of the majority-Latino parts of the Coachella Valley are in the 25th, while the rest of the valley is in the 41st district.
Demographics
According to the APM Research Lab's Voter Profile Tools (featuring the U.S. Census Bureau's 2019 American Community Survey), the district contained about 491,000 potential voters (citizens, age 18+). Of these, 44% are White, 34% Latino, 10% Black, and 9% Asian. Immigrants make up 17% of the district's potential voters. Median income among households (with one or more potential voter) in the district is about $86,600, while 9% of households live below the poverty line. 12% of residents 25 years and older have not graduated high school, while 26% hold a bachelor's degree or higher.
Recent results in statewide elections
Composition
| # | County | Seat | Population |
|---|---|---|---|
| 25 | Imperial | El Centro | 179,851 |
| 65 | Riverside | Riverside | 2,458,395 |
| 71 | San Bernardino | San Bernardino | 2,194,710 |
As of the 2020 redistricting, California's 25th congressional district is located in the Mojave Desert. It encompasses Imperial County, most of Riverside County, and the eastern edge of San Bernardino. The district covers the entirety of the Arizona-California border.
Riverside County is split between this district and the 41st district. They are partitioned by Terwillinger Rd, Bailey Rd, Candelaria, Elder Creek Rd, Bonny Ln, Tule Peak Rd, Eastgate Trail, Goldrush Rd, Rule Valley Rd, Laura Ln, Dove Dr, Lago Grande, Barbara Trail, Valley Dr, Foolish Pleasure Rd, Highway 371, Gelding Way, Puckit Dr, Indian Rd, Wellman Rd, El Toro Rd, Burnt Valley Rd, Cahuilla Rd, Highway 74, Bull Canyon Rd, Santa Rosa-San Jacinto Mountains National Monument, Fred Waring Dr, Washington St, Highway 10, Davall Dr, Dinah Shore Dr, Plumley Rd, Gerald Ford Dr, E Ramon Rd, San Luis Rey Dr, San Joaquin Dr, Clubhouse View Dr, Mount San Jacinto State Park, Azalea Creek, Black Mountain Trail, Highway 243, North Fork San Jacinto River, Stetson Ave, Hemet St, Cornell St, Girard St, E Newport Rd, Domenigoni Parkway, Leon Rd, Grand Ave, State Highway 74, California Ave, W Devonshire Ave, Warren Rd, Ramona Expressway, San Jacinto River, Highway 79, Oak Valley Parkway, Champions Dr, Union St, Brookside Ave. The 25th district takes in the cities of Coachella, Banning, Desert Hot Springs, Indio, San Jacinto, Hemet, Beaumont, and Blythe, as well as the census-designated places Valle Vista and East Hemet.
Cities & CDP with 10,000 or more people
- Hemet - 89,833
- Indio - 89,137
- Beaumont - 53,036
- Cathedral City - 51,493
- San Jacinto - 49,215
- El Centro - 44,322
- Coachella - 41,941
- Calexico - 38,633
- Desert Hot Springs - 32,512
- Banning - 29,505
- Brawley - 26,416
- East Hemet - 19,432
- Valle Vista - 19,072
- Imperial - 18,631
- Blythe - 18,317
List of members representing the district
| Member | Party | Dates | Cong- ress |
Electoral history | Counties |
|---|---|---|---|---|---|
| District created January 3, 1953 | |||||
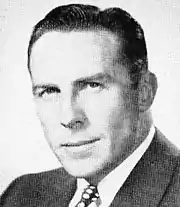 Patrick J. Hillings (Arcadia) |
Republican | January 3, 1953 – January 3, 1959 |
83rd 84th 85th |
Redistricted from the 12th district and re-elected in 1952. Re-elected in 1954. Re-elected in 1956. Retired to run for Attorney General of California. |
1953–1967 Los Angeles |
.jpg.webp) George A. Kasem (West Covina) |
Democratic | January 3, 1959 – January 3, 1961 |
86th | Elected in 1958. Lost re-election. | |
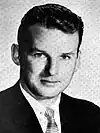
 John H. Rousselot (San Gabriel) |
Republican | January 3, 1961 – January 3, 1963 |
87th | Elected in 1960. Lost re-election. | |
 Ronald B. Cameron (Whittier) |
Democratic | January 3, 1963 – January 3, 1967 |
88th 89th |
Elected in 1962. Re-elected in 1964. Lost re-election. | |
 Charles E. Wiggins (West Covina) |
Republican | January 3, 1967 – January 3, 1975 |
90th 91st 92nd 93rd |
Elected in 1966. Re-elected in 1968. Re-elected in 1970. Re-elected in 1972. Redistricted to the 39th district. |
1967–1973 Los Angeles, Orange |
| 1973–1983 Los Angeles | |||||
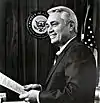
 Edward R. Roybal (Los Angeles) |
Democratic | January 3, 1975 – January 3, 1993 |
94th 95th 96th 97th 98th 99th 100th 101st 102nd |
Redistricted from the 30th district and re-elected in 1974. Re-elected in 1976. Re-elected in 1978. Re-elected in 1980. Re-elected in 1982. Re-elected in 1984. Re-elected in 1986. Re-elected in 1988. Re-elected in 1990. Retired. | |
| 1983–1993 Central/eastern Los Angeles | |||||
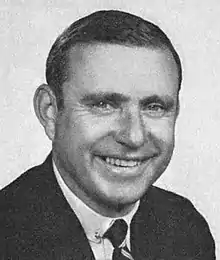
 Buck McKeon (Santa Clarita) |
Republican | January 3, 1993 – January 3, 2015 |
103rd 104th 105th 106th 107th 108th 109th 110th 111th 112th 113th |
Elected in 1992. Re-elected in 1994. Re-elected in 1996. Re-elected in 1998. Re-elected in 2000. Re-elected in 2002. Re-elected in 2004. Re-elected in 2006. Re-elected in 2008. Re-elected in 2010. Re-elected in 2012. Retired. |
1993–2003 Northern Los Angeles |
2003–2013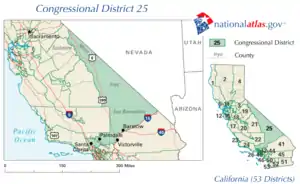 Inyo, northern Los Angeles, Mono, northwestern San Bernardino | |||||
2013–2023.tif.png.webp) Northern Los Angeles including Palmdale and Santa Clarita, northeastern Ventura including Simi Valley | |||||
 Steve Knight (Lancaster) |
Republican | January 3, 2015 – January 3, 2019 |
114th 115th |
Elected in 2014. Re-elected in 2016. Lost re-election. | |
 Katie Hill (Santa Clarita) |
Democratic | January 3, 2019 – November 3, 2019 |
116th | Elected in 2018. Resigned. | |
| Vacant | November 3, 2019 – May 12, 2020 |
116th 117th | |||
.jpg.webp) Mike Garcia (Santa Clarita) |
Republican | May 12, 2020 – January 3, 2023 |
Elected to finish Hill's term. Re-elected in 2020. Redistricted to the 27th district. | ||
 Raul Ruiz (Indio) |
Democratic | January 3, 2023 – present |
118th | Redistricted from the 36th district and re-elected in 2022. | 2023–present_(new_version).svg.png.webp) Indio, Coachella, Desert Hot Springs, Cathedral City, San Jacinto, Hemet, Needles, Half of Rancho Mirage High School (Northern half), Coachella Valley, Palm Springs Area and El Centro in the Colorado Desert |
Election results
Original district: 1953–1967
| Party | Candidate | Votes | % | |
|---|---|---|---|---|
| Republican | Patrick J. Hillings (Incumbent) | 135,465 | 64.3 | |
| Democratic | Woodrow Wilson Sayre | 75,125 | 35.7 | |
| Total votes | 210,590 | 100.0 | ||
| Turnout | {{{votes}}} | |||
| Republican hold | ||||
| Party | Candidate | Votes | % | |
|---|---|---|---|---|
| Republican | Patrick J. Hillings (Incumbent) | 113,027 | 65.2 | |
| Democratic | John S. Sobieski | 60,370 | 34.8 | |
| Total votes | 173,397 | 100.0 | ||
| Turnout | {{{votes}}} | |||
| Republican hold | ||||
| Party | Candidate | Votes | % | |
|---|---|---|---|---|
| Republican | Patrick J. Hillings (Incumbent) | 166,305 | 63.8 | |
| Democratic | John S. Sobieski | 94,180 | 36.2 | |
| Total votes | 260,485 | 100.0 | ||
| Turnout | {{{votes}}} | |||
| Republican hold | ||||
| Party | Candidate | Votes | % | |||
|---|---|---|---|---|---|---|
| Democratic | George A. Kasem | 135,009 | 50.1 | |||
| Republican | Prescott O. Lieberg | 134,406 | 49.9 | |||
| Total votes | 269,415 | 100.0 | ||||
| Turnout | {{{votes}}} | |||||
| Democratic gain from Republican | ||||||
| Party | Candidate | Votes | % | |||
|---|---|---|---|---|---|---|
| Republican | John H. Rousselot | 182,545 | 53.6 | |||
| Democratic | George A. Kasem (Incumbent) | 158,289 | 46.4 | |||
| Total votes | 340,834 | 100.0 | ||||
| Turnout | {{{votes}}} | |||||
| Republican gain from Democratic | ||||||
| Party | Candidate | Votes | % | |||
|---|---|---|---|---|---|---|
| Democratic | Ronald B. Cameron | 62,371 | 53.6 | |||
| Republican | John H. Rousselot (Incumbent) | 53,961 | 46.4 | |||
| Total votes | 116,332 | 100.0 | ||||
| Turnout | {{{votes}}} | |||||
| Democratic gain from Republican | ||||||
| Party | Candidate | Votes | % | |
|---|---|---|---|---|
| Democratic | Ronald B. Cameron (Incumbent) | 81,320 | 55.4 | |
| Republican | Frank J. Walton | 65,344 | 44.6 | |
| Total votes | 146,664 | 100.0 | ||
| Turnout | {{{votes}}} | |||
| Democratic hold | ||||
First redistricting: 1967–1973
| Party | Candidate | Votes | % | |||
|---|---|---|---|---|---|---|
| Republican | Charles E. Wiggins | 70,154 | 52.6 | |||
| Democratic | Ronald B. Cameron (Incumbent) | 63,345 | 47.4 | |||
| Total votes | 133,499 | |||||
| Republican gain from Democratic | ||||||
| Party | Candidate | Votes | % | |
|---|---|---|---|---|
| Republican | Charles E. Wiggins (Incumbent) | 141,600 | 68.6 | |
| Democratic | Keith F. Shirey | 64,732 | 31.4 | |
| Total votes | 206,332 | 100.0 | ||
| Turnout | {{{votes}}} | |||
| Republican hold | ||||
| Party | Candidate | Votes | % | |
|---|---|---|---|---|
| Republican | Charles E. Wiggins (Incumbent) | 116,169 | 63.3 | |
| Democratic | Leslie W. "Les" Craven | 64,386 | 35.1 | |
| American Independent | Kevin Scanlon | 2,994 | 1.6 | |
| Total votes | 183,549 | 100.0 | ||
| Turnout | {{{votes}}} | |||
| Republican hold | ||||
Second redistricting: 1973–1983
| Party | Candidate | Votes | % | |
|---|---|---|---|---|
| Republican | Charles E. Wiggins (Incumbent) | 115,908 | 64.9 | |
| Democratic | Leslie W. "Les" Craven | 50,015 | 31.9 | |
| American Independent | Alfred Romirez | 5,541 | 3.1 | |
| Total votes | 171,464 | 100.0 | ||
| Turnout | {{{votes}}} | |||
| Republican hold | ||||
| Party | Candidate | Votes | % | |||
|---|---|---|---|---|---|---|
| Democratic | Edward R. Roybal (Incumbent) | 43,998 | 100.0 | |||
| Turnout | {{{votes}}} | |||||
| Democratic gain from Republican | ||||||
| Party | Candidate | Votes | % | |
|---|---|---|---|---|
| Democratic | Edward R. Roybal (Incumbent) | 57,966 | 71.9 | |
| Republican | Robert K. Watson | 17,737 | 22.0 | |
| Peace and Freedom | Marilyn Se | 4,922 | 6.1 | |
| Total votes | 80,625 | 100.0 | ||
| Turnout | {{{votes}}} | |||
| Democratic hold | ||||
| Party | Candidate | Votes | % | |
|---|---|---|---|---|
| Democratic | Edward R. Roybal (Incumbent) | 45,881 | 67.4 | |
| Republican | Robert K. Watson | 22,205 | 32.6 | |
| Total votes | 68,086 | 100.0 | ||
| Turnout | {{{votes}}} | |||
| Democratic hold | ||||
| Party | Candidate | Votes | % | |
|---|---|---|---|---|
| Democratic | Edward R. Roybal (Incumbent) | 49,080 | 66.0 | |
| Republican | Richard E. Ferraro | 21,116 | 28.4 | |
| Libertarian | William D. Mitchell | 4,169 | 5.6 | |
| Total votes | 74,365 | 100.0 | ||
| Turnout | {{{votes}}} | |||
| Democratic hold | ||||
Third redistricting: 1983–1993
| Party | Candidate | Votes | % | |
|---|---|---|---|---|
| Democratic | Edward R. Roybal (Incumbent) | 71,106 | 84.5 | |
| Libertarian | Daniel John Gorham | 12,060 | 14.5 | |
| Total votes | 83,166 | 100.0 | ||
| Turnout | {{{votes}}} | |||
| Democratic hold | ||||
| Party | Candidate | Votes | % | |
|---|---|---|---|---|
| Democratic | Edward R. Roybal (Incumbent) | 74,261 | 71.7 | |
| Republican | Roy D. "Bill" Bloxom | 24,968 | 24.1 | |
| Libertarian | Anthony G. Bajada | 4,370 | 4.2 | |
| Total votes | 103,599 | 100.0 | ||
| Turnout | {{{votes}}} | |||
| Democratic hold | ||||
| Party | Candidate | Votes | % | |
|---|---|---|---|---|
| Democratic | Edward R. Roybal (Incumbent) | 62,692 | 76.1 | |
| Republican | Gregory L. Hardy | 17,558 | 21.3 | |
| Libertarian | Ted Brown | 2,163 | 2.6 | |
| Total votes | 82,413 | 100.0 | ||
| Turnout | {{{votes}}} | |||
| Democratic hold | ||||
| Party | Candidate | Votes | % | |
|---|---|---|---|---|
| Democratic | Edward R. Roybal (Incumbent) | 85,378 | 85.5 | |
| Peace and Freedom | Paul Reyes | 8,746 | 8.8 | |
| Libertarian | John C. Thie | 5,752 | 5.8 | |
| Total votes | 98,876 | 100.0 | ||
| Turnout | {{{votes}}} | |||
| Democratic hold | ||||
| Party | Candidate | Votes | % | |
|---|---|---|---|---|
| Democratic | Edward R. Roybal (Incumbent) | 48,120 | 70.0 | |
| Republican | Steven J. Renshaw | 17,021 | 24.8 | |
| Libertarian | Robert H. Scott | 3,576 | 5.2 | |
| Total votes | 68,717 | 100.0 | ||
| Turnout | {{{votes}}} | |||
| Democratic hold | ||||
Fourth redistricting: 1993–2003
| Party | Candidate | Votes | % | ||
|---|---|---|---|---|---|
| Republican | Buck McKeon | 113,611 | 51.9 | ||
| Democratic | James H. Gilmartin | 72,233 | 33.0 | ||
| Independent | Rick Pamplin | 13,930 | 6.4 | ||
| Libertarian | Peggy L. Christensen | 6,932 | 3.2 | ||
| Green | Charles Wilken | 6,919 | 3.2 | ||
| Peace and Freedom | Nancy Lawrence | 5,090 | 2.3 | ||
| Total votes | 218,715 | 100.0 | |||
| Turnout | {{{votes}}} | ||||
| Republican win (new seat) | |||||
| Party | Candidate | Votes | % | |
|---|---|---|---|---|
| Republican | Buck McKeon (Incumbent) | 110,301 | 64.89 | |
| Democratic | James H. Gilmartin | 53,445 | 31.44 | |
| Libertarian | Devin Cutler | 6,205 | 3.65 | |
| No party | Tulley (write-in) | 20 | 0.01 | |
| Total votes | 169,971 | 100.0 | ||
| Turnout | {{{votes}}} | |||
| Republican hold | ||||
| Party | Candidate | Votes | % | |
|---|---|---|---|---|
| Republican | Buck McKeon (Incumbent) | 122,428 | 62.4 | |
| Democratic | Diane Trautman | 65,089 | 33.2 | |
| Libertarian | Bruce Acker | 6,173 | 3.2 | |
| Peace and Freedom | Justin Gerber | 2,513 | 1.2 | |
| Total votes | 196,203 | 100.0 | ||
| Turnout | {{{votes}}} | |||
| Republican hold | ||||
| Party | Candidate | Votes | % | |
|---|---|---|---|---|
| Republican | Buck McKeon (Incumbent) | 114,013 | 74.67 | |
| Libertarian | Bruce Acker | 38,669 | 25.33 | |
| Total votes | 152,682 | 100.0 | ||
| Turnout | {{{votes}}} | |||
| Republican hold | ||||
| Party | Candidate | Votes | % | |
|---|---|---|---|---|
| Republican | Buck McKeon (Incumbent) | 138,628 | 62.3 | |
| Democratic | Sid Gold | 73,921 | 33.2 | |
| Libertarian | Bruce R. Acker | 7,219 | 3.2 | |
| Natural Law | Mews Small | 3,010 | 1.3 | |
| Total votes | 222,778 | 100.0 | ||
| Turnout | {{{votes}}} | |||
| Republican hold | ||||
Fifth redistricting: 2003–2013
| Party | Candidate | Votes | % | |
|---|---|---|---|---|
| Republican | Buck McKeon (Incumbent) | 80,775 | 65.0 | |
| Democratic | Bob Conaway | 38,674 | 31.1 | |
| Libertarian | Frank M. Consolo Jr. | 4,887 | 3.9 | |
| Total votes | 124,336 | 100.0 | ||
| Turnout | {{{votes}}} | |||
| Republican hold | ||||
| Party | Candidate | Votes | % | |
|---|---|---|---|---|
| Republican | Buck McKeon (Incumbent) | 145,575 | 64.5 | |
| Democratic | Fred "Tim" Willoughby | 80,395 | 35.5 | |
| Total votes | 225,970 | 100.0 | ||
| Turnout | {{{votes}}} | |||
| Republican hold | ||||
| Party | Candidate | Votes | % | |
|---|---|---|---|---|
| Republican | Buck McKeon (Incumbent) | 93,987 | 60.0 | |
| Democratic | Robert Rodriguez | 55,913 | 35.7 | |
| Libertarian | David W. Erickson | 6,873 | 4.3 | |
| Total votes | 156,773 | 100.0 | ||
| Turnout | {{{votes}}} | |||
| Republican hold | ||||
| Party | Candidate | Votes | % | |
|---|---|---|---|---|
| Republican | Buck McKeon (Incumbent) | 144,660 | 57.73 | |
| Democratic | Jackie Conaway | 105,929 | 42.27 | |
| Total votes | 250,589 | 100.0 | ||
| Turnout | {{{votes}}} | 72.24 | ||
| Republican hold | ||||
| Party | Candidate | Votes | % | |
|---|---|---|---|---|
| Republican | Buck McKeon (Incumbent) | 118,308 | 61.83 | |
| Democratic | Jackie Conaway | 73,028 | 38.17 | |
| Total votes | 191,336 | 100.0 | ||
| Turnout | {{{votes}}} | |||
| Republican hold | ||||
Sixth redistricting: 2013–2023
| Party | Candidate | Votes | % | |
|---|---|---|---|---|
| Republican | Buck McKeon (Incumbent) | 121,593 | 53.2 | |
| Democratic | Lee Rogers | 106,982 | 46.8 | |
| Total votes | 228,575 | 100.0 | ||
| Turnout | {{{votes}}} | |||
| Republican hold | ||||
| Party | Candidate | Votes | % | |
|---|---|---|---|---|
| Republican | Steve Knight | 60,847 | 53.3 | |
| Republican | Tony Strickland | 53,225 | 46.7 | |
| Total votes | 114,072 | 100.0 | ||
| Turnout | {{{votes}}} | |||
| Republican hold | ||||
| Party | Candidate | Votes | % | |
|---|---|---|---|---|
| Republican | Steve Knight (Incumbent) | 138,755 | 53.1 | |
| Democratic | Bryan Caforio | 122,406 | 46.9 | |
| Total votes | 261,161 | 100.0 | ||
| Republican hold | ||||
| Party | Candidate | Votes | % | |
|---|---|---|---|---|
| Democratic | Katie Hill | 133,209 | 54.4 | |
| Republican | Steve Knight (Incumbent) | 111,813 | 45.6 | |
| Total votes | 245,022 | 100.0 | ||
| Democratic gain from Republican | ||||
| Party | Candidate | Votes | % | ||
|---|---|---|---|---|---|
| Republican | Mike Garcia | 95,383 | 54.9 | ||
| Democratic | Christy Smith | 78,406 | 45.1 | ||
| Total votes | 173,868 | 100.0 | |||
| Republican gain from Democratic | |||||
| Party | Candidate | Votes | % | |
|---|---|---|---|---|
| Republican | Mike Garcia (Incumbent) | 169,638 | 50.05 | |
| Democratic | Christy Smith | 169,305 | 49.95 | |
| Total votes | 338,943 | 100.0 | ||
| Republican hold | ||||
Seventh redistricting: 2023–present
| Party | Candidate | Votes | % | |
|---|---|---|---|---|
| Democratic | Raul Ruiz (Incumbent) | 87,641 | 57.4 | |
| Republican | Brian Hawkins | 65,101 | 42.6 | |
| Total votes | 152,742 | 100.0 | ||
| Democratic hold | ||||
References
- Center for New Media & Promotion (CNMP), US Census Bureau. "My Congressional District". www.census.gov. Retrieved October 5, 2023.
- "2022 Cook PVI: District Map and List". Cook Political Report. Retrieved January 10, 2023.
- "CA 2022 Congressional". Dave's Redistricting. January 4, 2022. Retrieved November 14, 2022.
- "Supplement to the Statement of Vote, President by County (1992)" (PDF). Retrieved March 14, 2021.
- "Supplement to the Statement of Vote, Senator by County (1992)" (PDF). Retrieved March 14, 2021.
- "Supplement to the Statement of Vote, Senator by County (1992)" (PDF). Retrieved March 14, 2021.
- "Supplement to the Statement of Vote, United States Senator, Counties by Congressional Districts (1994)" (PDF). Retrieved March 14, 2021.
- "Supplement to the Statement of Vote, Governor, Counties by Congressional Districts (1994)" (PDF). Retrieved March 14, 2021.
- "Supplement to the Statement of Vote, President, Counties by Congressional Districts (1996)" (PDF). Retrieved March 14, 2021.
- "Supplement to the Statement of Vote, Senator, Counties by Congressional Districts (1998)" (PDF). Archived from the original (PDF) on October 1, 2011. Retrieved March 14, 2021.
- "Supplement to the Statement of Vote, Governor, Counties by Congressional Districts (1998)" (PDF). Archived from the original (PDF) on October 1, 2011. Retrieved March 14, 2021.
- "Statement of Vote (2000 President)" (PDF). Archived from the original (PDF) on May 20, 2011. Retrieved July 19, 2019.
- "Statement of Vote (2000 Senator)" (PDF). Archived from the original (PDF) on May 20, 2011. Retrieved July 19, 2019.
- "Statement of Vote (2002 Governor)" (PDF). Archived from the original (PDF) on November 11, 2010. Retrieved July 19, 2019.
- "Statement of Vote (2003 Recall Question)" (PDF). Archived from the original (PDF) on May 20, 2011. Retrieved July 19, 2019.
- "Statement of Vote (2003 Governor)" (PDF). Archived from the original (PDF) on May 20, 2011. Retrieved July 19, 2019.
- "Statement of Vote (2004 President)" (PDF). Archived from the original (PDF) on May 20, 2011. Retrieved July 19, 2019.
- "Statement of Vote (2004 Senator)" (PDF). Archived from the original (PDF) on August 10, 2011. Retrieved July 19, 2019.
- "Statement of Vote (2006 Senator)" (PDF). Archived from the original (PDF) on August 10, 2011. Retrieved July 19, 2019.
- "Statement of Vote (2006 Governor)" (PDF). Archived from the original (PDF) on August 10, 2011. Retrieved July 19, 2019.
- "(2008 President)". Archived from the original on February 14, 2009. Retrieved July 19, 2019.
- "Counties by Congressional District for Recall Question" (PDF). sos.ca.gov. September 14, 2021. Retrieved May 2, 2022.
- "1952 election results" (PDF). Clerk.house.gov. Retrieved September 22, 2018.
- "1954 election results" (PDF). Clerk.house.gov. Retrieved September 22, 2018.
- "1956 election results" (PDF). Clerk.house.gov. Retrieved September 22, 2018.
- "1958 election results" (PDF). Clerk.house.gov. Retrieved September 22, 2018.
- "1960 election results" (PDF). Clerk.house.gov. Retrieved September 22, 2018.
- "1962 election results" (PDF). Clerk.house.gov. Retrieved September 22, 2018.
- "1964 election results" (PDF). Clerk.house.gov. Retrieved September 22, 2018.
- "1966 election results" (PDF). Clerk.house.gov. Retrieved September 22, 2018.
- "1968 election results" (PDF). Clerk.house.gov. Retrieved September 22, 2018.
- "1970 election results" (PDF). Clerk.house.gov. Retrieved September 22, 2018.
- "1972 election results" (PDF). Clerk.house.gov. Retrieved September 22, 2018.
- "1974 election results" (PDF). Clerk.house.gov. Retrieved September 22, 2018.
- "1976 election results" (PDF). Clerk.house.gov. Retrieved September 22, 2018.
- "1978 election results" (PDF). Clerk.house.gov. Retrieved September 22, 2018.
- "1980 election results" (PDF). Clerk.house.gov. Retrieved September 22, 2018.
- "1982 election results" (PDF). Clerk.house.gov. Retrieved September 22, 2018.
- "1984 election results" (PDF). Clerk.house.gov. Retrieved September 22, 2018.
- "1986 election results" (PDF). Clerk.house.gov. Retrieved September 22, 2018.
- "1988 election results" (PDF). Clerk.house.gov. Retrieved September 22, 2018.
- "1990 election results" (PDF). Clerk.house.gov. Retrieved September 22, 2018.
- "1992 election results" (PDF). Clerk.house.gov. Retrieved September 22, 2018.
- "1994 election results" (PDF). Clerk.house.gov. Retrieved September 22, 2018.
- "1996 election results" (PDF). Clerk.house.gov. Retrieved September 22, 2018.
- "1998 election results" (PDF). Clerk.house.gov. Retrieved September 22, 2018.
- "2000 election results" (PDF). Clerk.house.gov. Retrieved September 22, 2018.
- "2002 general election results" (PDF). Archived from the original (PDF) on February 3, 2009. Retrieved July 19, 2019.
- "2006 general election results" (PDF). Archived from the original (PDF) on November 27, 2008. Retrieved July 19, 2019.
- "Archived copy" (PDF). Archived from the original (PDF) on February 2, 2014. Retrieved January 21, 2014.
{{cite web}}: CS1 maint: archived copy as title (link) - "Archived copy" (PDF). Archived from the original (PDF) on May 20, 2011. Retrieved January 21, 2014.
{{cite web}}: CS1 maint: archived copy as title (link) - "Archived copy" (PDF). Archived from the original (PDF) on October 19, 2013. Retrieved January 21, 2014.
{{cite web}}: CS1 maint: archived copy as title (link) - "U.S. House of Representatives District 25 - Districtwide Results | General Election | California Secretary of State". Archived from the original on December 22, 2014. Retrieved December 22, 2014.
- "2016 General Election Results | California Secretary of State". Archived from the original on November 30, 2016. Retrieved December 10, 2016.
- "United States Representative in Congress by District" (PDF). Retrieved March 19, 2019.
- "California Special Election Results: 25th Congressional District". The New York Times. New York, New York. May 13, 2020. Retrieved May 14, 2020.
- "U.S. House of Representatives District 25 - Districtwide Results". Retrieved May 21, 2020.
External links
- "California's 25th Congressional District - CA-25 Representatives & District Map". GovTrack.us. Retrieved May 23, 2020.
- "RAND California Election Returns: District Definitions". December 19, 2010. Archived from the original on December 19, 2010. Retrieved May 23, 2020.
- "Congressional District 25" (PDF). September 10, 2008. Archived from the original (PDF) on September 10, 2008. Retrieved May 23, 2020.