California's 27th congressional district
California's 27th congressional district is a congressional district in the U.S. state of California. The district is currently represented by Republican Mike Garcia. It was one of 18 districts that would have voted for Joe Biden in the 2020 presidential election had they existed in their current configuration while being won or held by a Republican in 2022, and the only Republican-held congressional district to include portions of the actual city of Los Angeles.
| California's 27th congressional district | |||
|---|---|---|---|
Interactive map of district boundaries since 2023 (Used in the 2022 elections) | |||
| Representative |
| ||
| Population (2022) | 737,592 | ||
| Median household income | $98,123[1] | ||
| Ethnicity |
| ||
| Cook PVI | D+4[2] | ||
.svg.png.webp)
The district includes most of northern Los Angeles County, including the cities of Santa Clarita, Palmdale, and Lancaster, and parts of the northwestern San Fernando Valley in the city of Los Angeles.[3] Prior to redistricting in 2022, the district was located in the San Gabriel Valley.
Recent results in statewide elections
| Election results from statewide races | ||
|---|---|---|
| Year | Office | Results |
| 1990 | Governor[4] | Feinstein 52.0% - 42.9% |
| 1992 | President[5] | Clinton 44.3% - 36.6% |
| Senator[6] | Herschensohn 47.5% - 44.9% | |
| Senator (Special)[7] | Feinstein 50.7% - 42.1% | |
| 1994 | Governor[8] | Wilson 59.5% - 37.5% |
| Senator[9] | Huffington 47.7% - 44.6% | |
| 1996 | President[10] | Clinton 49.1% - 40.5% |
| 1998 | Governor[11] | Davis 56.6% - 40.3% |
| Senator[12] | Boxer 51.1% - 45.6% | |
| 2000 | President[13] | Gore 53.4% - 41.4% |
| Senator[14] | Feinstein 56.6% - 36.4% | |
| 2002 | Governor[15] | Davis 50.1% - 40.4% |
| 2003 | Recall[16][17] | |
| Schwarzenegger 52.0% - 29.9% | ||
| 2004 | President[18] | Kerry 59.3% - 39.3% |
| Senator[19] | Boxer 63.7% - 31.2% | |
| 2006 | Governor[20] | Schwarzenegger 52.7% - 42.3% |
| Senator[21] | Feinstein 63.2% - 31.3% | |
| 2008 | President[22] | Obama 66.1% - 31.7% |
| 2010 | Governor[23] | Brown 57.9% - 36.8% |
| Senator[24] | Boxer 57.6% - 36.7% | |
| 2012 | President[25] | Obama 62.6% - 35.0% |
| Senator[26] | Feinstein 65.2% - 34.8% | |
| 2014 | Governor[27] | Brown 62.3% – 37.7% |
| 2016 | President[28] | Clinton 66.0% - 28.4% |
| Senator[29] | Harris 62.1% - 37.9% | |
| 2018 | Governor[30] | Newsom 65.1% – 34.9% |
| Senator[31] | Feinstein 60.1% – 39.9% | |
| 2020 | President[32] | Biden 67.2% - 30.8% |
| 2021 | Recall[33] | |
| 2022 | Governor[34] | Dahle 50.9 - 49.1% |
| Senator | Padilla 51.5 - 48.5% | |
Composition
| # | County | Seat | Population |
|---|---|---|---|
| 37 | Los Angeles | Los Angeles | 9,829,544 |
As of the 2020 redistricting, California's 27th congressional district is located in southern California. It encompasses most of northern Los Angeles County, including the cities of Santa Clarita, Lancaster, and Palmdale, California; the neighborhoods of Porter Ranch and Granada Hills in the city of Los Angeles, along with the Sierra Pelona Mountains and the northern slopes of the San Gabriel Mountains.
Cities & CDP with 10,000 or more people
- Santa Clarita - 228,673
- Lancaster - 173,516
- Palmdale - 169,450
List of members representing the district
| Member | Party | Dates | Cong ress(es) |
Electoral history | Counties |
|---|---|---|---|---|---|
| District created January 3, 1953 | |||||
 Harry R. Sheppard (Yucaipa) |
Democratic | January 3, 1953 – January 3, 1963 |
83rd 84th 85th 86th 87th |
Redistricted from the 21st district and re-elected in 1952. Re-elected in 1954. Re-elected in 1956. Re-elected in 1958. Re-elected in 1960. Redistricted to the 33rd district. |
1953–1963 San Bernardino |
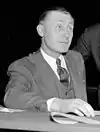
 Everett G. Burkhalter (Los Angeles) |
Democratic | January 3, 1963 – January 3, 1965 |
88th | Elected in 1962. Lost re-election. |
1963–1969 Los Angeles |
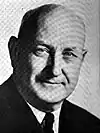
 Edwin Reinecke (Tujunga) |
Republican | January 3, 1965 – January 21, 1969 |
89th 90th 91st |
Elected in 1964. Re-elected in 1966. Re-elected in 1968. Resigned to become Lieutenant Governor of California. | |
| 1969–1973 Los Angeles | |||||
| Vacant | January 21, 1969 – April 29, 1969 |
91st | |||
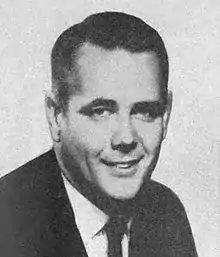
 Barry Goldwater Jr (Burbank) |
Republican | April 29, 1969 – January 3, 1975 |
91st 92nd 93rd |
Elected to finish Reinecke's term. Re-elected in 1970. Re-elected in 1972. Redistricted to the 20th district. | |
| 1973–1975 Los Angeles, Southern Ventura | |||||
 Alphonzo E. Bell Jr. (Los Angeles) |
Republican | January 3, 1975 – January 3, 1977 |
94th | Redistricted from the 28th district and re-elected in 1974. Retired to run for U.S. Senator. |
1975–1983 Los Angeles |
 Bob Dornan (Los Angeles) |
Republican | January 3, 1977 – January 3, 1983 |
95th 96th 97th |
Elected in 1976. Re-elected in 1978. Re-elected in 1980. Retired to run for U.S. Senator. | |
 Mel Levine (Los Angeles) |
Democratic | January 3, 1983 – January 3, 1993 |
98th 99th 100th 101st 102nd |
Elected in 1982. Re-elected in 1984. Re-elected in 1986. Re-elected in 1988. Re-elected in 1990. Retired. |
1983–1993 Western Los Angeles (Manhattan/Redondo Beach, Santa Monica) |
 Carlos Moorhead (Glendale) |
Republican | January 3, 1993 – January 3, 1997 |
103rd 104th |
Redistricted from the 22nd district and re-elected in 1992. Re-elected in 1994. Retired. |
1993–2003 Los Angeles (Burbank, Glendale, Pasadena) |
 Jim Rogan (Glendale) |
Republican | January 3, 1997 – January 3, 2001 |
105th 106th |
Elected in 1996. Re-elected in 1998. Lost re-election. | |
 Adam Schiff (Burbank) |
Democratic | January 3, 2001 – January 3, 2003 |
107th | Elected in 2000. Redistricted to the 29th district. | |
 Brad Sherman (Los Angeles) |
Democratic | January 3, 2003 – January 3, 2013 |
108th 109th 110th 111th 112th |
Redistricted from the 24th district and re-elected in 2002. Re-elected in 2004. Re-elected in 2006. Re-elected in 2008. Re-elected in 2010. Redistricted to the 30th district. |
2003–2013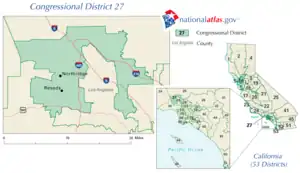 Parts of Western Los Angeles County including Northridge and Reseda |
 Judy Chu (Monterey Park) |
Democratic | January 3, 2013 – January 3, 2023 |
113th 114th 115th 116th 117th |
Redistricted from the 32nd district and re-elected in 2012. Re-elected in 2014. Re-elected in 2016. Re-elected in 2018. Re-elected in 2020. Redistricted to the 28th district. |
2013–2023.tif.png.webp) San Gabriel Foothills including Alhambra and Pasadena |
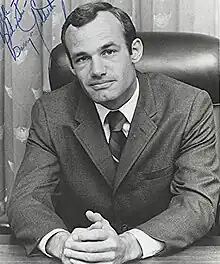
.jpg.webp) Mike Garcia (Santa Clarita) |
Republican | January 3, 2023 – present |
118th | Redistricted from the 25th district and re-elected in 2022. | 2023–present_(new_version).svg.png.webp) Most of northern Los Angeles County including the cities of Santa Clarita & Lancaster |
Election results
|
1952 • 1954 • 1956 • 1958 • 1960 • 1962 • 1964 • 1966 • 1968 • 1969 (Special) • 1970 • 1972 • 1974 • 1976 • 1978 • 1980 • 1982 • 1984 • 1986 • 1988 • 1990 • 1992 • 1994 • 1996 • 1998 • 2000 • 2002 • 2004 • 2006 • 2008 • 2010 • 2012 • 2014 • 2016 • 2018 • 2020 • 2022 |
1952
| Party | Candidate | Votes | % | |
|---|---|---|---|---|
| Democratic | Harry R. Sheppard (Incumbent) | 68,773 | 55.0 | |
| Republican | Carl B. Hilliard | 56,202 | 45.0 | |
| Total votes | 124,975 | 100.0 | ||
| Democratic hold | ||||
1954
| Party | Candidate | Votes | % | |
|---|---|---|---|---|
| Democratic | Harry R. Sheppard (Incumbent) | 65,389 | 64.8 | |
| Republican | Martin K. Barrett | 35,594 | 35.2 | |
| Total votes | 100,983 | 100.0 | ||
| Democratic hold | ||||
1956
| Party | Candidate | Votes | % | |
|---|---|---|---|---|
| Democratic | Harry R. Sheppard (Incumbent) | 124,662 | 100.0 | |
| Democratic hold | ||||
1958
| Party | Candidate | Votes | % | |
|---|---|---|---|---|
| Democratic | Harry R. Sheppard (Incumbent) | 105,062 | 72.3 | |
| Republican | Robert M. Castle | 40,317 | 27.7 | |
| Total votes | 145,379 | 100.0 | ||
| Democratic hold | ||||
1960
| Party | Candidate | Votes | % | |
|---|---|---|---|---|
| Democratic | Harry R. Sheppard (Incumbent) | 123,645 | 66.8 | |
| Republican | Robert M. Castle | 61,484 | 33.2 | |
| Total votes | 185,129 | 100.0 | ||
| Democratic hold | ||||
1962
| Party | Candidate | Votes | % | |||
|---|---|---|---|---|---|---|
| Democratic | Everett G. Burkhalter | 66,979 | 52.1 | |||
| Republican | Edgar W. Hiestand (Incumbent) | 61,538 | 47.9 | |||
| Total votes | 128,517 | 100.0 | ||||
| Democratic gain from Republican | ||||||
1964
| Party | Candidate | Votes | % | |||
|---|---|---|---|---|---|---|
| Republican | Edwin Reinecke | 83,141 | 51.7 | |||
| Democratic | Tom Bane | 77,587 | 48.3 | |||
| Total votes | 160,734 | 100.0 | ||||
| Republican gain from Democratic | ||||||
1966
| Party | Candidate | Votes | % | |
|---|---|---|---|---|
| Republican | Edwin Reinecke (Incumbent) | 93,890 | 65.3 | |
| Democratic | John A. "Jack" Howard | 49,785 | 34.7 | |
| Total votes | 143,675 | 100.0 | ||
| Republican hold | ||||
1968
| Party | Candidate | Votes | % | |
|---|---|---|---|---|
| Republican | Edwin Reinecke (Incumbent) | 158,309 | 72.2 | |
| Democratic | John T. Butchko | 60,808 | 27.8 | |
| Total votes | 219,117 | 100.0 | ||
| Republican hold | ||||
1969 (Special)
| Party | Candidate | Votes | % | |
|---|---|---|---|---|
| Republican | Barry Goldwater Jr. | 64,734 | 56.9 | |
| Democratic | John K. Van de Kamp | 48,983 | 43.1 | |
| Total votes | 113,717 | 100.0 | ||
| Republican hold | ||||
1970
| Party | Candidate | Votes | % | |
|---|---|---|---|---|
| Republican | Barry Goldwater Jr. (Incumbent) | 139,326 | 66.6 | |
| Democratic | N. "Toni" Kimmel | 63,652 | 30.5 | |
| Peace and Freedom | Edward Richer | 3,306 | 1.6 | |
| American Independent | John H. Hind | 2,642 | 1.3 | |
| Total votes | 208,926 | 100.0 | ||
| Republican hold | ||||
1972
| Party | Candidate | Votes | % | |
|---|---|---|---|---|
| Republican | Barry Goldwater Jr. (Incumbent) | 117,622 | 57.4 | |
| Democratic | Mark S. Novak | 87,295 | 42.6 | |
| Total votes | 204,917 | 100.0 | ||
| Republican hold | ||||
1974
| Party | Candidate | Votes | % | |
|---|---|---|---|---|
| Republican | Alphonzo E. Bell Jr. (Incumbent) | 99,645 | 63.9 | |
| Democratic | John Dalessio | 50,919 | 32.5 | |
| Peace and Freedom | Jerry Rubin | 5,547 | 3.6 | |
| Total votes | 156,111 | 100.0 | ||
| Republican hold | ||||
1976
| Party | Candidate | Votes | % | |
|---|---|---|---|---|
| Republican | Bob Dornan | 114,623 | 54.7 | |
| Democratic | Gary Familian | 94,988 | 45.3 | |
| Total votes | 209,611 | 100.0 | ||
| Republican hold | ||||
1978
| Party | Candidate | Votes | % | |
|---|---|---|---|---|
| Republican | Bob Dornan (Incumbent) | 89,392 | 51.0 | |
| Democratic | Carey Peck | 85,880 | 49.0 | |
| Total votes | 175,272 | 100.0 | ||
| Republican hold | ||||
1980
| Party | Candidate | Votes | % | |
|---|---|---|---|---|
| Republican | Bob Dornan (Incumbent) | 109,807 | 51.0 | |
| Democratic | Carey Peck | 100,061 | 46.5 | |
| Libertarian | Jerome L. "Jerry" Sievers | 5,448 | 2.5 | |
| Total votes | 215,316 | 100.0 | ||
| Republican hold | ||||
1982
| Party | Candidate | Votes | % | |||
|---|---|---|---|---|---|---|
| Democratic | Mel Levine | 108,347 | 59.5 | |||
| Republican | Bart W. Christensen | 67,479 | 37.0 | |||
| Libertarian | ZacK Richardson | 6,391 | 3.5 | |||
| Total votes | 182,217 | 100.0 | ||||
| Democratic gain from Republican | ||||||
1984
| Party | Candidate | Votes | % | |
|---|---|---|---|---|
| Democratic | Mel Levine (Incumbent) | 116,933 | 55.0 | |
| Republican | Robert B. Scribner | 88,896 | 41.8 | |
| Peace and Freedom | Thomas L. O'Connor Jr. | 3,815 | 1.8 | |
| Libertarian | Jeff Avrech | 3,137 | 1.5 | |
| Total votes | 212,781 | 100.0 | ||
| Democratic hold | ||||
1986
| Party | Candidate | Votes | % | |
|---|---|---|---|---|
| Democratic | Mel Levine (Incumbent) | 110,403 | 63.7 | |
| Republican | Rob Scribner | 59,410 | 34.3 | |
| Peace and Freedom | Thomas L. O'Connor Jr. | 2,078 | 1.2 | |
| Libertarian | Larry Leathers | 1,429 | 0.8 | |
| Total votes | 173,320 | 100.0 | ||
| Democratic hold | ||||
1988
| Party | Candidate | Votes | % | |
|---|---|---|---|---|
| Democratic | Mel Levine (Incumbent) | 148,814 | 67.5 | |
| Republican | Dennis Galbraith | 65,307 | 29.6 | |
| Libertarian | William J. Fulco | 6,214 | 2.8 | |
| Total votes | 220,335 | 100.0 | ||
| Democratic hold | ||||
1990
| Party | Candidate | Votes | % | |
|---|---|---|---|---|
| Democratic | Mel Levine (Incumbent) | 90,857 | 58.2 | |
| Republican | David Barrett Cohen | 58,140 | 37.2 | |
| Peace and Freedom | Edward E. Ferrer | 7,101 | 4.5 | |
| Total votes | 156,098 | 100.0 | ||
| Democratic hold | ||||
1992
| Party | Candidate | Votes | % | |
|---|---|---|---|---|
| Republican | Carlos Moorhead (Incumbent) | 105,521 | 49.7 | |
| Democratic | Doug Kahn | 83,805 | 39.4 | |
| Green | Jesse A. Moorman | 11,003 | 5.2 | |
| Peace and Freedom | Margaret L. Edwards | 7,329 | 3.5 | |
| Libertarian | Dennis Decherd | 4,790 | 2.3 | |
| Independent | Ballantyne (write-in) | 2 | 0.0 | |
| Total votes | 212,450 | 100.0 | ||
| Republican hold | ||||
1994
| Party | Candidate | Votes | % | |
|---|---|---|---|---|
| Republican | Carlos Moorhead (Incumbent) | 88,341 | 53.0 | |
| Democratic | Doug Kahn | 70,267 | 42.1 | |
| American Independent | Bill Gibbs | 4,328 | 2.6 | |
| Libertarian | Dennis Decherd | 3,838 | 2.3 | |
| Total votes | 166,774 | 100.0 | ||
| Republican hold | ||||
1996
| Party | Candidate | Votes | % | |
|---|---|---|---|---|
| Republican | Jim Rogan | 95,310 | 50.2 | |
| Democratic | Doug Kahn | 82,014 | 43.2 | |
| Libertarian | Elizabeth Michael | 6,645 | 3.5 | |
| Green | Walt Sheasby | 4,195 | 3.3 | |
| Natural Law | Martin Zucker | 1,766 | 0.8 | |
| Total votes | 189,930 | 100.0 | ||
| Republican hold | ||||
1998
| Party | Candidate | Votes | % | |
|---|---|---|---|---|
| Republican | Jim Rogan (Incumbent) | 80,702 | 50.7 | |
| Democratic | Barry A. Gordon | 73,875 | 46.5 | |
| Libertarian | Bob New | 4,489 | 2.8 | |
| Total votes | 159,066 | 100.0 | ||
| Republican hold | ||||
2000
| Party | Candidate | Votes | % | |||
|---|---|---|---|---|---|---|
| Democratic | Adam Schiff | 113,708 | 52.7 | |||
| Republican | Jim Rogan (Incumbent) | 94,518 | 43.9 | |||
| Natural Law | Miriam R. Hospodar | 3,873 | 1.7 | |||
| Libertarian | Ted Brown | 3,675 | 1.7 | |||
| Total votes | 215,774 | 100.0 | ||||
| Democratic gain from Republican | ||||||
2002
| Party | Candidate | Votes | % | |
|---|---|---|---|---|
| Democratic | Brad Sherman (Incumbent) | 79,815 | 62.0 | |
| Republican | Robert M. Levy | 48,996 | 38.0 | |
| Total votes | 128,811 | 100.0 | ||
| Democratic hold | ||||
2004
| Party | Candidate | Votes | % | |
|---|---|---|---|---|
| Democratic | Brad Sherman (Incumbent) | 125,296 | 62.3 | |
| Republican | Robert M. Levy | 66,946 | 33.3 | |
| Green | Eric J. Carter | 8,956 | 4.4 | |
| Total votes | 201,198 | 100.0 | ||
| Democratic hold | ||||
2006
| Party | Candidate | Votes | % | |
|---|---|---|---|---|
| Democratic | Brad Sherman (Incumbent) | 92,650 | 68.8 | |
| Republican | Peter Hankwitz | 42,074 | 31.2 | |
| Total votes | 134,724 | 100.0 | ||
| Democratic hold | ||||
2008
| Party | Candidate | Votes | % | |
|---|---|---|---|---|
| Democratic | Brad Sherman (Incumbent) | 135,665 | 68.6 | |
| Republican | Navraj Singh | 49,510 | 24.8 | |
| Libertarian | Tim Denton | 14,171 | 6.6 | |
| Total votes | 185,175 | 100.0 | ||
| Democratic hold | ||||
2010
| Party | Candidate | Votes | % | |
|---|---|---|---|---|
| Democratic | Brad Sherman (Incumbent) | 102,927 | 65.1 | |
| Republican | Mark Reed | 55,056 | 34.9 | |
| Total votes | 157,983 | 100.0 | ||
| Democratic hold | ||||
2012
| Party | Candidate | Votes | % | |
|---|---|---|---|---|
| Democratic | Judy Chu (Incumbent) | 154,191 | 64.0 | |
| Republican | Jack Orswell | 86,817 | 36.0 | |
| Total votes | 241,008 | 100.0 | ||
| Democratic hold | ||||
2014
| Party | Candidate | Votes | % | |
|---|---|---|---|---|
| Democratic | Judy Chu (Incumbent) | 75,728 | 59.4 | |
| Republican | Jack Orswell | 51,852 | 40.6 | |
| Total votes | 127,580 | 100.0 | ||
| Democratic hold | ||||
2016
| Party | Candidate | Votes | % | |
|---|---|---|---|---|
| Democratic | Judy Chu (Incumbent) | 168,977 | 67.4 | |
| Republican | Jack Orswell | 81,655 | 32.6 | |
| Total votes | 250,632 | 100.0 | ||
| Democratic hold | ||||
2018
| Party | Candidate | Votes | % | |
|---|---|---|---|---|
| Democratic | Judy Chu (Incumbent) | 160,504 | 79.2 | |
| Democratic | Bryan Witt | 42,132 | 20.8 | |
| Total votes | 202,636 | 100.0 | ||
| Democratic hold | ||||
2020
| Party | Candidate | Votes | % | |
|---|---|---|---|---|
| Democratic | Judy Chu (Incumbent) | 221,411 | 69.8 | |
| Republican | Johnny J. Nalbandian | 95,907 | 30.2 | |
| Total votes | 317,318 | 100.0 | ||
| Democratic hold | ||||
2022
| Party | Candidate | Votes | % | |
|---|---|---|---|---|
| Republican | Mike Garcia (Incumbent) | 104,624 | 53.2 | |
| Democratic | Christy Smith | 91,892 | 46.8 | |
| Total votes | 196,516 | 100.0 | ||
| Republican hold | ||||
References
- US Census
- "2022 Cook PV: District Map and List". The Cook Political Report. July 12, 2022. Retrieved January 5, 2023.
- Rahul Mukherjee; Vanessa Martinez (December 21, 2021). "California has new congressional districts. Find yours here". Los Angeles Times. Retrieved August 20, 2022.
- Statement of Vote (1990 Governor)
- Statement of Vote (1992 President)
- Statement of Vote (1992 Senate)
- Statement of Vote (1992 Senate)
- Statement of Vote (1994 Governor)
- Statement of Vote (1994 Senate)
- Statement of Vote (1996 President)
- Statement of Vote (1998 Governor) Archived September 29, 2011, at the Wayback Machine
- Statement of Vote (1998 Senate) Archived September 29, 2011, at the Wayback Machine
- Statement of Vote (2000 President)
- Statement of Vote (2000 Senator)
- Statement of Vote (2002 Governor)
- Statement of Vote (2003 Recall Question)
- Statement of Vote (2003 Governor)
- Statement of Vote (2004 President)
- Statement of Vote (2004 Senator)
- Statement of Vote (2006 Governor)
- Statement of Vote (2006 Senator)
- Statement of Vote (2008 President)
- Statement of Vote (2010 Governor)
- Statement of Vote (2010 Senator)
- Statement of Vote (2012 President)
- Statement of Vote (2012 Senator)
- Statement of Vote (2014 Governor)
- Statement of Vote (2016 President)
- Statement of Vote (2016 Senator)
- Statement of Vote (2018 Governor)
- Statement of Vote (2018 Senator)
- "Daily Kos Elections' presidential results by congressional district for 2020, 2016, and 2012".
- "Counties by Congressional District for Recall Question" (PDF). sos.ca.gov. September 14, 2021. Retrieved May 2, 2022.
- "Counties by Congressional Districts for Governor" (PDF). sos.ca.gov. November 8, 2022. Retrieved May 4, 2023.
- 1952 election results
- 1954 election results
- 1956 election results
- 1958 election results
- 1960 election results
- 1962 election results
- 1964 election results
- 1966 election results
- 1968 election results
- 1969 special election results
- 1970 election results
- 1972 election results
- 1974 election results
- 1976 election results
- 1978 election results
- 1980 election results
- 1982 election results
- 1984 election results
- 1986 election results
- 1988 election results
- 1990 election results
- 1992 election results
- 1994 election results
- 1996 election results
- 1998 election results
- 2000 election results
- 2002 election results
- 2004 election results
- 2006 election results
- 2008 election results
- 2010 election results
- 2012 election results
- 2014 election results
- 2016 election results
- 2018 election results