California's 32nd congressional district
California's 32nd congressional district is a congressional district in the U.S. state of California based in Los Angeles County. The 32nd district takes in the city of Malibu and the Los Angeles neighborhoods of Pacific Palisades, Beverly Glen, Bel Air, Studio City, Sherman Oaks, Woodland Hills, West Hills, Canoga Park, Winnetka, Reseda, Encino, Chatsworth, Northridge, Brentwood, North Hills, as well as the south side of Granada Hills.
| California's 32nd congressional district | |||
|---|---|---|---|
Interactive map of district boundaries since January 3, 2023 | |||
| Representative |
| ||
| Population (2022) | 783,556 | ||
| Median household income | $103,213[1] | ||
| Ethnicity |
| ||
| Cook PVI | D+20[2] | ||
.svg.png.webp)
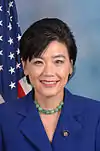
The district is currently represented by Democrat Brad Sherman.
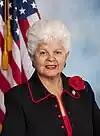
The district was previously represented by Democrat Judy Chu. Following the 2012 elections, due to redistricting, Chu ran for U.S. Representative in the 27th congressional district, while Grace Napolitano ran in the 32nd congressional district, having been displaced from the 38th district. Sherman, the district's current representative, previously sat in the House for California's 30th congressional district.
Recent results in statewide elections
| Election results from statewide races | ||
|---|---|---|
| Year | Office | Results |
| 1990 | Governor[3] | Wilson 50.3% – 44.4% |
| 1992 | President[4] | Clinton 78.0% – 12.7% |
| Senator[5] | Boxer 76.5% – 18.1% | |
| Senator (special)[6] | Feinstein 80.5% – 15.1% | |
| 1994 | Governor[7] | Brown 68.4% – 28.9% |
| Senator[8] | Feinstein 75.3% – 18.9% | |
| 1996 | President[9] | Clinton 81.3% – 12.1% |
| 1998 | Governor[10] | Davis 84.9% – 12.3% |
| Senator[11] | Boxer 82.1% – 15.5% | |
| 2000 | President[12] | Gore 83.4% – 13.0% |
| Senator[13] | Feinstein 81.5% – 11.8% | |
| 2002 | Governor[14] | Davis 59.5% – 31.9% |
| 2003 | Recall[15][16] | |
| Schwarzenegger 42.0% – 41.9% | ||
| 2004 | President[17] | Kerry 62.3% – 36.6% |
| Senator[18] | Boxer 68.3% – 26.0% | |
| 2006 | Governor[19] | Angelides 53.8% – 41.5% |
| Senator[20] | Feinstein 68.1% – 26.7% | |
| 2008 | President[21] | Obama 68.2% – 29.8% |
| 2010 | Governor[22] | Brown 64.6% – 29.1% |
| Senator[23] | Boxer 63.7% – 29.9% | |
| 2012 | President[24] | Obama 65.2% – 32.5% |
| Senator[25] | Feinstein 66.7% – 33.3% | |
| 2014 | Governor[26] | Brown 59.8% – 40.2% |
| 2016 | President[27] | Clinton 66.6% – 27.7% |
| Senator[28] | Harris 51.4% – 48.6% | |
| 2018 | Governor[29] | Newsom 65.2% – 34.8% |
| Senator[30] | Feinstein 53.2% – 46.8% | |
| 2020 | President[31] | Biden 65.2% – 32.8% |
| 2021 | Recall[32] | |
| 2022 | Governor[33] | Newsom 66.4 - 33.6% |
| Senator | Padilla 68.7 - 31.3% | |
Composition
| # | County | Seat | Population |
|---|---|---|---|
| 37 | Los Angeles | Los Angeles | 9,861,224 |
As of the 2020 redistricting, California's 32nd congressional district is located in Southern California. Half of the district covers the westernmost border of Los Angeles County; the other half covers western Los Angeles.
Los Angeles County is split between this district and the 27th, 29th, 30th and 36th districts. The 32nd and 27th are partitioned by Devonshire St, Blue Creek, Chatsworth St, Balboa Blvd, Kingsbury St, Genesta Ave, Aliso Canyon Wash, and Ronald Reagan Freeway.
The 32nd and 30th are partitioned by Lankershim Blvd, Fredonia Dr, Cahuenga Blvd W, Broadlawn Dr, Multiview Dr, Mulholland Dr, Laurel Canyon Blvd, W Sunset Blvd, Ozeta Ter, and Doheny Rd.
The 32nd and 36th are N Hillcrest Rd/La Collina Dr, N Hillcrest Rd/Sierra Mar Pl, Crescent Dr, Walker Dr/Sunset Pl, Meredith Pl/Castle Pl, Loma Vista Dr, Cherokee Ln, Schuyler Rd, Greystone Park, Readcrest Dr/Miradero Rd, Coldwater Canyon Dr/Lindacrest Dr, Lago Vista Dr, N Beverly Dr, Tower Grove Dr/Tower Rd, W Sunset Blvd, Veteran Ave, Wilshire Blvd, Malcolm Ave, Glendon Ave, Santa Monica Blvd, Pontius Ave, Cotner Ave, Purdue Ave, Butler Ave, Centinela Ave, Centinela Ave/S Carmelina Ave, Montana Ave, 26th St, and Adelaide Dr.
Cities and CDPs with 10,000 or more people
- Los Angeles: 3,898,747
- Malibu: 10,654
List of members representing the district
| Member | Party | Dates | Cong ress(es) |
Electoral history | Counties |
|---|---|---|---|---|---|
| District created January 3, 1963 | |||||
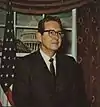 Craig Hosmer (Long Beach) |
Republican | January 3, 1963 – December 31, 1974 |
88th 89th 90th 91st 92nd 93rd |
Redistricted from the 18th district and re-elected in 1962. Re-elected in 1964. Re-elected in 1966. Re-elected in 1968. Re-elected in 1970. Re-elected in 1972. Resigned. |
1963–1969 Los Angeles |
| 1969–1973 Los Angeles, Orange | |||||
| 1973–1975 Los Angeles | |||||
| Vacant | December 31, 1974 – January 3, 1975 |
93rd | |||
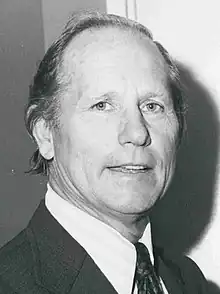 Glenn M. Anderson (Los Angeles) |
Democratic | January 3, 1975 – January 3, 1993 |
94th 95th 96th 97th 98th 99th 100th 101st 102nd |
Redistricted from the 35th district and re-elected in 1974. Re-elected in 1976. Re-elected in 1978. Re-elected in 1980. Re-elected in 1982. Re-elected in 1984. Re-elected in 1986. Re-elected in 1988. Re-elected in 1990. Retired. |
1975–1983 Los Angeles |
| 1983–1993 Los Angeles (Long Beach) | |||||
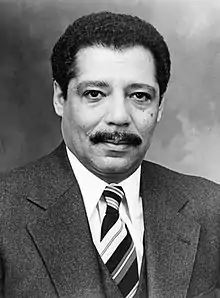 Julian C. Dixon (Los Angeles) |
Democratic | January 3, 1993 – December 8, 2000 |
103rd 104th 105th 106th |
Redistricted from the 28th district and re-elected in 1992. Re-elected in 1994. Re-elected in 1996. Re-elected in 1998. Re-elected in 2000, but died before his term began. |
1993–2003 Los Angeles (Culver City) |
| Vacant | December 8, 2000 – June 5, 2001 |
106th 107th | |||
 Diane Watson (Los Angeles) |
Democratic | June 5, 2001 – January 3, 2003 |
107th | Elected to finish Dixon's term. Redistricted to the 33rd district. | |
 Hilda Solis (El Monte) |
Democratic | January 3, 2003 – February 24, 2009 |
108th 109th 110th 111th |
Redistricted from the 31st district and re-elected in 2002. Re-elected in 2004. Re-elected in 2006. Re-elected in 2008. Resigned to become U.S. Secretary of Labor. |
2003–2013 Los Angeles (Baldwin Park, Covina) |
| Vacant | February 24, 2009 – July 14, 2009 |
111th | |||
 Judy Chu (Monterey Park) |
Democratic | July 14, 2009 – January 3, 2013 |
111th 112th |
Elected to finish Solis's term. Re-elected in 2010. Redistricted to the 27th district. | |
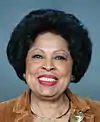
 Grace Napolitano (Norwalk) |
Democratic | January 3, 2013 – January 3, 2023 |
113th 114th 115th 116th 117th. |
Redistricted from the 38th district and re-elected in 2012. Re-elected in 2014. Re-elected in 2016. Re-elected in 2018. Re-elected in 2020. Redistricted to the 31st district. |
2013–2023.tif.png.webp) San Gabriel Valley including El Monte and West Covina |
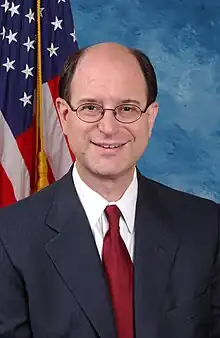 Brad Sherman (Los Angeles) |
Democratic | January 3, 2023 – present |
118th | Redistricted from the 30th district and re-elected in 2022. | 2023–present_(new_version).svg.png.webp) Western San Fernando Valley of Los Angeles County and the eastern Simi Hills of Ventura County |
Election results
|
1962 • 1964 • 1966 • 1968 • 1970 • 1972 • 1974 • 1976 • 1978 • 1980 • 1982 • 1984 • 1986 • 1988 • 1990 • 1992 • 1994 • 1996 • 1998 • 2000 • 2001 (Special) • 2002 • 2004 • 2006 • 2008 • 2009 (Special) • 2010 • 2012 • 2014 • 2016 • 2018 • 2020 • 2022 |
1962
| Party | Candidate | Votes | % | |
|---|---|---|---|---|
| Republican | Craig Hosmer (Incumbent) | 115,915 | 70.2 | |
| Democratic | J. J. Johovich | 47,917 | 29.8 | |
| Total votes | 163,832 | 100.0 | ||
| Republican hold | ||||
1964
| Party | Candidate | Votes | % | |
|---|---|---|---|---|
| Republican | Craig Hosmer (Incumbent) | 132,603 | 68.9 | |
| Democratic | Michael Cullen | 59,765 | 31.1 | |
| Total votes | 192,368 | 100.0 | ||
| Republican hold | ||||
1966
| Party | Candidate | Votes | % | |
|---|---|---|---|---|
| Republican | Craig Hosmer (Incumbent) | 139,328 | 80.1 | |
| Democratic | Tracy Odell | 34,609 | 19.9 | |
| Total votes | 173,937 | 100.0 | ||
| Republican hold | ||||
1968
| Party | Candidate | Votes | % | |
|---|---|---|---|---|
| Republican | Craig Hosmer (Incumbent) | 138,494 | 73.8 | |
| Democratic | Arthur J. Gottlieb | 45,308 | 24.1 | |
| American Independent | Richard B. Williams | 3,898 | 2.1 | |
| Total votes | 187,700 | 100.0 | ||
| Republican hold | ||||
1970
| Party | Candidate | Votes | % | |
|---|---|---|---|---|
| Republican | Craig Hosmer (Incumbent) | 119,340 | 71.5 | |
| Democratic | Walter L. Mallonee | 44,278 | 26.5 | |
| Peace and Freedom | John S. Donohue | 3,227 | 2.0 | |
| Total votes | 166,845 | 100.0 | ||
| Republican hold | ||||
1972
| Party | Candidate | Votes | % | |
|---|---|---|---|---|
| Republican | Craig Hosmer (Incumbent) | 147,016 | 65.9 | |
| Democratic | Dennis Murray | 71,394 | 32.0 | |
| Peace and Freedom | John S. Donohue | 4,804 | 2.1 | |
| Total votes | 223,214 | 100.0 | ||
| Republican hold | ||||
1974
| Party | Candidate | Votes | % | |
|---|---|---|---|---|
| Democratic | Glenn M. Anderson (Incumbent) | 82,485 | 87.7 | |
| American Independent | Virgil V. Badalich | 8,710 | 9.2 | |
| Peace and Freedom | Frank H. Walker | 2,877 | 3.1 | |
| Total votes | 94,072 | 100.0 | ||
| Democratic hold | ||||
1976
| Party | Candidate | Votes | % | |
|---|---|---|---|---|
| Democratic | Glenn M. Anderson (Incumbent) | 92,034 | 72.2 | |
| Republican | Clifford O. Young | 35,394 | 27.8 | |
| Total votes | 127,428 | 100.0 | ||
| Democratic hold | ||||
1978
| Party | Candidate | Votes | % | |
|---|---|---|---|---|
| Democratic | Glenn M. Anderson (Incumbent) | 74,004 | 71.4 | |
| Republican | Sonya Mathison | 23,242 | 22.4 | |
| American Independent | Ida Bader | 6,363 | 6.2 | |
| Total votes | 103,609 | 100.0 | ||
| Democratic hold | ||||
1980
| Party | Candidate | Votes | % | |
|---|---|---|---|---|
| Democratic | Glenn M. Anderson (Incumbent) | 84,057 | 65.9 | |
| Republican | John R. Adler | 39,260 | 30.8 | |
| Libertarian | Thomas A. Cosgrove | 4,209 | 3.3 | |
| Total votes | 127,526 | 100.0 | ||
| Democratic hold | ||||
1982
| Party | Candidate | Votes | % | |
|---|---|---|---|---|
| Democratic | Glenn M. Anderson (Incumbent) | 84,663 | 58.0 | |
| Republican | Brian F. Lungren | 57,863 | 39.6 | |
| Peace and Freedom | Eugene E. Ryle | 3,473 | 2.4 | |
| Total votes | 145,999 | 100.0 | ||
| Democratic hold | ||||
1984
| Party | Candidate | Votes | % | |
|---|---|---|---|---|
| Democratic | Glenn M. Anderson (Incumbent) | 102,961 | 60.7 | |
| Republican | Roger E. Fiola | 62,176 | 36.6 | |
| Libertarian | Mark F. Denny | 2,517 | 1.5 | |
| Peace and Freedom | Patrick John McCoy | 2,051 | 1.2 | |
| Total votes | 169,705 | 100.0 | ||
| Democratic hold | ||||
1986
| Party | Candidate | Votes | % | |
|---|---|---|---|---|
| Democratic | Glenn M. Anderson (Incumbent) | 90,739 | 68.5 | |
| Republican | Joyce M. Robertson | 39,003 | 29.4 | |
| Peace and Freedom | John S. Donohue | 2,799 | 2.1 | |
| Total votes | 132,541 | 100.0 | ||
| Democratic hold | ||||
1988
| Party | Candidate | Votes | % | |
|---|---|---|---|---|
| Democratic | Glenn M. Anderson (Incumbent) | 114,666 | 66.9 | |
| Republican | Sanford W. Kahn | 50,710 | 29.6 | |
| Peace and Freedom | Vikki Murdock | 4,032 | 2.4 | |
| Libertarian | Marc F. Denny | 1,941 | 1.1 | |
| Total votes | 171,349 | 100.0 | ||
| Democratic hold | ||||
1990
| Party | Candidate | Votes | % | |
|---|---|---|---|---|
| Democratic | Glenn M. Anderson (Incumbent) | 68,268 | 61.5 | |
| Republican | Sanford W. Kahn | 42,692 | 38.5 | |
| Total votes | 110,960 | |||
| Democratic hold | ||||
1992
| Party | Candidate | Votes | % | |
|---|---|---|---|---|
| Democratic | Julian C. Dixon (Incumbent) | 150,644 | 87.2 | |
| Libertarian | Robert G. "Bob" Weber Jr. | 12,834 | 7.2 | |
| Peace and Freedom | William R. Williams II | 9,782 | 5.6 | |
| Independent | Leanick-Beltran (write-in) | 2 | 0.0 | |
| Total votes | 173,262 | 100.0 | ||
| Democratic hold | ||||
1994
| Party | Candidate | Votes | % | |
|---|---|---|---|---|
| Democratic | Julian C. Dixon (Incumbent) | 98,017 | 77.6 | |
| Republican | Ernie A. Farhat | 22,190 | 17.6 | |
| Peace and Freedom | John Honigsfeld | 6,099 | 4.8 | |
| Total votes | 126,306 | 100.0 | ||
| Democratic hold | ||||
1996
| Party | Candidate | Votes | % | |
|---|---|---|---|---|
| Democratic | Julian C. Dixon (Incumbent) | 124,712 | 82.4 | |
| Republican | Larry Ardito | 18,768 | 12.4 | |
| Libertarian | Neal Donner | 6,390 | 4.2 | |
| Natural Law | Rashied Jibri | 1,557 | 1.0 | |
| Total votes | 151,427 | 100.0 | ||
| Democratic hold | ||||
1998
| Party | Candidate | Votes | % | |
|---|---|---|---|---|
| Democratic | Julian C. Dixon (Incumbent) | 112,253 | 86.7 | |
| Republican | Laurence Ardito | 14,622 | 11.3 | |
| Libertarian | Velko Milosevich | 2,617 | 2.0 | |
| Total votes | 129,492 | 100.0 | ||
| Democratic hold | ||||
2000
| Party | Candidate | Votes | % | |
|---|---|---|---|---|
| Democratic | Julian C. Dixon (Incumbent) | 137,447 | 83.6 | |
| Republican | Kathy Williamson | 19,924 | 12.2 | |
| Libertarian | Bob Weber | 3,875 | 2.3 | |
| Natural Law | Rashied Jibri | 3,281 | 1.9 | |
| Total votes | 164,527 | 100.0 | ||
| Democratic hold | ||||
2001 (Special)
| Party | Candidate | Votes | % | |
|---|---|---|---|---|
| Democratic | Diane Watson | 75,584 | 71.4 | |
| Republican | Noel Irwin Hentschel | 20,088 | 19.0 | |
| Green | Donna J. Warren | 3,792 | 3.6 | |
| Reform | Ezola B. Foster | 1,557 | 1.5 | |
| Invalid or blank votes | 4,575 | 4.5 | ||
| Total votes | 105,596 | 100.0 | ||
| Turnout | {{{votes}}} | 37.6 | ||
| Democratic hold | ||||
2002
| Party | Candidate | Votes | % | |
|---|---|---|---|---|
| Democratic | Hilda Solis (Incumbent) | 58,530 | 68.8 | |
| Republican | Emma E. Fischbeck | 23,366 | 27.5 | |
| Libertarian | Michael "Mick" McGuire | 3,183 | 3.7 | |
| Total votes | 85,079 | 100.0 | ||
| Democratic hold | ||||
2004
| Party | Candidate | Votes | % | |
|---|---|---|---|---|
| Democratic | Hilda Solis (Incumbent) | 119,144 | 85.1 | |
| Libertarian | Leland Faegre | 21,002 | 14.9 | |
| Total votes | 140,146 | 100.0 | ||
| Democratic hold | ||||
2006
| Party | Candidate | Votes | % | |
|---|---|---|---|---|
| Democratic | Hilda Solis (Incumbent) | 76,059 | 83.0 | |
| Libertarian | Leland Faegre | 21,002 | 17.0 | |
| Total votes | 97,061 | 100.0 | ||
| Democratic hold | ||||
2008
| Party | Candidate | Votes | % | |
|---|---|---|---|---|
| Democratic | Hilda Solis (Incumbent) | 130,142 | 100.0 | |
| Independent | Innocent Osunwa (write-in) | 8 | 0.0 | |
| Total votes | 130,150 | 100.0 | ||
| Turnout | {{{votes}}} | 53.6 | ||
| Democratic hold | ||||
2009 (Special)
| Party | Candidate | Votes | % | |
|---|---|---|---|---|
| Democratic | Judy Chu | 16,194 | 61.8 | |
| Republican | Betty Tom Chu | 8,630 | 33.0 | |
| Libertarian | Christopher Agrella | 1,356 | 5.2 | |
| Independent | Eleanor Garcia (write-in) | 2 | 0.0 | |
| Invalid or blank votes | 1,240 | 4.7 | ||
| Total votes | 26,182 | 100.0 | ||
| Turnout | {{{votes}}} | 10.7 | ||
| Democratic hold | ||||
2010
| Party | Candidate | Votes | % | |
|---|---|---|---|---|
| Democratic | Judy Chu (Incumbent) | 77,759 | 71.0 | |
| Republican | Edward Schmerling | 31,697 | 29.0 | |
| Total votes | 109,456 | 100.0 | ||
| Democratic hold | ||||
2012
| Party | Candidate | Votes | % | |
|---|---|---|---|---|
| Democratic | Grace Napolitano (Incumbent) | 124,903 | 65.7 | |
| Republican | David L. Miller | 65,208 | 34.3 | |
| Total votes | 190,111 | 100.0 | ||
| Democratic hold | ||||
2014
| Party | Candidate | Votes | % | |
|---|---|---|---|---|
| Democratic | Grace Napolitano (Incumbent) | 50,353 | 59.7 | |
| Republican | Arturo Enrique Alas | 34,053 | 40.3 | |
| Total votes | 84,406 | 100.0 | ||
| Democratic hold | ||||
2016
| Party | Candidate | Votes | % | |
|---|---|---|---|---|
| Democratic | Grace Napolitano (Incumbent) | 114,926 | 61.6 | |
| Democratic | Roger Hernández | 71,720 | 38.4 | |
| Total votes | 186,464 | 100.0 | ||
| Democratic hold | ||||
2018
| Party | Candidate | Votes | % | |
|---|---|---|---|---|
| Democratic | Grace Napolitano (Incumbent) | 121,759 | 68.8 | |
| Republican | Joshua Scott | 55,272 | 31.2 | |
| Total votes | 177,031 | 100.0 | ||
| Democratic hold | ||||
2020
| Party | Candidate | Votes | % | |
|---|---|---|---|---|
| Democratic | Grace Napolitano (incumbent) | 172,942 | 66.6 | |
| Republican | Joshua M. Scott | 86,818 | 33.4 | |
| Total votes | 259,760 | 100.0 | ||
| Democratic hold | ||||
2022
| Party | Candidate | Votes | % | |
|---|---|---|---|---|
| Democratic | Brad Sherman (incumbent) | 167,411 | 69.2 | |
| Republican | Lucie Lapointe Volotzky | 74,618 | 30.8 | |
| Total votes | 242,029 | 100.0 | ||
| Democratic hold | ||||
Historical district boundaries
From 2003 through 2013, the district consisted of parts of eastern Los Angeles, including Covina, Baldwin Park and El Monte. Due to redistricting after the 2010 United States census, the district moved slightly south within Los Angeles County but still includes most of the previous areas.
References
- US Census
- "2022 Cook PVI: District Map and List". Cook Political Report. Retrieved January 10, 2023.
- Statement of Vote (1990 Governor)
- Statement of Vote (1992 President)
- Statement of Vote (1992 Senate)
- Statement of Vote (1992 Senate)
- Statement of Vote (1994 Governor)
- Statement of Vote (1994 Senate)
- Statement of Vote (1996 President)
- Statement of Vote (1998 Governor) Archived September 29, 2011, at the Wayback Machine
- Statement of Vote (1998 Senate) Archived September 29, 2011, at the Wayback Machine
- Statement of Vote (2000 President)
- Statement of Vote (2000 Senator)
- Statement of Vote (2002 Governor)
- Statement of Vote (2003 Recall Question)
- Statement of Vote (2003 Governor)
- Statement of Vote (2004 President)
- Statement of Vote (2004 Senator)
- Statement of Vote (2006 Governor)
- Statement of Vote (2006 Senator)
- Statement of Vote (2008 President)
- Statement of Vote (2010 Governor)
- Statement of Vote (2010 Senator)
- Statement of Vote (2012 President)
- Statement of Vote (2012 Senator)
- Statement of Vote (2014 Governor)
- Statement of Vote (2016 President)
- Statement of Vote (2016 Senator)
- Statement of Vote (2018 Governor)
- Statement of Vote (2018 Senator)
- "Daily Kos Elections' presidential results by congressional district for 2020, 2016, and 2012".
- Statement of Vote (2021 Governor Recall)
- "Counties by Congressional Districts for Governor" (PDF). sos.ca.gov. November 8, 2022. Retrieved May 4, 2023.
- "1962 election results" (PDF). Clerk.house.gov. Retrieved May 21, 2018.
- "1964 election results" (PDF). Clerk.house.gov. Retrieved May 21, 2018.
- "1966 election results" (PDF). Clerk.house.gov. Retrieved May 21, 2018.
- "1968 election results" (PDF). Clerk.house.gov. Retrieved May 21, 2018.
- "1970 election results" (PDF). Clerk.house.gov. Retrieved May 21, 2018.
- "1972 election results" (PDF). Clerk.house.gov. Retrieved May 21, 2018.
- "1974 election results" (PDF). Clerk.house.gov. Retrieved May 21, 2018.
- "1976 election results" (PDF). Clerk.house.gov. Retrieved May 21, 2018.
- "1978 election results" (PDF). Clerk.house.gov. Retrieved May 21, 2018.
- "1980 election results" (PDF). Clerk.house.gov. Retrieved May 21, 2018.
- "1982 election results" (PDF). Clerk.house.gov. Retrieved May 21, 2018.
- "1984 election results" (PDF). Clerk.house.gov. Retrieved May 21, 2018.
- "1986 election results" (PDF). Clerk.house.gov. Retrieved May 21, 2018.
- "1988 election results" (PDF). Clerk.house.gov. Retrieved May 21, 2018.
- "1990 election results" (PDF). Clerk.house.gov. Retrieved May 21, 2018.
- "1992 election results" (PDF). Clerk.house.gov. Retrieved May 21, 2018.
- "1994 election results" (PDF). Clerk.house.gov. Retrieved May 21, 2018.
- "1996 election results" (PDF). Clerk.house.gov. Retrieved May 21, 2018.
- "1998 election results" (PDF). Clerk.house.gov. Retrieved May 21, 2018.
- "2000 election results" (PDF). Clerk.house.gov. Retrieved May 21, 2018.
- 2001 Special Election Results
- 2002 election results
- 2004 election results
- 2006 election results
- 2008 election results
- 2009 special election results
- 2010 election results
- 2012 election results
- 2014 election results
- 2016 election results
- 2018 election results