California's 15th congressional district
California's 15th congressional district is a congressional district in the U.S. state of California. The district is currently represented by Democrat Kevin Mullin.
| California's 15th congressional district | |||
|---|---|---|---|
Interactive map of district boundaries since 2023 (Used in the 2022 elections) | |||
| Representative |
| ||
| Population (2022) | 719,254 | ||
| Median household income | $135,162[1] | ||
| Ethnicity |
| ||
| Cook PVI | D+28[2] | ||
.svg.png.webp)
Currently, the district includes most of San Mateo County and the southeast side of San Francisco. Cities in the district include Daly City, South San Francisco, San Bruno, Millbrae, Burlingame, Hillsborough, San Mateo, Foster City, San Carlos, Belmont, Redwood City and East Palo Alto.[3]
Prior to the 2022 United States House of Representatives elections, the district covered most of eastern and southwestern Alameda County as well as part of Contra Costa County. Cities and CDPs in the district included Castro Valley, Dublin, Hayward, Livermore, Pleasanton, Sunol, and Union City; most of San Ramon; and parts of Danville and Fremont. The new 15th district roughly corresponds to the old 14th district and vice versa.
Election results from statewide races
| Year | U.S. President | U.S. Senator (Class 1) | U.S. Senator (Class 3) | Governor |
|---|---|---|---|---|
| 1992 | Clinton 46.3 – 30.3% | Feinstein 59.3 – 33.4% | Boxer 51.1 – 38.3% | |
| 1994 | Feinstein 52.3 – 39.2% | Wilson 51.3 – 43.3% | ||
| 1996 | Clinton 52.7 – 35.2% | |||
| 1998 | Boxer 54.5 – 41.3% | Davis 60.8 – 35% | ||
| 2000 | Gore 56.7 – 37.8%[4] | Feinstein 54.6 – 39.8%[5] | ||
| 2002 | Davis 55.0 – 33.4%[6] | |||
| 2003 | Recall: | |||
| Schwarzenegger 40.8 – 37.2% | ||||
| 2004 | Kerry 62.9 – 35.9%[9] | Boxer 64.9 – 30.8%[10] | ||
| 2006 | Feinstein 68.5 – 26.2%[11] | Schwarzenegger 53.6 – 41.3%[12] | ||
| 2008 | Obama 68.4 – 29.7% [13] | |||
| 2010 | Boxer 61.8 – 33.0% | Brown 59.8 – 36.2% | ||
| 2012 | Obama 68.0 – 29.8% | Feinstein 70.7 – 29.3% | ||
| 2014 | Brown 69.7 – 30.3% | |||
| 2016 | Clinton 69.9 – 24.4% | Harris 69.8 – 30.2% | ||
| 2018 | Feinstein 57.3 – 42.7% | Newsom 69 – 31% | ||
| 2020 | Biden 71.5 – 26.4% | |||
| 2021 | Recall: | |||
| 2022 | Padilla 75.5 – 24.5% | Newsom 76.6 – 23.4% |
Composition
| # | County | Seat | Population |
|---|---|---|---|
| 81 | San Mateo | Redwood City | 737,888 |
As of the 2020 redistricting, California's 15th congressional district is part of the San Francisco Bay Area. It encompasses the east coast of San Mateo County, which is split between this district and the 16th district. They are partitioned by the San Francisquito Creek, Menalto Ave, Willow Rd, S Perimeter Rd, W Perimeter Rd, Bay Rd, Marsh Rd, Middlefield Rd, Highway 82, Highway 84, Alameda de las Pulgas, Woodhill Dr, Farm Hill Blvd, The Loop Rd, Jefferson Ave, Summit Way, California Way, Junipero Serra Freeway, and Highway 35. The 15th district takes in the cities of San Mateo, Daly City, South San Francisco, Redwood City, Burlingame, San Bruno, Millbrae, East Palo Alto, San Carlos, Foster City, and Belmont, the town of Hillsborough, as well as the census designated place North Fair Oaks.
Along with San Mateo County, the 15th district also takes in the San Francisco neighborhoods of Crocker Amazon, Excelsior, Little Hollywood, Mission Terrace, Oceanview, Outer Mission, Portola, and Visitacion Valley.
Cities & CDP with 10,000 or more people
- San Mateo - 105,661
- Daly City - 104,901
- Redwood City - 84,292
- South San Francisco - 66,105
- San Bruno - 43,908
- Foster City - 33,805
- Burlingame - 31,386
- San Carlos - 30,722
- East Palo Alto - 30,034
- Belmont - 28,335
- Millbrae - 23,216
- North Fair Oaks - 14,027
- Hillsborough - 11,387
List of members representing the district
| Member | Party | Dates | Cong ress |
Electoral history | Counties |
|---|---|---|---|---|---|
| District created March 4, 1933 | |||||
 William I. Traeger (Los Angeles) |
Republican | March 4, 1933 – January 3, 1935 |
73rd | Elected in 1932. Lost re-election. |
1933–1963 Los Angeles |
 John M. Costello (Los Angeles) |
Democratic | January 3, 1935 – January 3, 1945 |
74th 75th 76th 77th 78th |
Elected in 1934. Re-elected in 1936. Re-elected in 1938. Re-elected in 1940. Re-elected in 1942. Lost renomination. | |
.jpg.webp) Gordon L. McDonough (Los Angeles) |
Republican | January 3, 1945 – January 3, 1963 |
79th 80th 81st 82nd 83rd 84th 85th 86th 87th |
Elected in 1944. Re-elected in 1946. Re-elected in 1948. Re-elected in 1950. Re-elected in 1952. Re-elected in 1954. Re-elected in 1956. Re-elected in 1958. Re-elected in 1960. Lost re-election. | |
 John J. McFall (Manteca) |
Democratic | January 3, 1963 – January 3, 1975 |
88th 89th 90th 91st 92nd 93rd |
Redistricted from the 11th district and re-elected in 1962. Re-elected in 1964. Re-elected in 1966. Re-elected in 1968. Re-elected in 1970. Re-elected in 1972. Redistricted to the 14th district. |
1963–1967 San Joaquin, Stanislaus |
| 1967–1973 Northeastern Merced, San Joaquin, Stanislaus | |||||
| 1973–1975 Eastern Sacramento, San Joaquin, Stanislaus | |||||
 Bernice F. Sisk (Fresno) |
Democratic | January 3, 1975 – January 3, 1979 |
94th 95th |
Redistricted from the 16th district and re-elected in 1974. Re-elected in 1976. |
1975–1983 Western Fresno, Madera, Mariposa, Merced, Stanislaus |
 Tony Coelho (Merced) |
Democratic | January 3, 1979 – June 15, 1989 |
96th 97th 98th 99th 100th 101st |
Elected in 1978. Re-elected in 1980. Re-elected in 1982. Re-elected in 1984. Re-elected in 1986. Re-elected in 1988. Resigned. | |
| 1983–1993 Western Fresno, Mariposa, Merced, Stanislaus | |||||
| Vacant | June 15, 1989 – September 12, 1989 |
101st | |||
 Gary Condit (Ceres) |
Democratic | September 12, 1989 – January 3, 1993 |
101st 102nd |
Elected to finish Coelho's term. Re-elected in 1990. Redistricted to the 18th district. | |
 Norman Mineta (San Jose) |
Democratic | January 3, 1993 – October 10, 1995 |
103rd 104th |
Redistricted from the 13th district and re-elected in 1992. Re-elected in 1994. Resigned to accept a position with Lockheed Martin. |
1993–2003 Western Santa Clara, northern Santa Cruz |
| Vacant | October 10, 1995 – December 12, 1995 |
104th | |||
 Tom Campbell (Campbell) |
Republican | December 12, 1995 – January 3, 2001 |
104th 105th 106th |
Elected to finish Mineta's term. Re-elected in 1996. Re-elected in 1998. Retired to run for U.S. Senator. | |
 Mike Honda (San Jose) |
Democratic | January 3, 2001 – January 3, 2013 |
107th 108th 109th 110th 111th 112th |
Elected in 2000. Re-elected in 2002. Re-elected in 2004. Re-elected in 2006. Re-elected in 2008. Re-elected in 2010. Redistricted to the 17th district. | |
2003–2013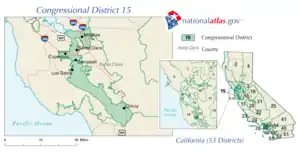 Western/northwestern Santa Clara | |||||
 Eric Swalwell (Dublin) |
Democratic | January 3, 2013 – January 3, 2023 |
113th 114th 115th 116th 117th |
Elected in 2012. Re-elected in 2014. Re-elected in 2016. Re-elected in 2018. Re-elected in 2020. Redistricted to the 14th district. |
2013–2023.tif.png.webp) Eastern/southern Alameda, southern Contra Costa |
 Kevin Mullin (South San Francisco) |
Democratic | January 3, 2023 – present |
118th | Elected in 2022. | 2023–present_(new_version).svg.png.webp) Eastern San Mateo, southern San Francisco |
Election results
1932
| Party | Candidate | Votes | % | ||
|---|---|---|---|---|---|
| Republican | William I. Traeger | 67,390 | 52.8 | ||
| Democratic | John M. Costello | 57,518 | 45.1 | ||
| No party | Errol Shour (write-in) | 2,721 | 2.1 | ||
| Total votes | 127,663 | 100.0 | |||
| Turnout | {{{votes}}} | ||||
| Republican win (new seat) | |||||
1934
| Party | Candidate | Votes | % | |||
|---|---|---|---|---|---|---|
| Democratic | John M. Costello | 67,247 | 50.5 | |||
| Republican | William I. Traeger (Incumbent) | 65,858 | 49.5 | |||
| Total votes | 133,161 | 100.0 | ||||
| Turnout | {{{votes}}} | |||||
| Democratic gain from Republican | ||||||
1936
| Party | Candidate | Votes | % | |
|---|---|---|---|---|
| Democratic | John M. Costello (Incumbent) | 99,107 | 69.0 | |
| Republican | Ernest Sawyer | 44,559 | 31.0 | |
| Total votes | 143,718 | 100.0 | ||
| Turnout | {{{votes}}} | |||
| Democratic hold | ||||
1938
| Party | Candidate | Votes | % | |
|---|---|---|---|---|
| Democratic | John M. Costello (Incumbent) | 83,086 | 60.1 | |
| Republican | O. D. Thomas | 51,483 | 37.3 | |
| Communist | Emil Freed | 2,951 | 2.1 | |
| Total votes | 138,132 | 100.0 | ||
| Turnout | {{{votes}}} | |||
| Democratic hold | ||||
1940
| Party | Candidate | Votes | % | |
|---|---|---|---|---|
| Democratic | John M. Costello (Incumbent) | 94,435 | 56.2 | |
| Republican | Norris Nelson | 71,667 | 42.6 | |
| Communist | Emil Freed | 2,004 | 1.2 | |
| Total votes | 168,155 | 100.0 | ||
| Turnout | {{{votes}}} | |||
| Democratic hold | ||||
1942
| Party | Candidate | Votes | % | |
|---|---|---|---|---|
| Democratic | John M. Costello (Incumbent) | 88,798 | 86.1 | |
| Prohibition | B. Tarkington Dowden | 10,185 | 9.9 | |
| Communist | Philip Gardner | 3,989 | 3.9 | |
| Total votes | 103,094 | 100.0 | ||
| Turnout | {{{votes}}} | |||
| Democratic hold | ||||
1944
| Party | Candidate | Votes | % | |||
|---|---|---|---|---|---|---|
| Republican | Gordon L. McDonough | 100,305 | 56.6 | |||
| Democratic | Hal Styles | 73,655 | 41.6 | |||
| Prohibition | Johannes Nielson-Lange | 2,694 | 1.5 | |||
| Total votes | 177,081 | 100.0 | ||||
| Turnout | {{{votes}}} | |||||
| Republican gain from Democratic | ||||||
1946
| Party | Candidate | Votes | % | |
|---|---|---|---|---|
| Republican | Gordon L. McDonough (Incumbent) | 106,020 | 99.4 | |
| Turnout | 106,628 | |||
| Republican hold | ||||
1948
| Party | Candidate | Votes | % | |
|---|---|---|---|---|
| Republican | Gordon L. McDonough (Incumbent) | 131,933 | 83.0 | |
| Progressive | Maynard Omerberg | 27,007 | 17.0 | |
| Total votes | 159,031 | 100.0 | ||
| Turnout | {{{votes}}} | |||
| Republican hold | ||||
1950
| Party | Candidate | Votes | % | |
|---|---|---|---|---|
| Republican | Gordon L. McDonough (Incumbent) | 112,704 | 87.1 | |
| Progressive | Jeanne Cole | 16,559 | 12.8 | |
| Total votes | 129,352 | 100.0 | ||
| Turnout | {{{votes}}} | |||
| Republican hold | ||||
1952
| Party | Candidate | Votes | % | |
|---|---|---|---|---|
| Republican | Gordon L. McDonough (Incumbent) | 142,545 | 99.7 | |
| Turnout | 142,932 | |||
| Republican hold | ||||
1954
| Party | Candidate | Votes | % | |
|---|---|---|---|---|
| Republican | Gordon L. McDonough (Incumbent) | 77,651 | 56.9 | |
| Democratic | Frank O'Sullivan | 58,785 | 43.1 | |
| Total votes | 136,445 | 100.0 | ||
| Turnout | {{{votes}}} | |||
| Republican hold | ||||
1956
| Party | Candidate | Votes | % | |
|---|---|---|---|---|
| Republican | Gordon L. McDonough (Incumbent) | 97,182 | 57.9 | |
| Democratic | Emery Petty | 70,681 | 42.1 | |
| Total votes | 167,865 | 100.0 | ||
| Turnout | {{{votes}}} | |||
| Republican hold | ||||
1958
| Party | Candidate | Votes | % | |
|---|---|---|---|---|
| Republican | Gordon L. McDonough (Incumbent) | 77,267 | 52.0 | |
| Democratic | Emery Petty | 71,192 | 48.0 | |
| Total votes | 148,482 | 100.0 | ||
| Turnout | {{{votes}}} | |||
| Republican hold | ||||
1960
| Party | Candidate | Votes | % | |
|---|---|---|---|---|
| Republican | Gordon L. McDonough (Incumbent) | 89,234 | 51.3 | |
| Democratic | Norman Martell | 84,650 | 48.5 | |
| Total votes | 174,035 | 100.0 | ||
| Turnout | {{{votes}}} | |||
| Republican hold | ||||
1962
| Party | Candidate | Votes | % | |
|---|---|---|---|---|
| Democratic | John J. McFall (Incumbent) | 97,322 | 70 | |
| Republican | Clifford B. Bull | 41,726 | 30 | |
| Total votes | 139,048 | 100 | ||
| Turnout | ||||
| Democratic hold | ||||
1964
| Party | Candidate | Votes | % | |
|---|---|---|---|---|
| Democratic | John J. McFall (Incumbent) | 109,560 | 70.9 | |
| Republican | Kenneth Gibson | 44,977 | 29.1 | |
| Total votes | 154,537 | 100.0 | ||
| Turnout | ||||
| Democratic hold | ||||
1966
| Party | Candidate | Votes | % | |
|---|---|---|---|---|
| Democratic | John J. McFall (Incumbent) | 81,733 | 57 | |
| Republican | Sam Van Dyken | 61,550 | 43 | |
| Total votes | 143,283 | 100 | ||
| Turnout | ||||
| Democratic hold | ||||
1968
| Party | Candidate | Votes | % | |
|---|---|---|---|---|
| Democratic | John J. McFall (Incumbent) | 85,761 | 53.8 | |
| Republican | Sam Van Dyken | 73,685 | 46.2 | |
| Total votes | 159,446 | 100.0 | ||
| Turnout | ||||
| Democratic hold | ||||
1970
| Party | Candidate | Votes | % | |
|---|---|---|---|---|
| Democratic | John J. McFall (Incumbent) | 98,442 | 63.1 | |
| Republican | Sam Van Dyken | 55,546 | 35.6 | |
| American Independent | Francis E. "Gill" Gillings | 1,994 | 1.3 | |
| Total votes | 155,982 | 100.0 | ||
| Turnout | ||||
| Democratic hold | ||||
1972
| Party | Candidate | Votes | % | |
|---|---|---|---|---|
| Democratic | John J. McFall (Incumbent) | 145,273 | 100.0 | |
| Turnout | ||||
| Democratic hold | ||||
1974
| Party | Candidate | Votes | % | |
|---|---|---|---|---|
| Democratic | Bernice F. Sisk (Incumbent) | 80,205 | 72 | |
| Republican | Carol Harner | 31,361 | 28 | |
| Total votes | 111,566 | 100 | ||
| Turnout | ||||
| Democratic hold | ||||
1976
| Party | Candidate | Votes | % | |
|---|---|---|---|---|
| Democratic | Bernice F. Sisk (Incumbent) | 92,735 | 72.2 | |
| Republican | Carol Harner | 35,700 | 27.8 | |
| Total votes | 128,435 | 100.0 | ||
| Turnout | ||||
| Democratic hold | ||||
1978
| Party | Candidate | Votes | % | |
|---|---|---|---|---|
| Democratic | Tony Coelho | 75,212 | 60.1 | |
| Republican | Chris Patterakis | 49,914 | 39.9 | |
| Total votes | 125,126 | 100.0 | ||
| Turnout | ||||
| Democratic hold | ||||
1980
| Party | Candidate | Votes | % | |
|---|---|---|---|---|
| Democratic | Tony Coelho (Incumbent) | 108,072 | 71.8 | |
| Republican | Ron Schwartz | 37,895 | 25.2 | |
| Libertarian | Michael L. Pullen | 4,524 | 3.0 | |
| Total votes | 150,491 | 100.0 | ||
| Turnout | ||||
| Democratic hold | ||||
1982
| Party | Candidate | Votes | % | |
|---|---|---|---|---|
| Democratic | Tony Coelho (Incumbent) | 86,022 | 63.7 | |
| Republican | Ed Bates | 45,948 | 34.0 | |
| Libertarian | Stephen L. Gerringer | 3,073 | 2.3 | |
| Total votes | 135,043 | 100.0 | ||
| Turnout | {{{votes}}} | |||
| Democratic hold | ||||
1984
| Party | Candidate | Votes | % | |
|---|---|---|---|---|
| Democratic | Tony Coelho (Incumbent) | 109,590 | 65.5 | |
| Republican | Carol Harner | 54,730 | 32.7 | |
| Libertarian | Richard M. Harris | 3,086 | 1.8 | |
| Total votes | 167,406 | 100.0 | ||
| Turnout | {{{votes}}} | |||
| Democratic hold | ||||
1986
| Party | Candidate | Votes | % | |
|---|---|---|---|---|
| Democratic | Tony Coelho (Incumbent) | 93,600 | 71.0 | |
| Republican | Carol Harner | 35,793 | 27.2 | |
| Libertarian | Richard M. Harris | 2,382 | 1.8 | |
| Total votes | 131,775 | 100.0 | ||
| Turnout | {{{votes}}} | |||
| Democratic hold | ||||
1988
| Party | Candidate | Votes | % | |
|---|---|---|---|---|
| Democratic | Tony Coelho (Incumbent) | 118,710 | 69.8 | |
| Republican | Carol Harner | 47,957 | 28.2 | |
| Libertarian | Richard M. Harris | 3,526 | 2.1 | |
| Total votes | 170,193 | 100.0 | ||
| Total votes | 70,753 | 41.6 | ||
| Turnout | {{{votes}}} | |||
| Democratic hold | ||||
1989 (Special)
| Party | Candidate | Votes | % | |
|---|---|---|---|---|
| Democratic | Gary Condit | 57.1 | ||
| Republican | Claire L. Berryhill | 35.0 | ||
| Republican | Robert J. Weimer | 3.3 | ||
| Republican | Cliff Burris | 2.6 | ||
| Libertarian | Roy Shrimp | 0.9 | ||
| Republican | Chris Patterakis | 0.4 | ||
| Republican | David M. "Dave" Williams | 0.4 | ||
| Republican | Jack E. McCoy | 0.2 | ||
| Total votes | 100.0 | |||
| Turnout | {{{votes}}} | |||
| Democratic hold | ||||
1990
| Party | Candidate | Votes | % | |
|---|---|---|---|---|
| Democratic | Gary Condit (Incumbent) | 97,147 | 66.2 | |
| Republican | Cliff Burris | 49,634 | 33.8 | |
| Total votes | 146,781 | 100.0 | ||
| Turnout | {{{votes}}} | |||
| Democratic hold | ||||
1992
| Party | Candidate | Votes | % | |
|---|---|---|---|---|
| Democratic | Norm Mineta (Incumbent) | 168,617 | 63.5 | |
| Republican | Robert Wick | 82,875 | 31.2 | |
| Libertarian | Duggan Dieterly | 13,293 | 5.0 | |
| No party | Futrell (write-in) | 585 | 0.2 | |
| Total votes | 265,370 | 100.0 | ||
| Turnout | {{{votes}}} | |||
| Democratic hold | ||||
1994
| Party | Candidate | Votes | % | |
|---|---|---|---|---|
| Democratic | Norm Mineta (Incumbent) | 119,921 | 59.90 | |
| Republican | Robert Wick | 80,266 | 40.09 | |
| No party | Liu (write-in) | 17 | 0.01 | |
| Total votes | 200,204 | 100.0 | ||
| Turnout | {{{votes}}} | |||
| Democratic hold | ||||
1995 (Special)
| Party | Candidate | Votes | % | |||
|---|---|---|---|---|---|---|
| Republican | Tom Campbell | 54,372 | 58.85 | |||
| Democratic | Jerry Estruth | 33,051 | 35.77 | |||
| Independent | Linh Kieu Dao | 4,922 | 5.33 | |||
| Reform | Connor Vlakancic (write-in) | 42 | 0.05 | |||
| Total votes | 92,387 | 100.00 | ||||
| Turnout | {{{votes}}} | |||||
| Republican gain from Democratic | ||||||
1996
| Party | Candidate | Votes | % | |
|---|---|---|---|---|
| Republican | Tom Campbell (Incumbent) | 132,737 | 58.6 | |
| Democratic | Dick Lane | 79,048 | 34.9 | |
| Reform | Valli Sharpe-Geisler | 6,230 | 2.7 | |
| Libertarian | Ed Wimmers | 5,481 | 2.4 | |
| Natural Law | Bruce Currivan | 3,372 | 1.4 | |
| Republican | Linh Dao (write-in) | 9 | 0.0 | |
| Republican | Connor Vlakancic (write-in) | 9 | 0.0 | |
| Total votes | 226,886 | 100.0 | ||
| Turnout | {{{votes}}} | |||
| Republican hold | ||||
1998
| Party | Candidate | Votes | % | |
|---|---|---|---|---|
| Republican | Tom Campbell (Incumbent) | 111,876 | 60.54 | |
| Democratic | Dick Lane | 70,059 | 37.91 | |
| Natural Law | Frank Strutner | 2,843 | 1.54 | |
| Republican | Constant Vlakancic (write-in) | 8 | 0.00 | |
| Total votes | 184,786 | 100.0 | ||
| Turnout | {{{votes}}} | |||
| Republican hold | ||||
2000
| Party | Candidate | Votes | % | |||
|---|---|---|---|---|---|---|
| Democratic | Mike Honda | 128,545 | 54.3 | |||
| Republican | Jim Cunneen | 99,866 | 42.2 | |||
| Libertarian | Ed Wimmers | 4,820 | 2.0 | |||
| Natural Law | Douglas C. Gorney | 3,591 | 1.5 | |||
| No party | Phillip Kronzer (write-in) | 82 | 0.0 | |||
| Total votes | 236,904 | 100.0 | ||||
| Turnout | ||||||
| Democratic gain from Republican | ||||||
2002
| Party | Candidate | Votes | % | |
|---|---|---|---|---|
| Democratic | Mike Honda (Incumbent) | 87,482 | 65.8 | |
| Republican | Linda Rae Hermann | 41,251 | 31.0 | |
| Libertarian | Jeff Landauer | 4,289 | 3.2 | |
| Total votes | 133,022 | 100.0 | ||
| Turnout | {{{votes}}} | |||
| Democratic hold | ||||
2004
| Party | Candidate | Votes | % | |
|---|---|---|---|---|
| Democratic | Mike Honda (Incumbent) | 154,385 | 72.1 | |
| Republican | Raymond Chukwu | 59,953 | 27.9 | |
| Total votes | 214,338 | 100.0 | ||
| Turnout | {{{votes}}} | |||
| Democratic hold | ||||
2006
| Party | Candidate | Votes | % | |
|---|---|---|---|---|
| Democratic | Mike Honda (Incumbent) | 115,532 | 72.4 | |
| Republican | Raymond Chukwu | 44,186 | 27.6 | |
| Total votes | 186,718 | 100.0 | ||
| Turnout | {{{votes}}} | |||
| Democratic hold | ||||
2008
| Party | Candidate | Votes | % | |
|---|---|---|---|---|
| Democratic | Mike Honda (Incumbent) | 170,977 | 71.66 | |
| Republican | Joyce Stoer Cordi | 55,489 | 23.26 | |
| Green | Peter Myers | 12,123 | 5.08 | |
| Total votes | 238,589 | 100.0 | ||
| Turnout | {{{votes}}} | |||
| Democratic hold | ||||
2010
| Party | Candidate | Votes | % | |
|---|---|---|---|---|
| Democratic | Mike Honda (Incumbent) | 126,147 | 67.60 | |
| Republican | Scott Kirkland | 60,468 | 32.40 | |
| Total votes | 186,615 | 100.00 | ||
| Turnout | {{{votes}}} | |||
| Democratic hold | ||||
2012
| Party | Candidate | Votes | % | |
|---|---|---|---|---|
| Democratic | Eric Swalwell | 120,388 | 52.1 | |
| Democratic | Pete Stark (Incumbent) | 110,646 | 47.9 | |
| Total votes | 231,034 | 100.00 | ||
| Democratic hold | ||||
2014
| Party | Candidate | Votes | % | |
|---|---|---|---|---|
| Democratic | Eric Swalwell (Incumbent) | 99,756 | 69.8 | |
| Republican | Hugh Bussell | 43,150 | 30.2 | |
| Total votes | 142,906 | 100.00 | ||
| Democratic hold | ||||
2016
| Party | Candidate | Votes | % | |
|---|---|---|---|---|
| Democratic | Eric Swalwell (Incumbent) | 198,578 | 73.8 | |
| Republican | Danny R. Turner | 70,619 | 26.2 | |
| Total votes | 269,197 | 100 | ||
| Democratic hold | ||||
2018
| Party | Candidate | Votes | % | |
|---|---|---|---|---|
| Democratic | Eric Swalwell (Incumbent) | 177,989 | 73.0 | |
| Republican | Rudy L. Peters Jr. | 65,940 | 27.0 | |
| Total votes | 243,929 | 100 | ||
| Democratic hold | ||||
2020
| Party | Candidate | Votes | % | |
|---|---|---|---|---|
| Democratic | Eric Swalwell (incumbent) | 242,991 | 70.9 | |
| Republican | Alison Hayden | 99,710 | 29.1 | |
| Total votes | 342,701 | 100.0 | ||
| Democratic hold | ||||
2022
| Party | Candidate | Votes | % | |
|---|---|---|---|---|
| Democratic | Kevin Mullin | 108,077 | 55.5 | |
| Democratic | David Canepa | 86,797 | 44.5 | |
| Total votes | 194,874 | 100.0 | ||
| Democratic hold | ||||
References
- Center for New Media & Promotion (CNMP). "My Congressional District". US Census Bureau.
- "2022 Cook PVI: District Map and List". Cook Political Report. Retrieved January 10, 2023.
- "CA 2022 Congressional". Dave's Redistricting. January 4, 2022. Retrieved November 11, 2022.
- "Statement of Vote (2000 President)" (PDF). Archived from the original (PDF) on May 20, 2011.
- "Statement of Vote (2000 Senator)" (PDF). Archived from the original (PDF) on May 20, 2011.
- "Statement of Vote (2002 Governor)" (PDF). Archived from the original (PDF) on November 11, 2010.
- "Statement of Vote (2003 Recall Question)" (PDF). Archived from the original (PDF) on May 20, 2011.
- "Statement of Vote (2003 Governor)" (PDF). Archived from the original (PDF) on May 20, 2011.
- "Statement of Vote (2004 President)" (PDF). Archived from the original (PDF) on May 20, 2011.
- "Statement of Vote (2004 Senator)" (PDF). Archived from the original (PDF) on August 10, 2011.
- "Statement of Vote (2006 Senator)" (PDF). Archived from the original (PDF) on August 10, 2011.
- "Statement of Vote (2006 Governor)" (PDF). Archived from the original (PDF) on August 10, 2011.
- "(2008 President)". Archived from the original on February 11, 2009. Retrieved March 5, 2009.
- "Counties by Congressional District for Recall Question" (PDF). sos.ca.gov. September 14, 2021. Retrieved May 2, 2022.
- "1932 election results" (PDF).
- "1934 election results" (PDF).
- "1936 election results" (PDF).
- "1938 election results" (PDF).
- "1940 election results" (PDF).
- "1942 election results" (PDF).
- "1944 election results" (PDF).
- "1946 election results" (PDF).
- "1948 election results" (PDF).
- "1950 election results" (PDF).
- "1952 election results" (PDF).
- "1954 election results" (PDF).
- "1956 election results" (PDF).
- "1958 election results" (PDF).
- "1960 election results" (PDF).
- "1962 election results" (PDF).
- "1964 election results" (PDF).
- "1966 election results" (PDF).
- "1968 election results" (PDF).
- "1970 election results" (PDF).
- "1972 election results" (PDF).
- "1974 election results" (PDF).
- "1976 election results" (PDF).
- "1978 election results" (PDF).
- "1980 election results" (PDF).
- "1982 election results" (PDF).
- "1984 election results" (PDF).
- "1986 election results" (PDF).
- "1988 election results" (PDF).
- "09-12-1989 Election". JoinCalifornia.
- "1990 election results" (PDF).
- "1992 election results" (PDF).
- "1994 election results" (PDF).
- "12-12-1995 Election". JoinCalifornia.
- "1996 election results" (PDF).
- "1998 election results" (PDF).
- "2000 election results" (PDF).
- "2002 election results" (PDF). Archived from the original (PDF) on February 3, 2009.
- "2004 election results" (PDF).
- "2006 election results" (PDF). Archived from the original (PDF) on November 27, 2008.
- "November 4 Presidential Primary Election - SUMMARY RESULTS". County of Santa Clara.
- "November 2, 2010 Gubernatorial General Election - SUMMARY RESULTS". County of Santa Clara.
- "2012 general election results" (PDF). Archived from the original (PDF) on October 19, 2013.
- "House of Representatives District 15 - Districtwide Results". Archived from the original on December 21, 2014. Retrieved December 21, 2014.
- "Statement of Vote - November 8, 2016, General Election" (PDF). California Secretary of State. p. 5. Retrieved January 17, 2019.
- "General Election - Statement of Vote, November 6, 2018 — United States Representative in Congress by District" (PDF). California Secretary of State. p. 5. Retrieved January 17, 2019.