California's 20th congressional district
California's 20th congressional district is a congressional district in California including much of the southern and southeastern part of the state's Central Valley. The district currently has no representative in the United States House of Representatives due to the resignation of Kevin McCarthy following the motion to vacate that ousted him from the office of House Speaker.[3][4]
| California's 20th congressional district | |||
|---|---|---|---|
Interactive map of district boundaries since 2023 (Used in the 2022 elections) | |||
| Representative |
| ||
| Population (2022) | 793,325 | ||
| Median household income | $82,983[1] | ||
| Ethnicity |
| ||
| Cook PVI | R+16[2] | ||
.svg.png.webp)
Redistricting in 2022 returned the district to the San Joaquin Valley. The new 20th district includes parts of Kern, Tulare, Kings, and Fresno counties. It includes the southern Sierra Nevada and western Mojave Desert, with three "fingers" extending west into the valley. Cities in the district include Clovis, Tehachapi, Ridgecrest, Taft, Lemoore, the west and northeast sides of Bakersfield, the south side of Visalia, the northeast side of Tulare, the north side of Hanford, and a sliver of northeastern Fresno including California State University, Fresno.[5] The new 20th district is the most Republican district in California, with a Cook Partisan Voting Index rating of R+16.[2]
Before 2022, it encompassed much of the Central Coast region. The district included Monterey and San Benito counties, most of Santa Cruz County, and portions of Santa Clara County.
Before redistricting in 2011, the 20th district was located in the San Joaquin Valley. It covered Kings County and portions of Fresno and Kern counties, including most of the city of Fresno. That area is now largely divided between the 21st and 16th districts, while most of the current 20th was within the former 17th.
Recent election results in statewide races
| Year | Office | Results |
|---|---|---|
| 1992 | President | Clinton 46.9 – 37.5% |
| Senator | Herschensohn 50.2 – 40.1% | |
| Senator | Feinstein 47.4 – 44.9% | |
| 1994 | Governor | |
| Senator | ||
| 1996 | President | |
| 1998 | Governor | |
| Senator | ||
| 2000 | President[6] | Gore 49.6 – 47.6% |
| Senator[7] | Feinstein 58.4 – 35.0% | |
| 2002 | Governor[8] | Davis 53.1 – 40.6% |
| 2003 | Recall[9][10] | |
| Schwarzenegger 42.7 – 40.4% | ||
| 2004 | President[11] | Kerry 50.6 – 48.5% |
| Senator[12] | Boxer 57.2 – 38.3% | |
| 2006 | Governor[13] | Schwarzenegger 53.7 – 41.5% |
| Senator[14] | Feinstein 60.5 – 33.9% | |
| 2008 | President[15] | Obama 59.6 – 38.7% |
| 2010 | Governor | Brown 55.9 – 37.1% |
| Senator | Boxer 48.3 – 43.5% | |
| 2012 | President | Obama 70.9 – 26.2% |
| Senator | Feinstein 73.1 - 26.9% | |
| 2014 | Governor | Brown 73.0 - 27.0% |
| 2016 | President | Clinton 70.4 – 23.2% |
| Senator | Harris 66.2 - 33.8% | |
| 2018 | Governor | Newsom 70.2 - 29.8% |
| Senator | Feinstein 54.2 - 45.8% | |
| 2020 | President | Biden 72.7 – 25.0% |
| 2021 | Recall[16] | |
| 2022 | Governor[17] | Dahle 69.5 - 30.5% |
| Senator | Meuser 67.7 - 32.3% |
Composition
| # | County | Seat | Population |
|---|---|---|---|
| 19 | Fresno | Fresno | 1,015,190 |
| 29 | Kern | Bakersfield | 916,108 |
| 31 | Kings | Hanford | 152,981 |
| 107 | Tulare | Visalia | 477,433 |
Cities with 10,000 or more people
2,500-10,000 people
- Taft - 9,327
- Golden Hills - 8,656
- Lemoore Station - 7,438
- Alta Sierra - 7,204
- Bear Valley Springs - 5,592
- Greenacres - 5,566
- Ford City - 4,348
- Mojave - 4,238
- Tarpey Village - 3,888
- Lake Isabella - 3,466
- Auberry - 3,238
- Yokuts Valley - 3,162
- Weldon - 2,645
- Frazier Park - 2,592
List of members representing the district
| Member | Party | Dates | Cong ress |
Electoral history | Counties |
|---|---|---|---|---|---|
| District created March 4, 1933 | |||||
 George Burnham (San Diego) |
Republican | March 4, 1933 – January 3, 1937 |
73rd 74th |
Elected in 1932. Re-elected in 1934. Retired. |
1933–1943 Imperial, San Diego |
 Edouard Izac (San Diego) |
Democratic | January 3, 1937 – January 3, 1943 |
75th 76th 77th |
Elected in 1936. Re-elected in 1938. Re-elected in 1940. Redistricted to the 23rd district. | |
 John Carl Hinshaw (Pasadena) |
Republican | January 3, 1943 – August 5, 1956 |
78th 79th 80th 81st 82nd 83rd 84th |
Redistricted from the 11th district and Re-elected in 1942. Re-elected in 1944. Re-elected in 1946. Re-elected in 1948. Re-elected in 1950. Re-elected in 1952. Re-elected in 1954. Died. |
1943–1975 Los Angeles |
| Vacant | August 5, 1956 – January 3, 1957 |
84th | |||
 H. Allen Smith (Glendale) |
Republican | January 3, 1957 – January 3, 1973 |
85th 86th 87th 88th 89th 90th 91st 92nd |
Elected in 1956. Re-elected in 1958. Re-elected in 1960. Re-elected in 1962. Re-elected in 1964. Re-elected in 1966. Re-elected in 1968. Re-elected in 1970. Retired. | |
 Carlos Moorhead (Los Angeles) |
Republican | January 3, 1973 – January 3, 1975 |
93rd | Elected in 1972. Redistricted to the 22nd district. | |
 Barry Goldwater Jr. (Los Angeles) |
Republican | January 3, 1975 – January 3, 1983 |
94th 95th 96th 97th |
Redistricted from the 27th district and Re-elected in 1974. Re-elected in 1976. Re-elected in 1978. Re-elected in 1980. Retired to run for U.S. senator. |
1975–1983 Southwestern Los Angeles, eastern Ventura |
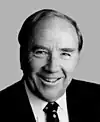
 Bill Thomas (Bakersfield) |
Republican | January 3, 1983 – January 3, 1993 |
98th 99th 100th 101st 102nd |
Redistricted from the 18th district and Re-elected in 1982. Re-elected in 1984. Re-elected in 1986. Re-elected in 1988. Re-elected in 1990. Redistricted to the 21st district. |
1983–1993 Inyo, Kern, Los Angeles (Lancaster), San Luis Obispo |
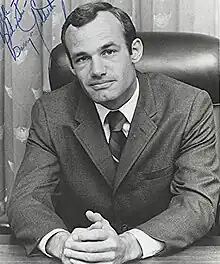
 Cal Dooley (Fresno) |
Democratic | January 3, 1993 – January 3, 2005 |
103rd 104th 105th 106th 107th 108th |
Redistricted from the 17th district and Re-elected in 1992. Re-elected in 1994. Re-elected in 1996. Re-elected in 1998. Re-elected in 2000. Re-elected in 2002. Retired. |
1993–2003 Western Fresno, northwestern Kern, Kings, western Tulare |
2003–2013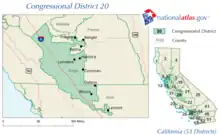 Western Fresno, northwestern Kern, Kings | |||||
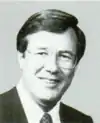
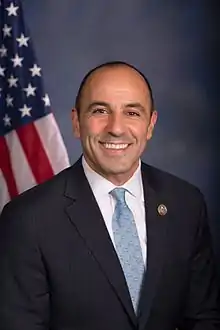
.jpg.webp) Jim Costa (Fresno) |
Democratic | January 3, 2005 – January 3, 2013 |
109th 110th 111th 112th |
Elected in 2004. Re-elected in 2006. Re-elected in 2008. Re-elected in 2010. Redistricted to the 16th district. | |
 Sam Farr (Carmel) |
Democratic | January 3, 2013 – January 3, 2017 |
113th 114th |
Redistricted from the 17th district and re-elected in 2012. Re-elected in 2014. Retired. |
2013–2023.tif.png.webp) Monterey and San Benito, and portions of Santa Clara and Santa Cruz |
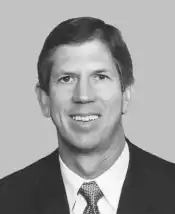
 Jimmy Panetta (Carmel Valley) |
Democratic | January 3, 2017 – January 3, 2023 |
115th 116th 117th |
Elected in 2016. Re-elected in 2018. Re-elected in 2020. Redistricted to the 19th district. | |
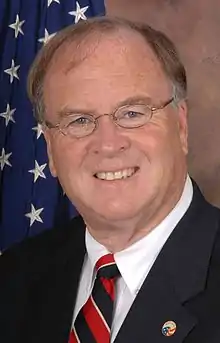
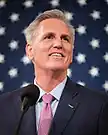 Kevin McCarthy (Bakersfield) |
Republican | January 3, 2023 – December 31, 2023 |
118th | Redistricted from the 23rd district and re-elected in 2022. Resigned. |
2023–present_(new_version).svg.png.webp) Parts of the southern San Joaquin Valley, the Tehachapi Mountains and southern Sierra Nevada, and the northwestern Mojave Desert |
| Vacant | December 31, 2023 – present |
New member to be elected in 2024 to finish the term. | |||
Election results
1932
| Party | Candidate | Votes | % | |
|---|---|---|---|---|
| Republican | George Burnham | 43,757 | 50.3 | |
| Democratic | Claude Chandler | 43,304 | 49.7 | |
| Total votes | 87,061 | 100.0 | ||
| Republican hold | ||||
1934
| Party | Candidate | Votes | % | |
|---|---|---|---|---|
| Republican | George Burnham (Incumbent) | 51,682 | 52.4 | |
| Democratic | Edouard Izac | 46,957 | 47.6 | |
| Total votes | 98,639 | 100.0 | ||
| Republican hold | ||||
1936
| Party | Candidate | Votes | % | |||
|---|---|---|---|---|---|---|
| Democratic | Edouard Izac | 59,208 | 56.4 | |||
| Republican | Ed P. Simple | 44,925 | 42.8 | |||
| Communist | Esco L. Richardson | 916 | 0.8 | |||
| Total votes | 105,049 | 100.0 | ||||
| Democratic gain from Republican | ||||||
1938
| Party | Candidate | Votes | % | |
|---|---|---|---|---|
| Democratic | Edouard Izac (Incumbent) | 65,243 | 60.4 | |
| Republican | John L. Bacon | 42,710 | 39.6 | |
| Total votes | 107,953 | 100.0 | ||
| Democratic hold | ||||
1940
| Party | Candidate | Votes | % | |
|---|---|---|---|---|
| Democratic | Edouard Izac (Incumbent) | 69,874 | 51.1 | |
| Republican | John L. Bacon | 66,132 | 48.3 | |
| Communist | Esco L. Richardson | 806 | 0.6 | |
| Total votes | 136,812 | 100.0 | ||
| Democratic hold | ||||
1942
| Party | Candidate | Votes | % | |||
|---|---|---|---|---|---|---|
| Republican | John Carl Hinshaw | 62,628 | 48.4 | |||
| Democratic | Joseph O. Donovan | 55,479 | 42.9 | |||
| Prohibition | Virgil G. Hinshaw | 6,864 | 5.3 | |||
| Townsend | Janie Bele McCarty | 3,537 | 2.7 | |||
| Communist | Orla E. Lair | 792 | 0.6 | |||
| Total votes | 129,300 | 100.0 | ||||
| Republican gain from Democratic | ||||||
1944
| Party | Candidate | Votes | % | |
|---|---|---|---|---|
| Republican | John Carl Hinshaw (Incumbent) | 112,663 | 51.8 | |
| Democratic | Archibald B. Young | 101,090 | 46.5 | |
| Prohibition | Charles Hiram Randall | 3,615 | 1.5 | |
| Total votes | 217,368 | 100.0 | ||
| Republican hold | ||||
1946
| Party | Candidate | Votes | % | |
|---|---|---|---|---|
| Republican | John Carl Hinshaw (Incumbent) | 98,283 | 63.2 | |
| Democratic | Everett G. Burkhalter | 67,317 | 36.8 | |
| Total votes | 165,600 | 100.0 | ||
| Republican hold | ||||
1948
| Party | Candidate | Votes | % | |
|---|---|---|---|---|
| Republican | John Carl Hinshaw (Incumbent) | 204,710 | 81.6 | |
| Democratic | William B. Esterman | 46,232 | 18.4 | |
| Total votes | 250,942 | 100.0 | ||
| Republican hold | ||||
1950
| Party | Candidate | Votes | % | |
|---|---|---|---|---|
| Republican | John Carl Hinshaw (Incumbent) | 211,012 | 85.1 | |
| Progressive | Myra Tanner Weiss | 26,508 | 10.7 | |
| Prohibition | Frank Nelson | 10,339 | 4.2 | |
| Total votes | 247,859 | 100.0 | ||
| Republican hold | ||||
1952
| Party | Candidate | Votes | % | |
|---|---|---|---|---|
| Republican | John Carl Hinshaw (Incumbent) | 109,509 | 100.0 | |
| Republican hold | ||||
1954
| Party | Candidate | Votes | % | |
|---|---|---|---|---|
| Republican | John Carl Hinshaw (Incumbent) | 71,213 | 71.2 | |
| Democratic | Eugene Radding | 28,838 | 28.8 | |
| Total votes | 100,051 | 100.0 | ||
| Republican hold | ||||
1956
| Party | Candidate | Votes | % | |
|---|---|---|---|---|
| Republican | H. Allen Smith | 85,459 | 70.8 | |
| Democratic | Eugene Radding | 35,249 | 29.2 | |
| Total votes | 120,708 | 100.0 | ||
| Republican hold | ||||
1958
| Party | Candidate | Votes | % | |
|---|---|---|---|---|
| Republican | H. Allen Smith (Incumbent) | 72,311 | 66 | |
| Democratic | Eugene Radding | 37,331 | 34 | |
| Total votes | 109,642 | 100.0 | ||
| Republican hold | ||||
1960
| Party | Candidate | Votes | % | |
|---|---|---|---|---|
| Republican | H. Allen Smith (Incumbent) | 90,214 | 70.1 | |
| Democratic | Eugene Radding | 38,497 | 29.9 | |
| Total votes | 128,711 | 100.0 | ||
| Republican hold | ||||
1962
| Party | Candidate | Votes | % | |
|---|---|---|---|---|
| Republican | H. Allen Smith (Incumbent) | 119,938 | 70.6 | |
| Democratic | Leon Mayer | 49,850 | 29.4 | |
| Total votes | 169,788 | 100.0 | ||
| Republican hold | ||||
1964
| Party | Candidate | Votes | % | |
|---|---|---|---|---|
| Republican | H. Allen Smith (Incumbent) | 132,402 | 67.9 | |
| Democratic | C. Bernard Kaufman | 62,645 | 32.1 | |
| Total votes | 195,047 | 100.0 | ||
| Republican hold | ||||
1966
| Party | Candidate | Votes | % | |
|---|---|---|---|---|
| Republican | H. Allen Smith (Incumbent) | 128,896 | 73.4 | |
| Democratic | Raymond Freschi | 46,730 | 26.6 | |
| Total votes | 175,626 | 100.0 | ||
| Republican hold | ||||
1968
| Party | Candidate | Votes | % | |
|---|---|---|---|---|
| Republican | H. Allen Smith (Incumbent) | 133,148 | 69.3 | |
| Democratic | Don White | 56,008 | 29.2 | |
| Peace and Freedom | Robert J. Clarke | 2,965 | 1.5 | |
| Total votes | 192,121 | 100.0 | ||
| Republican hold | ||||
1970
| Party | Candidate | Votes | % | |
|---|---|---|---|---|
| Republican | H. Allen Smith (Incumbent) | 116,437 | 69.1 | |
| Democratic | Michael M. Stolzberg | 50,033 | 29.7 | |
| American Independent | Earl C. Harper | 2,100 | 1.2 | |
| Total votes | 168,570 | 100.0 | ||
| Republican hold | ||||
1972
| Party | Candidate | Votes | % | |
|---|---|---|---|---|
| Republican | Carlos Moorhead | 120,299 | 57.4 | |
| Democratic | John Binkley | 89,219 | 42.6 | |
| Total votes | 209,518 | 100.0 | ||
| Republican hold | ||||
1974
| Party | Candidate | Votes | % | |
|---|---|---|---|---|
| Republican | Barry Goldwater Jr. | 96,324 | 61.2 | |
| Democratic | Arline M. Mathews | 61,119 | 38.8 | |
| Total votes | 157,443 | 100.0 | ||
| Republican hold | ||||
1976
| Party | Candidate | Votes | % | |
|---|---|---|---|---|
| Republican | Barry Goldwater Jr. (Incumbent) | 146,158 | 67.2 | |
| Democratic | Patty Lear Corman | 71,193 | 32.8 | |
| Total votes | 217,351 | 100.0 | ||
| Republican hold | ||||
1978
| Party | Candidate | Votes | % | |
|---|---|---|---|---|
| Republican | Barry Goldwater Jr. (Incumbent) | 129,714 | 66.4 | |
| Democratic | Pat Lear | 65,695 | 33.6 | |
| Total votes | 195,409 | 100.0 | ||
| Republican hold | ||||
1980
| Party | Candidate | Votes | % | |
|---|---|---|---|---|
| Republican | Barry Goldwater Jr. (Incumbent) | 199,674 | 78.8 | |
| Democratic | Matt Miller | 43,024 | 17.0 | |
| Libertarian | Christopher R. Darwin | 10,605 | 4.2 | |
| Total votes | 253,303 | 100.0 | ||
| Republican hold | ||||
1982
| Party | Candidate | Votes | % | |
|---|---|---|---|---|
| Republican | Bill Thomas | 123,312 | 68.1 | |
| Democratic | Robert J. Bethea | 57,769 | 31.9 | |
| Total votes | 181,081 | 100.0 | ||
| Republican hold | ||||
1984
| Party | Candidate | Votes | % | |
|---|---|---|---|---|
| Republican | Bill Thomas (Incumbent) | 151,732 | 70.9 | |
| Democratic | Michael T. LeSage | 62,307 | 29.1 | |
| Total votes | 214,039 | 100.0 | ||
| Republican hold | ||||
1986
| Party | Candidate | Votes | % | |
|---|---|---|---|---|
| Republican | Bill Thomas (Incumbent) | 129,989 | 72.6 | |
| Democratic | Jules H. Moquin | 49,027 | 27.4 | |
| Total votes | 179,016 | 100.0 | ||
| Republican hold | ||||
1988
| Party | Candidate | Votes | % | |
|---|---|---|---|---|
| Republican | Bill Thomas (Incumbent) | 162,779 | 71.1 | |
| Democratic | Lita Reid | 62,037 | 27.1 | |
| Libertarian | David L. Bersohn | 4,190 | 1.8 | |
| Total votes | 229,006 | 100.0 | ||
| Republican hold | ||||
1990
| Party | Candidate | Votes | % | |
|---|---|---|---|---|
| Republican | Bill Thomas (Incumbent) | 112,962 | 59.8 | |
| Democratic | Michael A. Thomas | 65,101 | 34.5 | |
| Libertarian | William Howard Dilbeck | 10,555 | 5.6 | |
| No party | Reid (write-in) | 307 | 0.2 | |
| Total votes | 188,925 | 100.0 | ||
| Republican hold | ||||
1992
| Party | Candidate | Votes | % | |||
|---|---|---|---|---|---|---|
| Democratic | Cal Dooley | 72,679 | 64.9 | |||
| Republican | Ed Hunt | 39,388 | 35.1 | |||
| Total votes | 112,067 | 100.0 | ||||
| Democratic gain from Republican | ||||||
1994
| Party | Candidate | Votes | % | |
|---|---|---|---|---|
| Democratic | Cal Dooley (Incumbent) | 57,394 | 56.70 | |
| Republican | Paul Young | 43,836 | 43.30 | |
| Total votes | 101,230 | 100.0 | ||
| Democratic hold | ||||
1996
| Party | Candidate | Votes | % | |
|---|---|---|---|---|
| Democratic | Cal Dooley (Incumbent) | 65,381 | 56.6 | |
| Republican | Trice Harvey | 45,276 | 39.1 | |
| Libertarian | Jonathan Richter | 5,048 | 4.3 | |
| Total votes | 115,705 | 100.0 | ||
| Democratic hold | ||||
1998
| Party | Candidate | Votes | % | |
|---|---|---|---|---|
| Democratic | Cal Dooley (Incumbent) | 60,599 | 60.73 | |
| Republican | Cliff Unruh | 39,183 | 39.27 | |
| Total votes | 99,782 | 100.0 | ||
| Democratic hold | ||||
2000
| Party | Candidate | Votes | % | |
|---|---|---|---|---|
| Democratic | Cal Dooley (Incumbent) | 66,235 | 52.4 | |
| Republican | Rich Rodriguez | 57,563 | 45.5 | |
| Natural Law | Walter Kenneth Ruehlig | 1,416 | 1.1 | |
| Libertarian | Arnold Kriegbaum | 1,320 | 1.0 | |
| Total votes | 126,534 | 100.0 | ||
| Democratic hold | ||||
2002
| Party | Candidate | Votes | % | |
|---|---|---|---|---|
| Democratic | Cal Dooley (Incumbent) | 47,627 | 63.7 | |
| Republican | Andre Minuth | 25,628 | 34.3 | |
| Libertarian | Varrin Swearingen | 1,515 | 2.0 | |
| Turnout | 74,770 | |||
| Democratic hold | ||||
2004
| Party | Candidate | Votes | % | |
|---|---|---|---|---|
| Democratic | Jim Costa | 61,005 | 53.5 | |
| Republican | Roy Ashburn | 53,231 | 46.5 | |
| Total votes | 114,236 | 100.0 | ||
| Democratic hold | ||||
2006
| Party | Candidate | Votes | % | |
|---|---|---|---|---|
| Democratic | Jim Costa (Incumbent) | 61,120 | 100.0 | |
| Democratic hold | ||||
2008
| Party | Candidate | Votes | % | |
|---|---|---|---|---|
| Democratic | Jim Costa (Incumbent) | 93,023 | 74.33 | |
| Republican | Jim Lopez | 32,118 | 25.67 | |
| Total votes | 125,141 | 100.0 | ||
| Turnout | {{{votes}}} | 60.55 | ||
| Democratic hold | ||||
2010
| Party | Candidate | Votes | % | |
|---|---|---|---|---|
| Democratic | Jim Costa (Incumbent) | 46,247 | 51.71 | |
| Republican | Andy Vidak | 43,197 | 48.29 | |
| Total votes | 89,444 | 100.00 | ||
| Democratic hold | ||||
2012
| Party | Candidate | Votes | % | |
|---|---|---|---|---|
| Democratic | Sam Farr (Incumbent) | 172,996 | 74.1 | |
| Republican | Jeff Taylor | 60,566 | 25.9 | |
| Total votes | 233,562 | 100.0 | ||
| Democratic hold | ||||
2014
| Party | Candidate | Votes | % | |
|---|---|---|---|---|
| Democratic | Sam Farr (Incumbent) | 106,034 | 75.2 | |
| Republican | Ronald Paul Kabat | 35,010 | 24.8 | |
| Total votes | 141,044 | 100.0 | ||
| Democratic hold | ||||
2016
| Party | Candidate | Votes | % | |
|---|---|---|---|---|
| Democratic | Jimmy Panetta | 180,980 | 70.8 | |
| Republican | Casey Lucius | 74,811 | 29.2 | |
| Total votes | 255,791 | 100.0 | ||
| Democratic hold | ||||
2018
| Party | Candidate | Votes | % | |
|---|---|---|---|---|
| Democratic | Jimmy Panetta (Incumbent) | 183,677 | 81.4 | |
| No party preference | Ronald Paul Kabat | 42,044 | 18.6 | |
| Total votes | 225,721 | 100.0 | ||
| Democratic hold | ||||
2020
| Party | Candidate | Votes | % | |
|---|---|---|---|---|
| Democratic | Jimmy Panetta (incumbent) | 236,896 | 76.8 | |
| Republican | Jeff Gorman | 71,658 | 23.2 | |
| Total votes | 308,554 | 100.0 | ||
| Democratic hold | ||||
2022
| Party | Candidate | Votes | % | |
|---|---|---|---|---|
| Republican | Kevin McCarthy (incumbent) | 153,847 | 67.2 | |
| Democratic | Marisa Wood | 74,934 | 32.8 | |
| Total votes | 228,781 | 100.0 | ||
| Republican hold | ||||
Historical district boundaries
.tif.png.webp)
References
- Center for New Media & Promotion (CNMP), US Census Bureau. "My Congressional District". www.census.gov.
- "2022 Cook PVI: District Map and List". The Cook Political Report. July 12, 2022. Retrieved January 3, 2023.
- Kevin McCarthy formally submits his resignation from Congress (axios.com)
- Brooks, Emily (December 19, 2023). "Kevin McCarthy submits official House resignation". The Hill. Retrieved April 25, 2024.
- "CA 2022 Congressional". Dave's Redistricting. January 4, 2022. Retrieved November 11, 2022.
- "Statement of Vote (2000 President)" (PDF). Archived from the original (PDF) on May 20, 2011. Retrieved September 17, 2008.
- "Statement of Vote (2000 Senator)" (PDF). Archived from the original (PDF) on May 20, 2011. Retrieved September 17, 2008.
- "Statement of Vote (2002 Governor)" (PDF). Archived from the original (PDF) on November 11, 2010.
- "Statement of Vote (2003 Recall Question)" (PDF). Archived from the original (PDF) on May 20, 2011. Retrieved October 8, 2007.
- "Statement of Vote (2003 Governor)" (PDF). Archived from the original (PDF) on May 20, 2011. Retrieved October 8, 2007.
- "Statement of Vote (2004 President)" (PDF). Archived from the original (PDF) on May 20, 2011. Retrieved August 8, 2007.
- "Statement of Vote (2004 Senator)" (PDF). Archived from the original (PDF) on August 10, 2011.
- "Statement of Vote (2006 Governor)" (PDF). Archived from the original (PDF) on August 10, 2011.
- "Statement of Vote (2006 Senator)" (PDF). Archived from the original (PDF) on August 10, 2011.
- "(2008 President)". Archived from the original on February 11, 2009. Retrieved March 5, 2009.
- "Counties by Congressional District for Recall Question" (PDF). sos.ca.gov. September 14, 2021. Retrieved May 2, 2022.
- "Counties by Congressional Districts for Governor" (PDF). sos.ca.gov. November 8, 2022. Retrieved May 4, 2023.
- "1932 election results" (PDF).
- "1934 election results" (PDF).
- "1936 election results" (PDF).
- "1938 election results" (PDF).
- "1940 election results" (PDF).
- "1942 election results" (PDF).
- "1944 election results" (PDF).
- "1946 election results" (PDF).
- "1948 election results" (PDF).
- "1950 election results" (PDF).
- "1952 election results" (PDF).
- "1954 election results" (PDF).
- "1956 election results" (PDF).
- "1958 election results" (PDF).
- "1960 election results" (PDF).
- "1962 election results" (PDF).
- "1964 election results" (PDF).
- "1966 election results" (PDF).
- "1968 election results" (PDF).
- "1970 election results" (PDF).
- "1972 election results" (PDF).
- "1974 election results" (PDF).
- "1976 election results" (PDF).
- "1978 election results" (PDF).
- "1980 election results" (PDF).
- "1982 election results" (PDF).
- "1984 election results" (PDF).
- "1986 election results" (PDF).
- "1988 election results" (PDF).
- "1990 election results" (PDF).
- "1992 election results" (PDF).
- "1994 election results" (PDF).
- "1996 election results" (PDF).
- "1998 election results" (PDF).
- "2000 election results" (PDF).
- "2002 general election results" (PDF). Archived from the original (PDF) on February 3, 2009.
- "2004 general election results" (PDF). Archived from the original (PDF) on August 21, 2008.
- "2006 general election results" (PDF). Archived from the original (PDF) on November 27, 2008.
- "2008 general election results" (PDF).
- "2010 general election results" (PDF). Archived from the original (PDF) on May 20, 2011. Retrieved March 8, 2012.
- "2012 general election results" (PDF). Archived from the original (PDF) on October 19, 2013.
- "U.S. House of Representatives District 20 - Districtwide Results". Archived from the original on January 6, 2015. Retrieved December 21, 2014.
- "United States Representative in Congress by District" (PDF). Retrieved March 18, 2019.
- "2022 Statewide General Election - United States Representative in Congress by District" (PDF). Retrieved January 7, 2022.
External links
- Rep. Kevin McCarthy’s official House of Representatives website
- GovTrack.us: California's 20th congressional district
- RAND California Election Returns: District Definitions
- California Voter Foundation map – CD20
| |||||||
| Speakership |
| .jpg.webp) | |||||
| Elections |
| ||||||
| Related |
| ||||||