California's 2nd congressional district
California's 2nd congressional district is a U.S. congressional district in California. Jared Huffman, a Democrat, has represented the district since January 2013. Currently, it encompasses the North Coast region and adjacent areas of the state. It stretches from the Golden Gate Bridge to the Oregon border, and includes all of the portions of Highway 101 within California that are north of San Francisco, excepting a stretch in Sonoma County. The district consists of Marin, Mendocino, Humboldt, Del Norte, and Trinity Counties, plus portions of Sonoma County. Cities in the district include San Rafael, Petaluma, Novato, Windsor, Healdsburg, Ukiah, Fort Bragg, Fortuna, Eureka, Arcata, McKinleyville, Crescent City, and northwestern Santa Rosa.[1]
| California's 2nd congressional district | |||
|---|---|---|---|
Interactive map of district boundaries since 2023 (Used in the 2022 elections) | |||
| Representative |
| ||
| Population (2022) | 747,410[1] | ||
| Median household income | $92,721[2] | ||
| Ethnicity |
| ||
| Cook PVI | D+23[3] | ||
.svg.png.webp)
History
From 2003 until the redistricting by the California Citizens Redistricting Commission that took effect in 2013, the 2nd district encompassed much of the far northern part of the state, from the Central Valley north of Sacramento to the Oregon border. It was the largest district by area in California. It consisted of Colusa, Glenn, Shasta, Siskiyou, Sutter, Tehama, Trinity, and Yuba counties, plus portions of Butte and Yolo counties.
The district had a dramatically different political history than its current incarnation. While the current 2nd is one of the most Democratic districts in California, the old 2nd had been a Republican stronghold for almost three decades. Much of this territory is now the 1st district, while most of the current 2nd had been split between the 1st and 6th districts from 2003 to 2013.
Election results from statewide races
| Year | Office | Results |
|---|---|---|
| 1990 | Governor[4] | Wilson 56.8% - 37.4% |
| 1992 | President[5] | Bush 38.7 – 35.7% |
| Senator[6] | Herschensohn 52.7 – 35.6% | |
| Senator (Special)[6] | Seymour 47.0 – 42.7% | |
| 1994 | Governor[7] | Wilson 64.2 – 29.7% |
| Senator[8] | Huffington 57.8 – 32.8% | |
| 1996 | President[9] | Dole 50.9 – 36.1% |
| 1998 | Governor[10] | Lungren 50.6% – 45.1% |
| Senator[11] | Fong 56.3% – 38.3% | |
| 2000 | President[12] | Bush 59.2 – 34.1% |
| Senator[13] | Campbell 50.9 – 39.5% | |
| 2002 | Governor[14] | Simon 57.6 – 31.1% |
| 2003 | Recall[15][16] | |
| Schwarzenegger 57.6 – 18.5% | ||
| 2004 | President[17] | Bush 62.0 – 36.6% |
| Senator[18] | Jones 55.5 – 39.6% | |
| 2006 | Governor[19] | Schwarzenegger 70.5 – 23.7% |
| Senator[20] | Mountjoy 51.8 – 42.0% | |
| 2008 | President[21] | McCain 55.0 – 42.6% |
| 2010 | Governor[22] | Whitman 55.2 – 37.6% |
| Senator[23] | Fiorina 60.2 – 31.9% | |
| 2012 | President[24] | Obama 68.7 – 26.8% |
| Senator[25] | Feinstein 72.6 – 27.4% | |
| 2014 | Governor[26] | Brown 73.5 – 26.5% |
| 2016 | President[27] | Clinton 69.0 – 23.3% |
| Senator[28] | Harris 73.8 – 26.2% | |
| 2018 | Governor[29] | Newsom 72.1 – 27.9% |
| Senator[30] | Feinstein 56.6 – 43.4% | |
| 2020 | President[31] | Biden 73.6 – 23.9% |
| 2021 | Recall[32] | |
| 2022 | Governor[33] | Newsom 70.7 – 29.3% |
| Senator | Padilla 72.7 – 27.3% |
Composition
| # | County | Seat | Population |
|---|---|---|---|
| 15 | Del Norte | Crescent City | 28,100 |
| 23 | Humboldt | Eureka | 136,310 |
| 41 | Marin | San Rafael | 260,206 |
| 45 | Mendocino | Ukiah | 91,305 |
| 105 | Trinity | Weaverville | 16,060 |
As of the 2020 redistricting, California's 2nd district is located on the North Coast. It encompasses Del Norte, Humboldt, Marin, Mendocino, and Trinity Counties, as well as most of Sonoma County.
Sonoma County is split between this district and the 4th district. They are partitioned by the Petaluma River, Highway 116, Redwood Highway, Robber Rd, Petersen Rd, Llano Rd, S Wright Rd, W College Ave, Jennings Ave, Administration Dr, Bicentennial Way, Cleveland Ave, Old Redwood Highway, Cross Creek Rd, Sonoma Highway, and Sonoma Creek. The 2nd district takes in the Monroe District of Santa Rosa, and the cities of Petaluma and Healdsburg.
Cities with 10,000 or more people
- San Rafael - 61,271
- Petaluma - 59,776
- Novato - 53,225
- Windsor - 26,801
- Eureka - 26,710
- Arcata - 18,857
- Ukiah - 16,607
- Mill Valley - 14,231
- Larkspur - 13,064
- Fortuna - 12,516
- Healdsburg - 11,254
- Corte Madera - 10,222
2,500-10,000 people
- Cloverdale - 8,618
- Sebastopol - 7,521
- Sausalito - 7,269
- Fort Bragg - 6,983
- Crescent City - 6,673
- Willits - 4,988
- Rio Dell - 3,349
List of members representing the district
| Member | Party | Dates | Cong ress(es) |
Electoral history | Counties |
|---|---|---|---|---|---|
| District created March 4, 1865 | |||||
 William Higby (Calaveras) |
Republican | March 4, 1865 – March 3, 1869 |
39th 40th |
Redistricted from the at-large district and re-elected in 1864. Re-elected in 1867. Lost re-election. |
1865–1873 Alameda, Alpine, Amador, Calaveras, Contra Costa, El Dorado, Mono, Nevada, Placer, Sacramento, San Joaquin, Tuolumne |
 Aaron A. Sargent (Nevada City) |
Republican | March 4, 1869 – March 3, 1873 |
41st 42nd |
Elected in 1868. Re-elected in 1871. Retired to run for U.S. Senator. | |
 Horace F. Page (Placerville) |
Republican | March 4, 1873 – March 3, 1883 |
43rd 44th 45th 46th 47th |
Elected in 1872. Re-elected in 1875. Re-elected in 1876. Re-elected in 1879. Re-elected in 1880. Lost re-election. |
1873–1885 Alameda, Alpine, Amador, Calaveras, Contra Costa, El Dorado, Nevada, Placer, Sacramento, San Joaquin, Tuolumne |
 James Budd (Stockton) |
Democratic | March 4, 1883 – March 3, 1885 |
48th | Elected in 1882. Retired. | |
.jpg.webp) James A. Louttit (Stockton) |
Republican | March 4, 1885 – March 3, 1887 |
49th | Elected in 1884. Retired. |
1885–1893 Amador, Butte, Calaveras, El Dorado, Mariposa, Merced, Nevada, Placer, San Joaquin, Stanislaus, Sutter, Tuolumne, Yuba |
 Marion Biggs (Gridley) |
Democratic | March 4, 1887 – March 3, 1891 |
50th 51st |
Elected in 1886. Re-elected in 1888. Retired. | |
.jpg.webp) Anthony Caminetti (Jackson) |
Democratic | March 4, 1891 – March 3, 1895 |
52nd 53rd |
Elected in 1890. Re-elected in 1892. Lost re-election. | |
| 1893–1903 Alpine, Amador, Butte, Calaveras, El Dorado, Inyo, Mariposa, Mono, Nevada, Placer, Sacramento, San Joaquin, Sutter, Tuolumne, Yuba | |||||
 Grove L. Johnson (Sacramento) |
Republican | March 4, 1895 – March 3, 1897 |
54th | Elected in 1894. Lost re-election. | |
.jpg.webp) Marion De Vries (Stockton) |
Democratic | March 4, 1897 – August 20, 1900 |
55th 56th |
Re-elected in 1896. Re-elected in 1898. Resigned when appointed as a member of the Board of General Appraisers | |
| Vacant | August 20, 1900 – December 3, 1900 |
56th | |||
.jpg.webp) Samuel D. Woods (Stockton) |
Republican | December 3, 1900 – March 3, 1903 |
56th 57th |
Elected to finish De Vries's term. Retired. | |
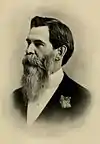
 Theodore Arlington Bell (Napa) |
Democratic | March 4, 1903 – March 3, 1905 |
58th | Elected in 1902. Lost re-election. |
1903–1913 Butte, Colusa, Glenn, Lake, Marin, Mendocino, Napa, Sacramento, Sonoma, Sutter, Yolo, Yuba |
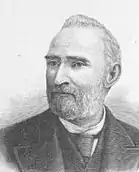
 Duncan E. McKinlay (Santa Rosa) |
Republican | March 4, 1905 – March 3, 1911 |
59th 60th 61st |
Elected in 1904. Re-elected in 1906. Re-elected in 1908. Lost renomination to Kent. | |
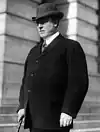
 William Kent (Kentfield) |
Progressive Republican | March 4, 1911 – March 3, 1913 |
62nd | Elected in 1910. Redistricted to the 1st district. | |
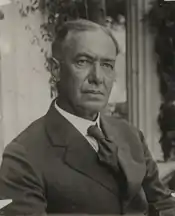
 John E. Raker (Alturas) |
Democratic | March 4, 1913 – January 22, 1926 |
63rd 64th 65th 66th 67th 68th 69th |
Redistricted from the 1st district and re-elected in 1912. Re-elected in 1914. Re-elected in 1916. Re-elected in 1918. Re-elected in 1920. Re-elected in 1922. Re-elected in 1924. Died. |
1913–1933 Alpine, Amador, Calaveras, El Dorado, Lassen, Mariposa, Modoc, Nevada, Placer, Plumas, Shasta, Sierra, Siskiyou, Tehama, Trinity, Tuolumne |
| Vacant | January 22, 1926 – August 31, 1926 |
69th | |||
.jpg.webp) Harry Lane Englebright (Nevada City) |
Republican | August 31, 1926 – May 13, 1943 |
69th 70th 71st 72nd 73rd 74th 75th 76th 77th 78th |
Elected to finish Raker's term. Re-elected in 1926. Re-elected in 1928. Re-elected in 1930. Re-elected in 1932. Re-elected in 1934. Re-elected in 1936. Re-elected in 1938. Re-elected in 1940. Re-elected in 1942. Died. | |
| 1933–1953 Alpine, Amador, Calaveras, El Dorado, Inyo, Lassen, Mariposa, Modoc, Mono, Nevada, Placer, Plumas, Shasta, Sierra, Siskiyou, Tehama, Trinity, Tuolumne | |||||
| Vacant | May 13, 1943 – August 31, 1943 |
78th | |||
 Clair Engle (Red Bluff) |
Democratic | August 31, 1943 – January 3, 1959 |
78th 79th 80th 81st 82nd 83rd 84th 85th |
Elected to finish Englebright's term. Re-elected in 1944. Re-elected in 1946. Re-elected in 1948. Re-elected in 1950. Re-elected in 1952. Re-elected in 1954. Re-elected in 1956. Retired to run for U.S. Senator. | |
| 1953–1963 Alpine, Amador, Butte, Calaveras, El Dorado, Inyo, Lassen, Mariposa, Modoc, Mono, Nevada, Placer, Plumas, Shasta, Sierra, Siskiyou, Tehama, Trinity, Tuolumne | |||||
 Harold T. Johnson (Roseville) |
Democratic | January 3, 1959 – January 3, 1975 |
86th 87th 88th 89th 90th 91st 92nd 93rd |
Elected in 1958. Re-elected in 1960. Re-elected in 1962. Re-elected in 1964. Re-elected in 1966. Re-elected in 1968. Re-elected in 1970. Re-elected in 1972. Redistricted to the 1st district. | |
| 1963–1973 Alpine, Amador, Butte, Calaveras, El Dorado, Inyo, Lassen, Madera, Mariposa, Modoc, Mono, Nevada, Placer, Plumas, Shasta, Sierra, Siskiyou, Tehama, Trinity, Tuolumne | |||||
| 1973–1975 Alpine, Butte, Lassen, Modoc, Nevada County, Placer, Plumas, Shasta, Sierra, Siskiyou, Tehama, Trinity | |||||
 Donald H. Clausen (Crescent City) |
Republican | January 3, 1975 – January 3, 1983 |
94th 95th 96th 97th |
Redistricted from the 1st district and re-elected in 1974. Re-elected in 1976. Re-elected in 1978. Re-elected in 1980. Redistricted to the 1st district and lost re-election there. |
1975–1983 Del Norte, Humboldt, Mendocino, Napa, Sonoma |
 Eugene A. Chappie (Chico) |
Republican | January 3, 1983 – January 3, 1987 |
98th 99th |
Redistricted from the 1st district and re-elected in 1982. Re-elected in 1984. Retired. |
1983–1993 Butte, Colusa, Glenn, most of Lake, northern Napa, a tiny portion of Nevada, Shasta, Siskiyou, Sutter, Tehama, Trinity, Yuba |
 Wally Herger (Rio Oso) |
Republican | January 3, 1987 – January 3, 2013 |
100th 101st 102nd 103rd 104th 105th 106th 107th 108th 109th 110th 111th 112th |
Elected in 1986. Re-elected in 1988. Re-elected in 1990. Re-elected in 1992. Re-elected in 1994. Re-elected in 1996. Re-elected in 1998. Re-elected in 2000. Re-elected in 2002. Re-elected in 2004. Re-elected in 2006. Re-elected in 2008. Re-elected in 2010. Redistricted to the 1st district and retired. | |
| 1993–2003 Butte (except Gridley), Lassen, Modoc, Nevada, Plumas, Shasta, Sierra, Siskiyou, Trinity, Yuba | |||||
2003–2013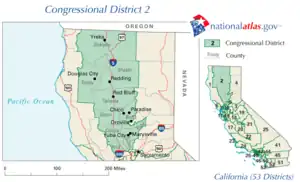 Most of Butte, Colusa, Glenn, Shasta, Siskiyou, Sutter, Tehama, Trinity, northern Yolo, Yuba | |||||
 Jared Huffman (San Rafael) |
Democratic | January 3, 2013 – present |
113th 114th 115th 116th 117th 118th |
Elected in 2012. Re-elected in 2014. Re-elected in 2016. Re-elected in 2018. Re-elected in 2020. Re-elected in 2022. |
2013–2023.tif.png.webp) California's North Coast including Del Norte, Humboldt, Marin, Mendocino, and Trinity counties. Coastal Sonoma County and parts of San Francisco. |
2023–present_(new_version).svg.png.webp) | |||||
Election results
1864
| Party | Candidate | Votes | % | |
|---|---|---|---|---|
| Republican | William Higby | 23,414 | 61.6 | |
| Democratic | James W. Coffroth | 14,581 | 38.4 | |
| Total votes | 37,995 | 100.0 | ||
| Turnout | {{{votes}}} | |||
| Republican hold | ||||
1867
| Party | Candidate | Votes | % | |
|---|---|---|---|---|
| Republican | William Higby (incumbent) | 16,053 | 52.0 | |
| Democratic | James W. Coffroth | 14,786 | 48.0 | |
| Total votes | 30,839 | 100.0 | ||
| Turnout | {{{votes}}} | |||
| Republican hold | ||||
1868
| Party | Candidate | Votes | % | |
|---|---|---|---|---|
| Republican | Aaron Augustus Sargent | 18,264 | 54.7 | |
| Democratic | James W. Coffroth | 15,124 | 45.3 | |
| Total votes | 33,388 | 100.0 | ||
| Turnout | {{{votes}}} | |||
| Republican hold | ||||
1871
| Party | Candidate | Votes | % | |
|---|---|---|---|---|
| Republican | Aaron Augustus Sargent (incumbent) | 18,065 | 54.0 | |
| Democratic | James W. Coffroth | 15,382 | 46.0 | |
| Total votes | 33,447 | 100.0 | ||
| Turnout | {{{votes}}} | |||
| Republican hold | ||||
1872
| Party | Candidate | Votes | % | |
|---|---|---|---|---|
| Republican | Horace F. Page | 13,803 | 51.9 | |
| Democratic | Pasz Coggins | 12,816 | 48.1 | |
| Total votes | 26,619 | 100.0 | ||
| Turnout | {{{votes}}} | |||
| Republican hold | ||||
1875
| Party | Candidate | Votes | % | |
|---|---|---|---|---|
| Republican | Horace F. Page (incumbent) | 13,624 | 43.4 | |
| Democratic | Hy Larkin | 12,154 | 38.8 | |
| Independent | Charles R. Tuttle | 5,589 | 17.8 | |
| Total votes | 31,367 | 100.0 | ||
| Turnout | {{{votes}}} | |||
| Republican hold | ||||
1876
| Party | Candidate | Votes | % | |
|---|---|---|---|---|
| Republican | Horace F. Page (incumbent) | 20,815 | 56.7 | |
| Democratic | G. J. Carpenter | 15,916 | 43.3 | |
| Total votes | 36,731 | 100.0 | ||
| Turnout | {{{votes}}} | |||
| Republican hold | ||||
1879
| Party | Candidate | Votes | % | |
|---|---|---|---|---|
| Republican | Horace F. Page (incumbent) | 19,386 | 51.9 | |
| Democratic | Thomas J. Clunie | 12,847 | 34.4 | |
| Workingman's | H. B. Williams[42] | 5,139 | 13.8 | |
| Total votes | 37,372 | 100.0 | ||
| Turnout | {{{votes}}} | |||
| Republican hold | ||||
1880
| Party | Candidate | Votes | % | |
|---|---|---|---|---|
| Republican | Horace F. Page (incumbent) | 22,038 | 53.6 | |
| Democratic | John R. Glasscock | 18,859 | 45.9 | |
| Greenback | Benjamin Todd [44] | 296 | 0.4 | |
| Prohibition | B. K. Lowe | 41 | 0.1 | |
| Total votes | 41,118 | 100.0 | ||
| Turnout | ||||
| Republican hold | ||||
1882
| Party | Candidate | Votes | % | |||
|---|---|---|---|---|---|---|
| Democratic | James Budd | 20,229 | 50.5 | |||
| Republican | Horace F. Page (incumbent) | 19,246 | 48.1 | |||
| Prohibition | J. L. Coles | 478 | 1.2 | |||
| Greenback | F. J. Woodward [46] | 78 | 0.2 | |||
| Total votes | 40,031 | 100.0 | ||||
| Turnout | {{{votes}}} | |||||
| Democratic gain from Republican | ||||||
1884
| Party | Candidate | Votes | % | |||
|---|---|---|---|---|---|---|
| Republican | James A. Louttit | 18,327 | 49.4 | |||
| Democratic | Charles Allen Sumner | 18,208 | 49.1 | |||
| Prohibition | Joshua B. Webster | 558 | 1.5 | |||
| Total votes | 37,093 | 100.0 | ||||
| Turnout | {{{votes}}} | |||||
| Republican gain from Democratic | ||||||
1886
| Party | Candidate | Votes | % | |||
|---|---|---|---|---|---|---|
| Democratic | Marion Biggs | 17,667 | 50.0 | |||
| Republican | J. C. Campbell | 16,594 | 47.0 | |||
| Prohibition | W. O. Clark | 1,076 | 3.0 | |||
| Total votes | 35,337 | 100.0 | ||||
| Turnout | {{{votes}}} | |||||
| Democratic gain from Republican | ||||||
1888
| Party | Candidate | Votes | % | |
|---|---|---|---|---|
| Democratic | Marion Biggs (incumbent) | 19,064 | 50.6 | |
| Republican | John A. Eagon | 17,541 | 46.6 | |
| Independent | S. M. McLean | 913 | 2.4 | |
| Know Nothing | J. F. McSwain [50] | 138 | 0.4 | |
| Total votes | 37,656 | 100.0 | ||
| Turnout | {{{votes}}} | |||
| Democratic hold | ||||
1890
| Party | Candidate | Votes | % | |
|---|---|---|---|---|
| Democratic | Anthony Caminetti | 18,644 | 49.0 | |
| Republican | George G. Blanchard | 18,485 | 48.6 | |
| Prohibition | J. S. Witherell | 912 | 2.4 | |
| Total votes | 38,041 | 100.0 | ||
| Turnout | {{{votes}}} | |||
| Democratic hold | ||||
1892
| Party | Candidate | Votes | % | |
|---|---|---|---|---|
| Democratic | Anthony Caminetti (incumbent) | 20,741 | 53.3 | |
| Republican | John F. Davis | 16,781 | 43.1 | |
| Prohibition | Chauncey H. Dunn | 1,307 | 3.4 | |
| Independent | J. H. White | 122 | 0.3 | |
| Total votes | 38,951 | 100.0 | ||
| Turnout | {{{votes}}} | |||
| Democratic hold | ||||
1894
| Party | Candidate | Votes | % | |||
|---|---|---|---|---|---|---|
| Republican | Grove L. Johnson | 19,302 | 43.0 | |||
| Democratic | Anthony Caminetti (incumbent) | 15,732 | 35.1 | |||
| Populist | Burdell Cornell | 8,946 | 20.0 | |||
| Prohibition | Elam Briggs | 866 | 1.9 | |||
| Total votes | 44,846 | 100.0 | ||||
| Turnout | {{{votes}}} | |||||
| Republican gain from Democratic | ||||||
1896
| Party | Candidate | Votes | % | |||
|---|---|---|---|---|---|---|
| Democratic | Marion De Vries | 24,434 | 55.5 | |||
| Republican | Grove L. Johnson (incumbent) | 18,613 | 42.3 | |||
| Prohibition | F. E. Coulter | 974 | 2.2 | |||
| Total votes | 44,021 | 100.0 | ||||
| Turnout | {{{votes}}} | |||||
| Democratic gain from Republican | ||||||
1898
| Party | Candidate | Votes | % | |
|---|---|---|---|---|
| Democratic | Marion De Vries (incumbent) | 25,196 | 55.3 | |
| Republican | Frank D. Ryan | 20,400 | 44.7 | |
| Total votes | 45,596 | 100.0 | ||
| Turnout | {{{votes}}} | |||
| Democratic hold | ||||
1900 (Special)
| Party | Candidate | Votes | % | |||
|---|---|---|---|---|---|---|
| Republican | Samuel D. Woods | N/A | 51.0 | |||
| Democratic | J. D. Sproul | N/A | 49.0 | |||
| Total votes | N/A | 100.0 | ||||
| Turnout | {{{votes}}} | |||||
| Republican gain from Democratic | ||||||
1900 (General)
| Party | Candidate | Votes | % | |||
|---|---|---|---|---|---|---|
| Republican | Samuel D. Woods | 23,019 | 50.4 | |||
| Democratic | J. D. Sproul | 21,851 | 47.9 | |||
| Social Democratic | W. F. Lockwood [58] | 402 | 0.9 | |||
| Prohibition | W. H. Barron | 371 | 0.8 | |||
| Total votes | 45,643 | 100.0 | ||||
| Turnout | {{{votes}}} | |||||
| Republican gain from Democratic | ||||||
1902
| Party | Candidate | Votes | % | |||
|---|---|---|---|---|---|---|
| Democratic | Theodore A. Bell | 21,536 | 49.2 | |||
| Republican | Frank Coombs (incumbent) | 21,181 | 48.3 | |||
| Socialist | G. H. Rogers | 731 | 1.7 | |||
| Prohibition | W. P. Fassett | 367 | 0.8 | |||
| Total votes | 43,815 | 100.0 | ||||
| Turnout | {{{votes}}} | |||||
| Democratic gain from Republican | ||||||
1904
| Party | Candidate | Votes | % | |||
|---|---|---|---|---|---|---|
| Republican | Duncan E. McKinlay (incumbent) | 22,873 | 49.2 | |||
| Democratic | Theodore A. Bell | 21,640 | 46.6 | |||
| Socialist | J. H. White | 1,524 | 3.3 | |||
| Prohibition | Eli P. LaCell | 431 | 0.9 | |||
| Total votes | 46,468 | 100.0 | ||||
| Turnout | {{{votes}}} | |||||
| Republican gain from Democratic | ||||||
1906
| Party | Candidate | Votes | % | |
|---|---|---|---|---|
| Republican | Duncan E. McKinlay (incumbent) | 23,411 | 51.8 | |
| Democratic | W. A. Beard | 20,262 | 44.8 | |
| Socialist | A. J. Gaylord | 1,524 | 3.4 | |
| Total votes | 45,197 | 100.0 | ||
| Turnout | {{{votes}}} | |||
| Republican hold | ||||
1908
| Party | Candidate | Votes | % | |
|---|---|---|---|---|
| Republican | Duncan E. McKinlay (incumbent) | 28,627 | 57.5 | |
| Democratic | W. K. Hays | 19,193 | 38.5 | |
| Socialist | A. J. Gaylord | 2,003 | 4.0 | |
| Total votes | 49,823 | 100.0 | ||
| Turnout | {{{votes}}} | |||
| Republican hold | ||||
1910
| Party | Candidate | Votes | % | |
|---|---|---|---|---|
| Republican | William Kent | 25,346 | 50.1 | |
| Democratic | I. G. Zumwalt | 22,229 | 44.0 | |
| Socialist | W. H. Ferber | 2,647 | 5.2 | |
| Prohibition | Henry P. Stipp | 329 | 0.7 | |
| Total votes | 50,451 | 100.0 | ||
| Turnout | {{{votes}}} | |||
| Republican hold | ||||
1912
| Party | Candidate | Votes | % | |
|---|---|---|---|---|
| Democratic | John E. Raker (incumbent) | 23,467 | 62.6 | |
| Republican | Frank M. Rutherford | 10,178 | 27.2 | |
| Socialist | J. C. Williams | 3,818 | 10.2 | |
| Total votes | 37,463 | 100.0 | ||
| Turnout | {{{votes}}} | |||
| Democratic hold | ||||
1914
| Party | Candidate | Votes | % | |
|---|---|---|---|---|
| Democratic | John E. Raker (incumbent) | 32,575 | 64.7 | |
| Republican | James T. Matlock | 15,716 | 31.2 | |
| Prohibition | W. P. Fassett | 2,086 | 4.1 | |
| Total votes | 50,377 | 100.0 | ||
| Turnout | {{{votes}}} | |||
| Democratic hold | ||||
1916
| Party | Candidate | Votes | % | |
|---|---|---|---|---|
| Democratic | John E. Raker (incumbent) | 30,042 | 71.0 | |
| Republican | Edward H. Hart | 12,282 | 29.0 | |
| Total votes | 42,324 | 100 | ||
| Turnout | {{{votes}}} | |||
| Democratic hold | ||||
1918
| Party | Candidate | Votes | % | |
|---|---|---|---|---|
| Democratic | John E. Raker (incumbent) | 28,249 | 100.0 | |
| Turnout | {{{votes}}} | |||
| Democratic hold | ||||
1920
| Party | Candidate | Votes | % | |
|---|---|---|---|---|
| Democratic | John E. Raker (incumbent) | 26,172 | 100.0 | |
| Turnout | {{{votes}}} | |||
| Democratic hold | ||||
1922
| Party | Candidate | Votes | % | |
|---|---|---|---|---|
| Democratic | John E. Raker (incumbent) | 32,981 | 100.0 | |
| Turnout | {{{votes}}} | |||
| Democratic hold | ||||
1924
| Party | Candidate | Votes | % | |
|---|---|---|---|---|
| Democratic | John E. Raker (incumbent) | 30,590 | 100.0 | |
| Turnout | {{{votes}}} | |||
| Democratic hold | ||||
1926 (Special)
| Party | Candidate | Votes | % | |||
|---|---|---|---|---|---|---|
| Republican | Harry Lane Englebright | 11,462 | 26.0 | |||
| Republican | Frank J Powers | 10,237 | 23.2 | |||
| Republican | Ferdinand G. Stevenot | 8,763 | 19.9 | |||
| Republican | Marshall De Motte | 8,001 | 18.2 | |||
| Democratic | Robert H De Witt | 5,572 | 12.7 | |||
| Total votes | 44,035 | 100.0 | ||||
| Turnout | {{{votes}}} | |||||
| Republican gain from Democratic | ||||||
1926
| Party | Candidate | Votes | % | |||
|---|---|---|---|---|---|---|
| Republican | Harry Lane Englebright (incumbent) | 32,264 | 100.0 | |||
| Turnout | {{{votes}}} | |||||
| Republican gain from Democratic | ||||||
1928
| Party | Candidate | Votes | % | |
|---|---|---|---|---|
| Republican | Harry Lane Englebright (incumbent) | 32,455 | 100.0 | |
| Turnout | {{{votes}}} | |||
| Republican hold | ||||
1930
| Party | Candidate | Votes | % | |
|---|---|---|---|---|
| Republican | Harry Lane Englebright (incumbent) | 35,941 | 100.0 | |
| Turnout | {{{votes}}} | |||
| Republican hold | ||||
1932
| Party | Candidate | Votes | % | |
|---|---|---|---|---|
| Republican | Harry Lane Englebright (incumbent) | 43,146 | 100.0 | |
| Turnout | {{{votes}}} | |||
| Republican hold | ||||
1934
| Party | Candidate | Votes | % | |
|---|---|---|---|---|
| Republican | Harry Lane Englebright (incumbent) | 66,370 | 100.0 | |
| Turnout | {{{votes}}} | |||
| Republican hold | ||||
1936
| Party | Candidate | Votes | % | |
|---|---|---|---|---|
| Republican | Harry Lane Englebright (incumbent) | 51,416 | 100.0 | |
| Turnout | {{{votes}}} | |||
| Republican hold | ||||
1938
| Party | Candidate | Votes | % | |
|---|---|---|---|---|
| Republican | Harry Lane Englebright (incumbent) | 71,496 | 100.0 | |
| Turnout | {{{votes}}} | |||
| Republican hold | ||||
1940
| Party | Candidate | Votes | % | |
|---|---|---|---|---|
| Republican | Harry Lane Englebright (incumbent) | 71,033 | 100.0 | |
| Turnout | {{{votes}}} | |||
| Republican hold | ||||
1942
| Party | Candidate | Votes | % | |
|---|---|---|---|---|
| Republican | Harry Lane Englebright (incumbent) | 50,094 | 100.0 | |
| Turnout | {{{votes}}} | |||
| Republican hold | ||||
1943 (Special)
| Party | Candidate | Votes | % | |||
|---|---|---|---|---|---|---|
| Democratic | Clair Engle | 1,721 | 53.3 | |||
| Republican | Grace Engelbright | 1,304 | 40.40 | |||
| Republican | Jesse M. Mayo | 203 | 6.3 | |||
| Total votes | 3,228 | 100.0 | ||||
| Turnout | {{{votes}}} | |||||
| Democratic gain from Republican | ||||||
1944
| Party | Candidate | Votes | % | |
|---|---|---|---|---|
| Democratic | Clair Engle (incumbent) | 48,201 | 63.8 | |
| Republican | Jesse M. Mayo | 27,312 | 36.2 | |
| Total votes | 75,513 | 100.0 | ||
| Turnout | {{{votes}}} | |||
| Democratic hold | ||||
1946
| Party | Candidate | Votes | % | |
|---|---|---|---|---|
| Democratic | Clair Engle (incumbent) | 57,895 | 100.0 | |
| Turnout | {{{votes}}} | |||
| Democratic hold | ||||
1948
| Party | Candidate | Votes | % | |
|---|---|---|---|---|
| Democratic | Clair Engle (incumbent) | 78,555 | 100.0 | |
| Turnout | {{{votes}}} | |||
| Democratic hold | ||||
1950
| Party | Candidate | Votes | % | |
|---|---|---|---|---|
| Democratic | Clair Engle (incumbent) | 85,103 | 100.0 | |
| Turnout | {{{votes}}} | |||
| Democratic hold | ||||
1952
| Party | Candidate | Votes | % | |
|---|---|---|---|---|
| Democratic | Clair Engle (incumbent) | 124,179 | 100.0 | |
| Turnout | {{{votes}}} | |||
| Democratic hold | ||||
1954
| Party | Candidate | Votes | % | |
|---|---|---|---|---|
| Democratic | Clair Engle (incumbent) | 113,104 | 100.0 | |
| Turnout | {{{votes}}} | |||
| Democratic hold | ||||
1956
| Party | Candidate | Votes | % | |
|---|---|---|---|---|
| Democratic | Clair Engle (incumbent) | 136,544 | 100.0 | |
| Turnout | {{{votes}}} | |||
| Democratic hold | ||||
1958
| Party | Candidate | Votes | % | |
|---|---|---|---|---|
| Democratic | Harold T. Johnson | 90,850 | 61.0 | |
| Republican | Curtis W. Tarr | 58,199 | 39.0 | |
| Total votes | 149,049 | 100 | ||
| Turnout | {{{votes}}} | |||
| Democratic hold | ||||
1960
| Party | Candidate | Votes | % | |
|---|---|---|---|---|
| Democratic | Harold T. Johnson (incumbent) | 109,565 | 62.7 | |
| Republican | Curtis W. Tarr | 65,198 | 37.3 | |
| Total votes | 174,763 | 100.0 | ||
| Turnout | {{{votes}}} | |||
| Democratic hold | ||||
1962
| Party | Candidate | Votes | % | |
|---|---|---|---|---|
| Democratic | Harold T. Johnson (incumbent) | 106,239 | 64.6 | |
| Republican | Frederic H. Nagel | 58,150 | 35.4 | |
| Total votes | 164,389 | 100.0 | ||
| Turnout | {{{votes}}} | |||
| Democratic hold | ||||
1964
| Party | Candidate | Votes | % | |
|---|---|---|---|---|
| Democratic | Harold T. Johnson (incumbent) | 125,774 | 64.6 | |
| Republican | Chester C. Merriam | 68,835 | 35.4 | |
| Total votes | 194,609 | 100.0 | ||
| Turnout | {{{votes}}} | |||
| Democratic hold | ||||
1966
| Party | Candidate | Votes | % | |
|---|---|---|---|---|
| Democratic | Harold T. Johnson (incumbent) | 131,145 | 70.9 | |
| Republican | William H. Romack, Jr. | 53,753 | 29.1 | |
| Total votes | 184,898 | 100.0 | ||
| Turnout | {{{votes}}} | |||
| Democratic hold | ||||
1968
| Party | Candidate | Votes | % | |
|---|---|---|---|---|
| Democratic | Harold T. Johnson (incumbent) | 127,880 | 60.8 | |
| Republican | Osmer E. Dunaway | 78,986 | 37.5 | |
| American Independent | Paul J. Huft | 3,577 | 1.7 | |
| Total votes | 210,443 | 100.0 | ||
| Turnout | {{{votes}}} | |||
| Democratic hold | ||||
1970
| Party | Candidate | Votes | % | |
|---|---|---|---|---|
| Democratic | Harold T. Johnson (incumbent) | 151,070 | 77.9 | |
| Republican | Lloyd E. Gilbert | 37,223 | 19.2 | |
| American Independent | Jack R. Carrigg | 5,681 | 2.9 | |
| Total votes | 193,974 | 100.0 | ||
| Turnout | {{{votes}}} | |||
| Democratic hold | ||||
1972
| Party | Candidate | Votes | % | |
|---|---|---|---|---|
| Democratic | Harold T. Johnson (incumbent) | 148,808 | 68.3 | |
| Republican | Francis X. Callahan | 62,381 | 28.6 | |
| American Independent | Dorothy D. Paradis | 6,688 | 3.1 | |
| Total votes | 217,877 | 100.0 | ||
| Turnout | {{{votes}}} | |||
| Democratic hold | ||||
1974
| Party | Candidate | Votes | % | |
|---|---|---|---|---|
| Republican | Donald H. Clausen (incumbent) | 95,508 | 53 | |
| Democratic | Oscar H. Klee | 76,951 | 42.7 | |
| Peace and Freedom | Carole J. Glass | 7,719 | 4.3 | |
| Total votes | 180,178 | 100.0 | ||
| Turnout | {{{votes}}} | |||
| Republican hold | ||||
1976
| Party | Candidate | Votes | % | |
|---|---|---|---|---|
| Republican | Donald H. Clausen (incumbent) | 121,290 | 56.0 | |
| Democratic | Oscar H. Klee | 88,829 | 41.0 | |
| Peace and Freedom | Robert B. "Bob" Allred | 6,444 | 3.0 | |
| Total votes | 216,563 | 100 | ||
| Turnout | {{{votes}}} | |||
| Republican hold | ||||
1978
| Party | Candidate | Votes | % | |
|---|---|---|---|---|
| Republican | Donald H. Clausen (incumbent) | 114,451 | 52.0 | |
| Democratic | Norma Bork | 99,712 | 45.3 | |
| Peace and Freedom | Irv Sutley | 6,097 | 2.8 | |
| Total votes | 220,260 | 100.0 | ||
| Turnout | {{{votes}}} | |||
| Republican hold | ||||
1980
| Party | Candidate | Votes | % | |
|---|---|---|---|---|
| Republican | Donald H. Clausen (incumbent) | 141,698 | 54.2 | |
| Democratic | Norma K. Bork | 109,789 | 42.0 | |
| Libertarian | Daniel Mosier | 6,833 | 2.6 | |
| Peace and Freedom | Linda D. Wren | 3,354 | 1.3 | |
| Total votes | 261,674 | 100.0 | ||
| Turnout | {{{votes}}} | |||
| Republican hold | ||||
1982
| Party | Candidate | Votes | % | |
|---|---|---|---|---|
| Republican | Eugene A. Chappie (incumbent) | 116,172 | 57.9 | |
| Democratic | John Newmeyer | 81,314 | 40.5 | |
| Peace and Freedom | Howard Fegarsky | 3,126 | 1.6 | |
| Total votes | 200,612 | 100.0 | ||
| Turnout | {{{votes}}} | |||
| Republican hold | ||||
1984
| Party | Candidate | Votes | % | |
|---|---|---|---|---|
| Republican | Eugene A. Chappie (incumbent) | 158,679 | 69.5 | |
| Democratic | Harry Cozad | 69,793 | 30.5 | |
| Total votes | 228,472 | 100.0 | ||
| Turnout | {{{votes}}} | |||
| Republican hold | ||||
1986
| Party | Candidate | Votes | % | |
|---|---|---|---|---|
| Republican | Wally Herger | 109,758 | 58.3 | |
| Democratic | Stephen C. Swendiman | 74,602 | 39.6 | |
| Libertarian | Harry Hugh "Doc" Pendery | 4,054 | 2.2 | |
| Total votes | 188,414 | 100.0 | ||
| Turnout | {{{votes}}} | |||
| Republican hold | ||||
1988
| Party | Candidate | Votes | % | |
|---|---|---|---|---|
| Republican | Wally Herger (incumbent) | 139,010 | 58.8 | |
| Democratic | Wayne R. Meyer | 91,088 | 38.5 | |
| Libertarian | Harry Hugh "Doc" Pendery | 6,253 | 2.6 | |
| Total votes | 236,351 | 100.0 | ||
| Turnout | {{{votes}}} | |||
| Republican hold | ||||
1990
| Party | Candidate | Votes | % | |
|---|---|---|---|---|
| Republican | Wally Herger (incumbent) | 133,315 | 63.7 | |
| Democratic | Erwin E. "Bill" Rush | 65,333 | 31.2 | |
| Libertarian | Ross Crain | 10,753 | 5.1 | |
| Total votes | 209,401 | 100.0 | ||
| Turnout | {{{votes}}} | |||
| Republican hold | ||||
1992
| Party | Candidate | Votes | % | |
|---|---|---|---|---|
| Republican | Wally Herger (incumbent) | 167,247 | 65.2 | |
| Democratic | Elliot Roy Freedman | 71,780 | 28.0 | |
| Libertarian | Harry H. "Doc" Pendery | 17,529 | 6.8 | |
| Total votes | 256,556 | 100.0 | ||
| Turnout | {{{votes}}} | |||
| Republican hold | ||||
1994
| Party | Candidate | Votes | % | |
|---|---|---|---|---|
| Republican | Wally Herger (incumbent) | 137,864 | 64.2 | |
| Democratic | Mary Jacobs | 55,959 | 26 | |
| American Independent | Devvy Kidd | 15,619 | 7.3 | |
| Libertarian | Harry H. "Doc" Pendery | 5,418 | 2.5 | |
| Total votes | 214,860 | 100.0 | ||
| Turnout | {{{votes}}} | |||
| Republican hold | ||||
1996
| Party | Candidate | Votes | % | |
|---|---|---|---|---|
| Republican | Wally Herger (incumbent) | 144,913 | 60.9 | |
| Democratic | Roberts Braden | 80,401 | 33.7 | |
| Natural Law | Patrice Thiessen | 7,253 | 3.0 | |
| Libertarian | William Brunner | 5,759 | 2.4 | |
| Republican | Bob Todd (write-in) | 7 | 0.0 | |
| Total votes | 238,333 | 100.0 | ||
| Turnout | {{{votes}}} | |||
| Republican hold | ||||
1998
| Party | Candidate | Votes | % | |
|---|---|---|---|---|
| Republican | Wally Herger (incumbent) | 128,372 | 62.5 | |
| Democratic | Roberts "Rob" Braden | 70,837 | 34.5 | |
| Natural Law | Patrice Thiessen | 6,138 | 3 | |
| Democratic | Stephen F. Scott (write-in) | 20 | 0.01 | |
| Total votes | 205,367 | 100.0 | ||
| Turnout | {{{votes}}} | |||
| Republican hold | ||||
2000
| Party | Candidate | Votes | % | |
|---|---|---|---|---|
| Republican | Wally Herger (incumbent) | 168,172 | 65.8 | |
| Democratic | Stan Morgan | 72,075 | 28.2 | |
| Natural Law | John McDermott | 8,910 | 3.4 | |
| Libertarian | Charles R. Martin | 6,699 | 2.6 | |
| Total votes | 255,856 | 100.0 | ||
| Turnout | {{{votes}}} | |||
| Republican hold | ||||
2002
| Party | Candidate | Votes | % | |
|---|---|---|---|---|
| Republican | Wally Herger (incumbent) | 117,747 | 65.8 | |
| Democratic | Mike Johnson | 52,455 | 29.4 | |
| Natural Law | Patrice Thiessen | 4,860 | 2.7 | |
| Libertarian | Charles R. Martin | 3,923 | 2.1 | |
| Total votes | 178,985 | 100.0 | ||
| Turnout | {{{votes}}} | |||
| Republican hold | ||||
2004
| Party | Candidate | Votes | % | |
|---|---|---|---|---|
| Republican | Wally Herger (incumbent) | 182,119 | 66.9 | |
| Democratic | Mike Johnson | 90,310 | 33.1 | |
| Total votes | 272,429 | 100.0 | ||
| Turnout | {{{votes}}} | |||
| Republican hold | ||||
2006
| Party | Candidate | Votes | % | |
|---|---|---|---|---|
| Republican | Wally Herger (incumbent) | 134,911 | 64.2 | |
| Democratic | Arjinderpal Sekhon | 68,234 | 32.5 | |
| Libertarian | E. Kent Hinesley | 7,057 | 3.3 | |
| Total votes | 210,202 | 100.0 | ||
| Turnout | {{{votes}}} | |||
| Republican hold | ||||
2008
| Party | Candidate | Votes | % | |
|---|---|---|---|---|
| Republican | Wally Herger (incumbent) | 163,459 | 57.9 | |
| Democratic | Jeff Morris | 118,878 | 42.1 | |
| Total votes | 228,356 | 100.00 | ||
| Turnout | {{{votes}}} | |||
| Republican hold | ||||
2010
| Party | Candidate | Votes | % | |
|---|---|---|---|---|
| Republican | Wally Herger (incumbent) | 129,984 | 57.1 | |
| Democratic | Jim Reed | 97,514 | 42.9% | |
| Total votes | 227,498 | 100 | ||
| Republican hold | ||||
2012
| Party | Candidate | Votes | % | |
|---|---|---|---|---|
| Democratic | Jared Huffman | 226,216 | 71.2 | |
| Republican | Daniel W. Roberts | 91,310 | 28.8 | |
| Total votes | 317,526 | 100.0 | ||
| Democratic hold | ||||
2014
| Party | Candidate | Votes | % | |
|---|---|---|---|---|
| Democratic | Jared Huffman (incumbent) | 163,124 | 75.0 | |
| Republican | Dale K Mensing | 54,400 | 25.0 | |
| Total votes | 217,524 | 100.0 | ||
| Democratic hold | ||||
2016
| Party | Candidate | Votes | % | |
|---|---|---|---|---|
| Democratic | Jared Huffman (incumbent) | 254,194 | 76.9 | |
| Republican | Dale K Mensing | 76,572 | 23.1 | |
| Total votes | 330,766 | 100.0 | ||
| Democratic hold | ||||
2018
| Party | Candidate | Votes | % | |
|---|---|---|---|---|
| Democratic | Jared Huffman (incumbent) | 243,081 | 77.0 | |
| Republican | Dale K. Mensing | 72,576 | 23.0 | |
| Total votes | 315,657 | 100.0 | ||
| Turnout | {{{votes}}} | |||
| Democratic hold | ||||
2020
| Party | Candidate | Votes | % | |
|---|---|---|---|---|
| Democratic | Jared Huffman (incumbent) | 294,435 | 75.7 | |
| Republican | Dale K. Mensing | 94,320 | 24.3 | |
| Total votes | 388,755 | 100.0 | ||
| Democratic hold | ||||
2022
| Party | Candidate | Votes | % | |
|---|---|---|---|---|
| Democratic | Jared Huffman (incumbent) | 229,720 | 74.4 | |
| Republican | Douglas Brower | 79,029 | 25.6 | |
| Total votes | 308,749 | 100.0 | ||
| Democratic hold | ||||
References
- "CA 2022 Congressional". Dave's Redistricting. January 4, 2022. Retrieved November 11, 2022.
- US Census
- "2022 Cook PVI: District Map and List". Cook Political Report. Retrieved January 10, 2023.
- Statement of Vote (1990 Governor)
- Statement of Vote (1992 President)
- Statement of Vote (1992 Senate)
- Statement of Vote (1994 Governor)
- Statement of Vote (1994 Senate)
- Statement of Vote (1996 President)
- Statement of Vote (1998 Governor) Archived September 29, 2011, at the Wayback Machine
- Statement of Vote (1998 Senate) Archived September 29, 2011, at the Wayback Machine
- Statement of Vote (2000 President)
- Statement of Vote (2000 Senator)
- Statement of Vote (2002 Governor)
- Statement of Vote (2003 Recall Question)
- Statement of Vote (2003 Governor)
- Statement of Vote (2004 President)
- Statement of Vote (2004 Senator)
- Statement of Vote (2006 Governor)
- Statement of Vote (2006 Senator)
- Statement of Vote (2008 President)
- Statement of Vote (2010 Governor)
- Statement of Vote (2010 Senator)
- Statement of Vote (2012 President)
- Statement of Vote (2012 Senator)
- Statement of Vote (2014 Governor)
- Statement of Vote (2016 President)
- Statement of Vote (2016 Senator)
- Statement of Vote (2018 Governor)
- Statement of Vote (2018 Senator)
- Nir, David. "Daily Kos Elections' presidential results by congressional district for 2020, 2016, and 2012". Daily Kos.
- "Counties by Congressional District for Recall Question" (PDF). sos.ca.gov. September 14, 2021. Retrieved May 2, 2022.
- "Counties by Congressional Districts for Governor" (PDF). sos.ca.gov. November 8, 2022. Retrieved May 4, 2023.
- 1864 election results
- 1867 election results
- 1868 election results
- 1871 election results
- 1872 election results
- 1875 election results
- 1876 election results
- 1879 election results
- Join California
- 1880 election results
- Join California
- 1882 election results
- Join California
- 1884 election results
- 1886 election results
- 1888 election results
- Join California
- 1890 election results
- 1892 election results
- 1894 election results
- 1896 election results
- 1898 election results
- 1900 special election results
- 1900 election results
- Join California
- 1902 election results
- 1904 election results
- 1906 election results
- 1908 election results
- 1910 election results
- 1912 election results
- 1914 election results
- 1916 election results
- 1918 election results
- 1920 election results
- 1922 election results
- 1924 election results
- 1926 special election results
- 1926 election results
- 1928 election results
- 1930 election results
- 1932 election results
- 1934 election results
- 1936 election results
- 1938 election results
- 1940 election results
- 1942 election results
- 1943 special election results
- 1944 election results
- 1946 election results
- 1948 election results
- 1950 election results
- 1952 election results
- 1954 election results
- 1956 election results
- 1958 election results
- 1960 election results
- 1962 election results
- 1964 election results
- 1966 election results
- 1968 election results
- 1970 election results
- 1972 election results
- 1974 election results
- 1976 election results
- 1978 election results
- 1980 election results
- 1982 election results
- 1984 election results
- 1986 election results
- 1988 election results
- 1990 election results
- 1992 election results
- 1994 election results
- 1996 election results
- 1998 election results
- 2000 election results
- 2002 election results
- 2004 election results
- 2006 election results
- 2008 election results
- 2010 election results
- 2012 election results
- 2014 election results
- 2016 election results
- 2018 election results
External links
- GovTrack.us: California's 2nd congressional district
- RAND California Election Returns: District Definitions (out of date)
- California Voter Foundation map - CD02 (out of date)