California's 35th congressional district
California's 35th congressional district is a U.S. congressional district in California. The district is currently represented by Democrat Norma Torres.
| California's 35th congressional district | |||
|---|---|---|---|
Interactive map of district boundaries since January 3, 2023 | |||
| Representative |
| ||
| Population (2022) | 769,910 | ||
| Median household income | $84,692[1] | ||
| Ethnicity |
| ||
| Cook PVI | D+13[2] | ||
.svg.png.webp)
The district is based in the Inland Empire, including the communities of Chino, Eastvale, Fontana, Montclair, Ontario, Pomona, Rancho Cucamonga, and Upland.
Recent results in statewide elections
| Year | Office | Results |
|---|---|---|
| 1990 | Governor[3] | Wilson 60.5% - 33.2% |
| 1992 | President[4] | Clinton 77.8% - 12.9% |
| Senator[5] | Boxer 75.3% - 18.5% | |
| Senator (Special)[6] | Feinstein 79.2% - 15.6% | |
| 1994 | Governor[7] | Brown 67.2% - 29.8% |
| Senator[8] | Feinstein 70.7% - 21.7% | |
| 1996 | President[9] | Clinton 83.8% - 10.9% |
| 1998 | Governor[10] | Davis 87.1% - 10.7% |
| Senator[11] | Boxer 83.8% – 13.7% | |
| 2000 | President[12] | Gore 85.9% - 12.0% |
| Senator[13] | Feinstein 85.9% - 9.7% | |
| 2002 | Governor[14] | Davis 73.6% - 18.6% |
| 2003 | Recall[15][16] | |
| Bustamante 52.3% - 29.8% | ||
| 2004 | President[17] | Kerry 79.0% - 20.0% |
| Senator[18] | Boxer 80.5% - 14.8% | |
| 2006 | Governor[19] | Angelides 67.3% - 27.9% |
| Senator[20] | Feinstein 80.8% - 14.6% | |
| 2008 | President[21] | Obama 84.4% - 14.1% |
| 2010 | Governor[22] | Brown 79.1% - 16.4% |
| Senator[23] | Boxer 79.1% - 16.2% | |
| 2012 | President[24] | Obama 67.4% - 30.6% |
| Senator[25] | Feinstein 68.0% – 32.0% | |
| 2014 | Governor[26] | Brown 60.6% – 39.4% |
| 2016 | President[27] | Clinton 67.7% - 26.9% |
| Senator[28] | Harris 50.2% – 49.8% | |
| 2018 | Governor[29] | Newsom 65.6% – 34.4% |
| Senator[30] | Feinstein 52.1% – 47.9% | |
| 2020 | President[31] | Biden 65.1% - 32.6% |
| 2021 | Recall[32] | |
| 2022 | Governor[33] | Newsom 55.2 - 44.8% |
| Senator | Padilla 57.3 - 42.7% |
Composition
| # | County | Seat | Population |
|---|---|---|---|
| 37 | Los Angeles | Los Angeles | 9,829,544 |
| 65 | Riverside | Riverside | 2,458,395 |
| 71 | San Bernardino | San Bernardino | 2,194,710 |
As of the 2020 redistricting, California's 35th congressional district is located in Southern California, within the Inland Empire. The district covers east Los Angeles County, southwest San Bernardino County, and a small part of west Riverside County.
Los Angeles County is split between this district, the 28th district, the 31st district, and the 38th district. They are partitioned by Highway 60, Phillips Ranch Rd, E Village Loop Rd, Quail Creek Ln, Falcon Ridge Dr, Hidden Valley Rd, Oak Cliff Dr, Willowbrook Ln, Westbrook Ln, La Sierra Dr, Avenida Rancheros, Rancheros Navato Dr, Serra Dr, Alta Mira Pl, Rancho Laguna Dr, W Mission Blvd, W Temple Ave, Pomona Blvd, Valley Blvd, San Bernardino Freeway, Walnut City Parkland, San Bernardino Freeway, Fairplex Dr, Via Verde, Puddingstone Reservoir, McKinley Ave, N Whittle Ave, Arrow Highway, Fulton Rd, Foothill Blvd, Towne Ave, Harrison Ave, Carnegie Ave, W Arrow Highway, Mountain Ave, and E American Ave. The 35th district takes in the city of Pomona.
San Bernardino County is split between this district, the 28th district, the 33rd district, and the 40th district. The 35th, 28th and 33rd are partitioned by W 16th St, E 15th St, Grove Ave, Foothill Blvd, Vineyard Blvd, San Bernardino Rd, Orangewood Dr, Estacia St, Lion St, Highway 66, Helms Ave, Hampshire St, Archibald Ave, N Maple Ave, S Maple Ave, Randall Ave, Alder Ave, Union Pacific Railroad, Slover Ave, Tamarind Ave, Jurupa Ave, 11th St, and Locust Ave. The 35th and 40th are partitioned by Highway 71, Eucalyptus Ave, Peyton Dr, Highway 142, Tupelo Ave, Hazelwood Dr, Pipeline Ave, Los Serranos Blvd, Country Club Dr, Soquel Canyon Parkway, Elinvar Dr, Sapphire Rd, Onyx Rd, Copper Rd, Slate Dr, Butterfield Ranch Rd, Pine Ave, and Chino Valley Freeway. The 35th district takes in Chino, Montclair, Ontario, and the south sides of Rancho Cucamonga, Fontana, and Upland, as well as the Los Serranos neighborhood of Chino Hills.
Riverside County is split between this district and the 41st district. They are partitioned by Chino Creek, Santa Ana River, Chandler St, Archibald Ave, Schleisman Rd, Scholar Way, Citrus Way, Hamner Ave, Corona Freeway, and E Philadelphia St. The 35th district takes in the north side of the city of Eastvale.
List of members representing the district
| Member | Party | Dates | Cong ress(es) |
Electoral history | Counties |
|---|---|---|---|---|---|
| District created January 3, 1963 | |||||
 James B. Utt (Santa Ana) |
Republican | January 3, 1963 – March 1, 1970 |
88th 89th 90th 91st |
Redistricted from the 28th district and re-elected in 1962. Re-elected in 1964. Re-elected in 1966. Re-elected in 1968. Died. |
1963–1969 Orange, San Diego |
| 1969–1973 Orange, San Diego | |||||
| Vacant | March 1, 1970 – June 30, 1970 |
91st | |||
 John G. Schmitz (Santa Ana) |
Republican | June 30, 1970 – January 3, 1973 |
91st 92nd |
Elected to finish Utt's term. Re-elected in 1970. Redistricted to the 39th district and lost. | |
 Glenn M. Anderson (Los Angeles) |
Democratic | January 3, 1973 – January 3, 1975 |
93rd | Redistricted from the 17th district and re-elected in 1972. Redistricted to the 32nd district. |
1973–1975 Los Angeles |
 James F. Lloyd (West Covina) |
Democratic | January 3, 1975 – January 3, 1981 |
94th 95th 96th |
Elected in 1974. Re-elected in 1976. Re-elected in 1978. Lost re-election. |
1975–1983 Los Angeles, Southwestern San Bernardino |
 David Dreier (La Verne) |
Republican | January 3, 1981 – January 3, 1983 |
97th | Elected in 1980. Redistricted to the 33rd district. | |
 Jerry Lewis (Redlands) |
Republican | January 3, 1983 – January 3, 1993 |
98th 99th 100th 101st 102nd |
Redistricted from the 37th district and re-elected in 1982. Re-elected in 1984. Re-elected in 1986. Re-elected in 1988. Re-elected in 1990. Redistricted to the 40th district. |
1983–1993 San Bernardino |
 Maxine Waters (Los Angeles) |
Democratic | January 3, 1993 – January 3, 2013 |
103rd 104th 105th 106th 107th 108th 109th 110th 111th 112th |
Redistricted from the 29th district and re-elected in 1992. Re-elected in 1994. Re-elected in 1996. Re-elected in 1998. Re-elected in 2000. Re-elected in 2002. Re-elected in 2004. Re-elected in 2006. Re-elected in 2008. Re-elected in 2010. Redistricted to the 43rd district. |
1993–2003 South Los Angeles |
2003–2013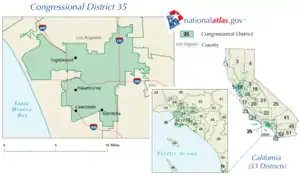 South Los Angeles | |||||
 Gloria Negrete McLeod (Chino) |
Democratic | January 3, 2013 – January 3, 2015 |
113th | Elected in 2012. Retired to run for the San Bernardino County Board of Supervisors |
2013–2023.tif.png.webp) Inland Empire (Fontana, Ontario, and Pomona) |
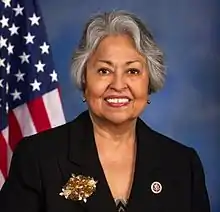
.jpeg.webp) Norma Torres (Pomona) |
Democratic | January 3, 2015 – present |
114th 115th 116th 117th 118th |
Elected in 2014. Re-elected in 2016. Re-elected in 2018. Re-elected in 2020. Re-elected in 2022. | |
2023–present_(new_version).svg.png.webp) Inland Empire (Fontana, Ontario, and Pomona) | |||||
Election results
|
1962 • 1964 • 1966 • 1968 • 1970 (Special) • 1970 • 1972 • 1974 • 1976 • 1978 • 1980 • 1982 • 1984 • 1986 • 1988 • 1990 • 1992 • 1994 • 1996 • 1998 • 2000 • 2002 • 2004 • 2006 • 2008 • 2010 • 2012 • 2014 • 2016 • 2018 • 2020 • 2022 |
1962
| Party | Candidate | Votes | % | |
|---|---|---|---|---|
| Republican | James B. Utt (Incumbent) | 133,737 | 68.5 | |
| Democratic | Burton Shamsky | 61,395 | 31.5 | |
| Total votes | 195,132 | 100.0 | ||
| Republican hold | ||||
1964
| Party | Candidate | Votes | % | |
|---|---|---|---|---|
| Republican | James B. Utt (Incumbent) | 167,791 | 65.0 | |
| Democratic | Paul B. Carpenter | 90,295 | 35.0 | |
| Total votes | 258,086 | 100.0 | ||
| Republican hold | ||||
1966
| Party | Candidate | Votes | % | |
|---|---|---|---|---|
| Republican | James B. Utt (Incumbent) | 189,582 | 73.1 | |
| Democratic | Thomas B. Lenhart | 69,873 | 26.9 | |
| Total votes | 259,455 | 100.0 | ||
| Republican hold | ||||
1968
| Party | Candidate | Votes | % | |
|---|---|---|---|---|
| Republican | James B. Utt (Incumbent) | 212,684 | 72.5 | |
| Democratic | Thomas B. Lenhart | 73,778 | 25.1 | |
| American Independent | Annie McDonald | 7,000 | 2.4 | |
| Total votes | 293,462 | 100.0 | ||
| Republican hold | ||||
1970 (Special)
| Party | Candidate | Votes | % | |
|---|---|---|---|---|
| Republican | John G. Schmitz | 67,209 | 72.4 | |
| Democratic | David N. Hartman | 25,655 | 27.6 | |
| Total votes | 92,864 | 100.0 | ||
| Republican hold | ||||
1970
| Party | Candidate | Votes | % | |
|---|---|---|---|---|
| Republican | John G. Schmitz (Incumbent) | 192,765 | 67.0 | |
| Democratic | Thomas B. Lenhart | 87,019 | 30.3 | |
| Peace and Freedom | Francis R. Halpern | 7,742 | 2.7 | |
| Total votes | 287,526 | 100.0 | ||
| Republican hold | ||||
1972
| Party | Candidate | Votes | % | |
|---|---|---|---|---|
| Democratic | Glenn M. Anderson (Incumbent) | 103,912 | 74.8 | |
| Republican | Vernon E. Brown | 35,018 | 25.2 | |
| Total votes | 138,930 | 100.0 | ||
| Democratic hold | ||||
1974
| Party | Candidate | Votes | % | |||
|---|---|---|---|---|---|---|
| Democratic | James F. Lloyd | 60,709 | 50.3 | |||
| Republican | Victor Veysey (Incumbent) | 60,102 | 49.7 | |||
| Total votes | 120,811 | 100.0 | ||||
| Democratic gain from Republican | ||||||
1976
| Party | Candidate | Votes | % | |
|---|---|---|---|---|
| Democratic | James F. Lloyd (Incumbent) | 87,472 | 53.3 | |
| Republican | Louis Brutocao | 76,765 | 46.7 | |
| Total votes | 164,237 | 100.0 | ||
| Democratic hold | ||||
1978
| Party | Candidate | Votes | % | |
|---|---|---|---|---|
| Democratic | James F. Lloyd (Incumbent) | 80,388 | 54.0 | |
| Republican | David Dreier | 68,442 | 46.0 | |
| Total votes | 148,830 | 100.0 | ||
| Democratic hold | ||||
1980
| Party | Candidate | Votes | % | |||
|---|---|---|---|---|---|---|
| Republican | David Dreier | 100,743 | 51.8 | |||
| Democratic | James F. Lloyd (Incumbent) | 88,279 | 45.4 | |||
| Peace and Freedom | James Michael "Mike" Noonan | 5,492 | 2.8 | |||
| Total votes | 194,514 | 100.0 | ||||
| Republican gain from Democratic | ||||||
1982
| Party | Candidate | Votes | % | |
|---|---|---|---|---|
| Republican | Jerry Lewis (Incumbent) | 112,786 | 68.3 | |
| Democratic | Robert E. Erwin | 52,349 | 31.7 | |
| Total votes | 165,135 | 100.0 | ||
| Republican hold | ||||
1984
| Party | Candidate | Votes | % | |
|---|---|---|---|---|
| Republican | Jerry Lewis (Incumbent) | 176,477 | 85.5 | |
| Peace and Freedom | Kevin Akin | 29,990 | 14.5 | |
| Total votes | 206,467 | 100.0 | ||
| Republican hold | ||||
1986
| Party | Candidate | Votes | % | |
|---|---|---|---|---|
| Republican | Jerry Lewis (Incumbent) | 127,235 | 76.9 | |
| Democratic | Robert J. "Sarge" Hall | 38,322 | 23.1 | |
| Total votes | 165,557 | 100.0 | ||
| Republican hold | ||||
1988
| Party | Candidate | Votes | % | |
|---|---|---|---|---|
| Republican | Jerry Lewis (Incumbent) | 181,203 | 70.4 | |
| Democratic | Paul Sweeney | 71,186 | 27.7 | |
| Libertarian | Jeff Shuman | 4,879 | 1.9 | |
| Total votes | 257,268 | 100.0 | ||
| Republican hold | ||||
1990
| Party | Candidate | Votes | % | |
|---|---|---|---|---|
| Republican | Jerry Lewis (Incumbent) | 121,602 | 60.6 | |
| Democratic | Barry Borton | 66,100 | 32.9 | |
| Libertarian | Jerry Johnson | 13,020 | 6.5 | |
| Total votes | 200,722 | 100.0 | ||
| Republican hold | ||||
1992
| Party | Candidate | Votes | % | |
|---|---|---|---|---|
| Democratic | Maxine Waters (Incumbent) | 102,941 | 82.5 | |
| Republican | Nate Truman | 17,417 | 14.0 | |
| Peace and Freedom | Alice Mae Miles | 2,797 | 2.2 | |
| Libertarian | Carin Rogers | 1,618 | 1.3 | |
| American Independent | Gordon Mego (write-in) | 3 | 0.0 | |
| Total votes | 124,776 | 100.0 | ||
| Democratic hold | ||||
1994
| Party | Candidate | Votes | % | |
|---|---|---|---|---|
| Democratic | Maxine Waters (Incumbent) | 65,688 | 78.1 | |
| Republican | Nate Truman | 18,930 | 21.9 | |
| American Independent | Gordon Mego (write-in) | 3 | 0.0 | |
| Total votes | 84,521 | 100.0 | ||
| Democratic hold | ||||
1996
| Party | Candidate | Votes | % | |
|---|---|---|---|---|
| Democratic | Maxine Waters (Incumbent) | 92,762 | 85.6 | |
| Republican | Eric Carlson | 13,116 | 12.0 | |
| American Independent | Gordon Mego | 2,610 | 2.4 | |
| Total votes | 108,488 | 100.0 | ||
| Democratic hold | ||||
1998
| Party | Candidate | Votes | % | |
|---|---|---|---|---|
| Democratic | Maxine Waters (Incumbent) | 78,732 | 89.3 | |
| American Independent | Gordon Michael Mego | 9,413 | 10.7 | |
| Total votes | 88,145 | 100.0 | ||
| Democratic hold | ||||
2000
| Party | Candidate | Votes | % | |
|---|---|---|---|---|
| Democratic | Maxine Waters (Incumbent) | 100,569 | 86.6 | |
| Republican | Carl McGill | 12,582 | 10.9 | |
| American Independent | Gordon Michael Mego | 1,911 | 1.6 | |
| Natural Law | Rick Dunstan | 1,153 | 0.9 | |
| Total votes | 116,215 | 100.0 | ||
| Democratic hold | ||||
2002
| Party | Candidate | Votes | % | |
|---|---|---|---|---|
| Democratic | Maxine Waters (Incumbent) | 72,401 | 77.6 | |
| Republican | Ross Moen | 18,094 | 19.3 | |
| American Independent | Gordon Michael Mego | 2,912 | 3.1 | |
| Total votes | 93,407 | 100.0 | ||
| Democratic hold | ||||
2004
| Party | Candidate | Votes | % | |
|---|---|---|---|---|
| Democratic | Maxine Waters (Incumbent) | 125,949 | 80.6 | |
| Republican | Ross Moen | 23,591 | 15.1 | |
| American Independent | Gordon Michael Mego | 3,440 | 2.2 | |
| Libertarian | Charles Tate | 3,427 | 2.1 | |
| Total votes | 115,807 | 100.0 | ||
| Democratic hold | ||||
2006
| Party | Candidate | Votes | % | |
|---|---|---|---|---|
| Democratic | Maxine Waters (Incumbent) | 82,498 | 83.8 | |
| American Independent | Gordon Michael Mego | 8,343 | 8.5 | |
| Libertarian | Paul T. Ireland | 7,665 | 7.7 | |
| Total votes | 97,506 | 100.0 | ||
| Democratic hold | ||||
2008
| Party | Candidate | Votes | % | |
|---|---|---|---|---|
| Democratic | Maxine Waters (Incumbent) | 150,778 | 82.6 | |
| Republican | Ted Hayes | 24,169 | 13.2 | |
| Libertarian | Herb Peters | 7,632 | 4.2 | |
| Total votes | 182,579 | 100.0 | ||
| Democratic hold | ||||
2010
| Party | Candidate | Votes | % | |
|---|---|---|---|---|
| Democratic | Maxine Waters (Incumbent) | 98,131 | 79.3 | |
| Republican | K. Bruce Brown | 25,561 | 20.7 | |
| Total votes | 123,692 | 100.0 | ||
| Democratic hold | ||||
2012
| Party | Candidate | Votes | % | |
|---|---|---|---|---|
| Democratic | Gloria Negrete McLeod | 79,698 | 55.9 | |
| Democratic | Joe Baca (Incumbent) | 62,982 | 44.1 | |
| Total votes | 142,680 | 100.0 | ||
| Democratic hold | ||||
2014
| Party | Candidate | Votes | % | |
|---|---|---|---|---|
| Democratic | Norma Torres | 39,502 | 63.5 | |
| Democratic | Christina Gagnier | 22,753 | 36.5 | |
| Total votes | 62,255 | 100.0 | ||
| Democratic hold | ||||
2016
| Party | Candidate | Votes | % | |
|---|---|---|---|---|
| Democratic | Norma Torres (Incumbent) | 124,044 | 72.4 | |
| Republican | Tyler Fischella | 47,309 | 27.6 | |
| Total votes | 171,353 | 100.0 | ||
| Democratic hold | ||||
2018
| Party | Candidate | Votes | % | |
|---|---|---|---|---|
| Democratic | Norma Torres (Incumbent) | 103,420 | 69.4 | |
| Republican | Christian Leonel Valiente | 45,604 | 30.6 | |
| Total votes | 149,024 | 100.0 | ||
| Democratic hold | ||||
2020
| Party | Candidate | Votes | % | |
|---|---|---|---|---|
| Democratic | Norma Torres (Incumbent) | 169,405 | 69.3 | |
| Republican | Mike Cargile | 74,941 | 30.7 | |
| Total votes | 244,346 | 100 | ||
| Democratic hold | ||||
2022
| Party | Candidate | Votes | % | |
|---|---|---|---|---|
| Democratic | Norma Torres (Incumbent) | 75,121 | 57.4 | |
| Republican | Mike Cargile | 55,832 | 42.6 | |
| Total votes | 130,953 | 100.0 | ||
| Democratic hold | ||||
Historical district boundaries
From 2003 to 2013, the district was based in Los Angeles County. The district was composed of parts of the Westchester District of the City of Los Angeles and the cities of Inglewood, Hawthorne, Gardena and Florence-Graham, as well as some adjacent areas.
References
- US Census
- "2022 Cook PVI: District Map and List". Cook Political Report. Retrieved January 10, 2023.
- Statement of Vote (1990 Governor)
- Statement of Vote (1992 President)
- Statement of Vote (1992 Senate)
- Statement of Vote (1992 Senate)
- Statement of Vote (1994 Governor)
- Statement of Vote (1994 Senate)
- Statement of Vote (1996 President)
- Statement of Vote (1998 Governor) Archived September 29, 2011, at the Wayback Machine
- Statement of Vote (1998 Senate) Archived September 29, 2011, at the Wayback Machine
- Statement of Vote (2000 President)
- Statement of Vote (2000 Senator)
- Statement of Vote (2002 Governor)
- Statement of Vote (2003 Recall Question)
- Statement of Vote (2003 Governor)
- Statement of Vote (2004 President)
- Statement of Vote (2004 Senator)
- Statement of Vote (2006 Governor)
- Statement of Vote (2006 Senator)
- Statement of Vote (2008 President)
- Statement of Vote (2010 Governor)
- Statement of Vote (2010 Senator)
- Statement of Vote (2012 President)
- Statement of Vote (2012 Senator)
- Statement of Vote (2014 Governor)
- Statement of Vote (2016 President)
- Statement of Vote (2016 Senator)
- Statement of Vote (2018 Governor)
- Statement of Vote (2018 Senator)
- "Daily Kos Elections' presidential results by congressional district for 2020, 2016, and 2012".
- "Counties by Congressional District for Recall Question" (PDF). sos.ca.gov. September 14, 2021. Retrieved May 2, 2022.
- "Counties by Congressional Districts for Governor" (PDF). sos.ca.gov. November 8, 2022. Retrieved May 4, 2023.
- 1962 election results
- 1964 election results
- 1966 election results
- 1968 election results
- 1970 special election results
- 1970 election results
- 1972 election results
- 1974 election results
- 1976 election results
- 1978 election results
- 1980 election results
- 1982 election results
- 1984 election results
- 1986 election results
- 1988 election results
- 1990 election results
- 1992 election results
- 1994 election results
- 1996 election results
- 1998 election results
- 2000 election results
- 2002 election results
- 2004 election results
- 2006 election results
- 2008 election results
- 2010 election results
- 2012 election results
- 2014 election results
- 2016 election results
- 2018 election results