California's 38th congressional district
California's 38th congressional district is a congressional district in the U.S. state of California based in suburban eastern Los Angeles County and Orange County, California. The district is currently represented by Democrat Linda Sánchez.
| California's 38th congressional district | |||
|---|---|---|---|
Interactive map of district boundaries since January 3, 2023 | |||
| Representative |
| ||
| Population (2022) | 720,021[1] | ||
| Median household income | $90,687[1] | ||
| Ethnicity |
| ||
| Cook PVI | D+14[2] | ||
.svg.png.webp)
The district covers several cities in southeastern Los Angeles and San Gabriel Valley areas including the cities of: Diamond Bar, Industry, La Habra Heights, La Mirada, Montebello, Norwalk, Pico Rivera, Santa Fe Springs, Walnut, and Whittier.
As well the unincorporated communities of: Rowland Heights, Hacienda Heights, Los Nietos, East Whittier, North Whittier, and South Whittier.
A small portion of Pomona and the Orange County city of La Habra are also included in the district. The major cities generally reflect a Hispanic majority, while Diamond Bar and Walnut have an Asian-American majority.
Recent results in statewide elections
| Year | Office | Results |
|---|---|---|
| 1990 | Governor[3] | Wilson 57.4% - 36.6% |
| 1992 | President[4] | Clinton 44.6% - 33.5% |
| Senator[5] | Herschensohn 46.3% - 45.1% | |
| Senator (Special)[5] | Feinstein 50.9% - 39.5% | |
| 1994 | Governor[6] | Wilson 57.3% - 38.6% |
| Senator[7] | Huffington 47.8% – 43.1% | |
| 1996 | President[8] | Clinton 52.8% - 35.8% |
| 1998 | Governor[9] | Davis 58.3% - 38.6% |
| Senator[10] | Boxer 55.1% - 41.2% | |
| 2000 | President[11] | Gore 57.9% - 37.3% |
| Senator[12] | Feinstein 59.6% - 33.3% | |
| 2002 | Governor[13] | Davis 62.3 - 28.7% |
| 2003 | Recall[14][15] | |
| Bustamante 47.1% - 37.9% | ||
| 2004 | President[16] | Kerry 65.3% - 33.6% |
| Senator[17] | Boxer 70.8% - 23.4% | |
| 2006 | Governor[18] | Angelides 58.3% - 37.1% |
| Senator[19] | Feinstein 71.9% - 23.0% | |
| 2008 | President[20] | Obama 72.3% - 26.6% |
| 2010 | Governor[21] | Brown 68.1% - 25.9% |
| Senator[22] | Boxer 67.1% - 26.4% | |
| 2012 | President[23] | Obama 64.9% - 33.0% |
| Senator[24] | Feinstein 66.6% - 33.4% | |
| 2014 | Governor[25] | Brown 59.7% – 40.3% |
| 2016 | President[26] | Clinton 67.0% - 27.4% |
| Senator[27] | Sanchez 50.9% - 49.1% | |
| 2018 | Governor[28] | Newsom 65.3% – 34.7% |
| Senator[29] | Feinstein 53.7% – 46.3% | |
| 2020 | President[30] | Biden 65.6% - 32.3% |
| 2021 | Recall[31] | |
| 2022 | Governor[32] | Newsom 57.7 - 42.3% |
| Senator | Padilla 59.7 - 40.3% |
Notes
Composition
| # | County | Seat | Population |
|---|---|---|---|
| 37 | Los Angeles | Los Angeles | 9,829,544 |
| 59 | Orange | Santa Ana | 3,167,809 |
As of the 2020 redistricting, California's 38th congressional district is located in Southern California. It takes up part of Southeast Los Angeles County and the city of La Habra in Orange County.
Los Angeles County is split between this district, the 28th district, the 31st district, the 35th district, the 35th district, the 42nd district, and the 45th district. The 38th, 28th, 31st, and 35th are partitioned by E Pomona Blvd, Potrero Grande Dr, Arroyo Dr, Hill Dr, Montebello Blvd, N San Gabriel Blvd, Walnut Grove Ave, Whittier Narrows Recreation Area, N Lexington-Gallatin Rd, N Durfree Ave, E Thienes Ave, E Rush St, N Burkett Rd, Cunningham Dr, Eaglemont Dr, Oakman Dr, Arciero Dr, Grossmont Dr, Workman Mill Rd, Bunbury Dr, Fontenoy Ave, Ankerton, Whittier Woods Circle, Union Pacific Railroad, San Gabriel Freeway, N Peck Rd, Mission Mill Rd, Rose Hills Rd, Wildwood Dr, Clark Ave, San Jose Creek, Turnbull Canyon Rd, E Gale Ave, Pomona Freeway, Colima Rd, E Walnut Dr N, Nogales St, E Walnut Dr S, Fairway Dr, E Valley Blvd, Calle Baja, La Puente Rd, S Sentous Ave, N Nogales St, Amar Rd, Walnut City Parkland, San Bernardino Freeway, Fairplex Dr, Via Verde, Puddingstone Reservoir, McKinley Ave, N Whittle Ave, Arrow Highway, Fulton Rd, and Foothill Blvd.
The 38th, 34th and 42nd are partitioned by Simmons Ave, W Beverly Blvd, Via Corona St, Repetto Ave, Allston St, W Northside Dr, Yates Ave, E Acco St, 6866 E Washington Blvd-2808 Vail Ave, S 14th St, AT & SF Railway, Church Rd, Telegraph Rd, Rio Hondo River, Veterans Memorial Park, Suva St, Guatemala Ave, Shady Oak Dr, Coolgrove Dr, Gallatin Rd, Samoline Ave, Paramount Blvd, Arrington Ave, Suva St, Charloma Dr, Lubet St, Highway 5, and the San Gabriel River.
The 38th district takes in the cities of Whittier, Montebello, Norwalk, Pico Rivera, Diamond Bar, La Mirada, Walnut, and Santa Fe Springs, as well as the census-designated place Hacienda Heights.
Cities & CDP with 10,000 or more people
- Los Angeles - 3,898,747
- Norwalk - 102,773
- Whittier - 87,306
- Montebello - 62,640
- Pico Rivera - 62,088
- La Habra - 60,513
- Hacienda Heights - 55,386
- Diamond Bar - 55,072
- La Mirada - 48,008
- Walnut - 28,430
- Santa Fe Springs - 19,219
List of members representing the district
| Member | Party | Dates | Cong– ress |
Electoral history | Counties |
|---|---|---|---|---|---|
| District created January 3, 1963 | |||||
 Patrick M. Martin (Riverside) |
Republican | January 3, 1963 – January 3, 1965 |
88th | Elected in 1962. Lost re-election. |
1963–1969 Imperial County Riverside County |
 John V. Tunney (Riverside) |
Democratic | January 3, 1965 – January 2, 1971 |
89th 90th 91st |
Elected in 1964. Re-elected in 1966. Re-elected in 1968. Resigned to become a U.S. senator. | |
| 1969–1973 Imperial County Riverside County | |||||
| Vacant | January 2, 1971 – January 3, 1971 |
91st | |||
 Victor Veysey (Brawley) |
Republican | January 3, 1971 – January 3, 1973 |
92nd | Elected in 1970. Redistricted to the 43rd district. | |
 George Brown Jr. (Colton) |
Democratic | January 3, 1973 – January 3, 1975 |
93rd | Elected in 1972. Redistricted to the 36th district. |
1973–1975 San Bernardino County (Inland Empire) |
 Jerry M. Patterson (Santa Ana) |
Democratic | January 3, 1975 – January 3, 1985 |
94th 95th 96th 97th 98th |
Elected in 1974. Re-elected in 1976. Re-elected in 1978. Re-elected in 1980. Re-elected in 1982. Lost re-election. |
1975–1983 North Central Orange County (Anaheim) |
| 1983–1993 Northwest Orange County (Garden Grove Santa Ana) | |||||
 Bob Dornan (Garden Grove) |
Republican | January 3, 1985 – January 3, 1993 |
99th 100th 101st 102nd |
Elected in 1984. Re-elected in 1986. Re-elected in 1988. Re-elected in 1990. Redistricted to the 46th district. | |
 Steve Horn (Long Beach) |
Republican | January 3, 1993 – January 3, 2003 |
103rd 104th 105th 106th 107th |
Elected in 1992. Re-elected in 1994. Re-elected in 1996. Re-elected in 1998. Re-elected in 2000. Retired. |
1993–2003 Los Angeles County (Bellflower Long Beach) |
 Grace Napolitano (Norwalk) |
Democratic | January 3, 2003 – January 3, 2013 |
108th 109th 110th 111th 112th |
Redistricted from the 34th district and re-elected in 2002. Re-elected in 2004. Re-elected in 2006. Re-elected in 2008. Re-elected in 2010. Redistricted to the 32nd district. |
2003–2013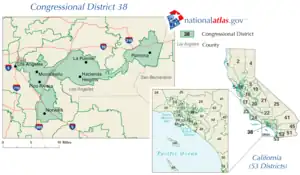 San Gabriel Valley, Los Angeles County (East L.A., Norwalk, Pomona, La Puente, Hacienda Heights) |
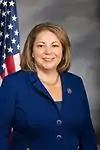 Linda Sánchez (Whittier) |
Democratic | January 3, 2013 – present |
113th 114th 115th 116th 117th 118th |
Redistricted from the 39th district and re-elected in 2012. Re-elected in 2014. Re-elected in 2016. Re-elected in 2018. Re-elected in 2020. Re-elected in 2022. |
2013–2023.tif.png.webp) Los Angeles County Orange County (Norwalk, Whittier, La Palma) |
2023–present_(new_version).svg.png.webp) Los Angeles County Orange County (Diamond Bar, Norwalk, Whittier) | |||||
Election results
|
1962 • 1964 • 1966 • 1968 • 1970 • 1972 • 1974 • 1976 • 1978 • 1980 • 1982 • 1984 • 1986 • 1988 • 1990 • 1992 • 1994 • 1996 • 1998 • 2000 • 2002 • 2004 • 2006 • 2008 • 2010 • 2012 • 2014 • 2016 • 2018 • 2020 • 2022 |
1962
| Party | Candidate | Votes | % | |||
|---|---|---|---|---|---|---|
| Republican | Patrick M. Martin | 68,583 | 55.9 | |||
| Democratic | Dalip Singh Saund (incumbent) | 54,022 | 44.1 | |||
| Total votes | 122,605 | 100.0 | ||||
| Republican gain from Democratic | ||||||
1964
| Party | Candidate | Votes | % | |||
|---|---|---|---|---|---|---|
| Democratic | John V. Tunney | 85,661 | 52.8 | |||
| Republican | Patrick M. Martin (incumbent) | 76,525 | 47.2 | |||
| Total votes | 162,186 | 100.0 | ||||
| Democratic gain from Republican | ||||||
1966
| Party | Candidate | Votes | % | |
|---|---|---|---|---|
| Democratic | John V. Tunney (incumbent) | 83,216 | 54.5 | |
| Republican | Robert R. Barry | 69,444 | 45.5 | |
| Total votes | 152,660 | 100.0 | ||
| Democratic hold | ||||
1968
| Party | Candidate | Votes | % | |
|---|---|---|---|---|
| Democratic | John V. Tunney (incumbent) | 121,025 | 62.8 | |
| Republican | Robert O. Hunter | 68,196 | 35.4 | |
| American Independent | James H. Griffin | 2,415 | 1.2 | |
| Peace and Freedom | Terese A. Karmel | 1,205 | 0.6 | |
| Total votes | 192,841 | 100.0 | ||
| Democratic hold | ||||
1970
| Party | Candidate | Votes | % | |||
|---|---|---|---|---|---|---|
| Republican | Victor Veysey | 87,479 | 49.8 | |||
| Democratic | David A. Tunno | 85,684 | 48.8 | |||
| American Independent | William E. Pasley | 2,481 | 3.4 | |||
| Total votes | 175,644 | 100.0 | ||||
| Republican gain from Democratic | ||||||
1972
| Party | Candidate | Votes | % | |
|---|---|---|---|---|
| Democratic | George Brown, Jr. | 77,776 | 56.3 | |
| Republican | Howard J. Snider | 60,379 | 43.7 | |
| Total votes | 138,155 | 100.0 | ||
| Democratic hold | ||||
1974
| Party | Candidate | Votes | % | |||
|---|---|---|---|---|---|---|
| Democratic | Jerry M. Patterson | 67,299 | 54.0 | |||
| Republican | David Rehmann | 51,509 | 41.3 | |||
| American Independent | Lee R. Rayburn | 3,991 | 3.2 | |||
| Peace and Freedom | Larry B. Kallenberger | 1,851 | 1.5 | |||
| Total votes | 124,650 | 100.0 | ||||
| Democratic gain from Republican | ||||||
1976
| Party | Candidate | Votes | % | |
|---|---|---|---|---|
| Democratic | Jerry M. Patterson (incumbent) | 103,317 | 63.6 | |
| Republican | James "Jim" Combs | 59,092 | 36.4 | |
| Total votes | 162,409 | 100.0 | ||
| Democratic hold | ||||
1978
| Party | Candidate | Votes | % | |
|---|---|---|---|---|
| Democratic | Jerry M. Patterson (incumbent) | 75,471 | 58.6 | |
| Republican | Dan Goedeke | 53,298 | 41.4 | |
| Total votes | 128,769 | 100.0 | ||
| Democratic hold | ||||
1980
| Party | Candidate | Votes | % | |
|---|---|---|---|---|
| Democratic | Jerry M. Patterson (incumbent) | 91,880 | 55.5 | |
| Republican | Art Jacobson | 66,256 | 40.0 | |
| Libertarian | Charles E. "Chuck" Heiser | 7,301 | 4.5 | |
| Total votes | 165,437 | 100.0 | ||
| Democratic hold | ||||
1982
| Party | Candidate | Votes | % | |||
|---|---|---|---|---|---|---|
| Democratic | Jerry M. Patterson (incumbent) | 73,914 | 52.4 | |||
| Republican | William F. "Bill" Dohr | 61,279 | 43.4 | |||
| Libertarian | Anita K. Barr | 5,989 | 4.2 | |||
| Total votes | 141,182 | 100.0 | ||||
| Republican gain from Democratic | ||||||
1984
| Party | Candidate | Votes | % | |||
|---|---|---|---|---|---|---|
| Republican | Bob Dornan | 86,545 | 53.2 | |||
| Democratic | Jerry M. Patterson (incumbent) | 73,231 | 45.0 | |||
| Peace and Freedom | Michael Schuyles Bright | 3,021 | 1.8 | |||
| Total votes | 162,797 | 100.0 | ||||
| Republican gain from Democratic | ||||||
1986
| Party | Candidate | Votes | % | |
|---|---|---|---|---|
| Republican | Bob Dornan (incumbent) | 66,032 | 55.3 | |
| Democratic | Richard H. Robinson | 50,625 | 42.4 | |
| Libertarian | Lee Connelly | 2,807 | 2.3 | |
| Total votes | 119,464 | 100.0 | ||
| Republican hold | ||||
1988
| Party | Candidate | Votes | % | |
|---|---|---|---|---|
| Republican | Bob Dornan (incumbent) | 87,690 | 59.5 | |
| Democratic | Jerry Yudelson | 52,399 | 35.6 | |
| Libertarian | Bruce McKay | 3,733 | 2.5 | |
| Peace and Freedom | Frank German | 3,547 | 2.4 | |
| Total votes | 147,369 | 100.0 | ||
| Republican hold | ||||
1990
| Party | Candidate | Votes | % | |
|---|---|---|---|---|
| Republican | Bob Dornan (incumbent) | 60,561 | 58.1 | |
| Democratic | Barbara Jackson | 43,693 | 41.9 | |
| Total votes | 104,254 | 100.0 | ||
| Republican hold | ||||
1992
| Party | Candidate | Votes | % | |||
|---|---|---|---|---|---|---|
| Republican | Steve Horn | 92,038 | 48.6 | |||
| Democratic | Evan Anderson Braude | 82,108 | 43.4 | |||
| Peace and Freedom | Paul Burton | 8,391 | 4.4 | |||
| Libertarian | Blake Ashley | 6,756 | 3.6 | |||
| Independent | Brown (write-in) | 14 | 0.0 | |||
| Independent | Venable (write-in) | 14 | 0.0 | |||
| Total votes | 189,321 | 100.0 | ||||
| Republican gain from Democratic | ||||||
1994
| Party | Candidate | Votes | % | |
|---|---|---|---|---|
| Republican | Steve Horn (incumbent) | 85,225 | 58.5 | |
| Democratic | Peter Mathews | 53,681 | 36.8 | |
| Libertarian | Lester W. Mueller | 3,795 | 2.6 | |
| Peace and Freedom | Richard K. Green | 2,995 | 2.1 | |
| No party | Duke (write-in) | 73 | 0.0 | |
| Total votes | 145,769 | 100.0 | ||
| Republican hold | ||||
1996
| Party | Candidate | Votes | % | |
|---|---|---|---|---|
| Republican | Steve Horn (incumbent) | 88,136 | 52.6 | |
| Democratic | Rick Zbur | 71,627 | 42.8 | |
| Green | William Yeager | 4,610 | 2.7 | |
| Libertarian | Paul Gautreau | 3,272 | 1.9 | |
| Total votes | 195,545 | 100.0 | ||
| Republican hold | ||||
1998
| Party | Candidate | Votes | % | |
|---|---|---|---|---|
| Republican | Steve Horn (incumbent) | 88,136 | 52.9 | |
| Democratic | Peter Mathews | 71,627 | 44.3 | |
| Libertarian | David Bowers | 3,705 | 2.8 | |
| Republican | Margherita Underhill (write-in) | 17 | 0.0 | |
| Total votes | 163,485 | 100.0 | ||
| Republican hold | ||||
2000
| Party | Candidate | Votes | % | |
|---|---|---|---|---|
| Republican | Steve Horn (incumbent) | 87,266 | 48.5 | |
| Democratic | Gerrie Shcipske | 85,498 | 47.5 | |
| Natural Law | Karen Blasdell-Wilkinson | 3,744 | 2.0 | |
| Libertarian | Jack Neglia | 3,614 | 2.0 | |
| Total votes | 180,122 | 100.0 | ||
| Republican hold | ||||
2002
| Party | Candidate | Votes | % | |
|---|---|---|---|---|
| Democratic | Grace Napolitano (incumbent) | 62,600 | 71.2 | |
| Republican | Alex A. Burrola | 23,126 | 26.2 | |
| Libertarian | Al Cuperus | 2,301 | 2.6 | |
| Total votes | 88,027 | 100.0 | ||
| Democratic hold | ||||
2004
| Party | Candidate | Votes | % | |
|---|---|---|---|---|
| Democratic | Grace Napolitano (incumbent) | 116,851 | 100.0 | |
| Democratic hold | ||||
2006
| Party | Candidate | Votes | % | |
|---|---|---|---|---|
| Democratic | Grace Napolitano (incumbent) | 75,181 | 75.4 | |
| Republican | Sidney W. Street | 24,620 | 24.6 | |
| Total votes | 99,801 | 100.0 | ||
| Democratic hold | ||||
2008
| Party | Candidate | Votes | % | |
|---|---|---|---|---|
| Democratic | Grace Napolitano (incumbent) | 130,211 | 81.7 | |
| Libertarian | Christopher M. Agrella | 29,113 | 18.3 | |
| Total votes | 159,324 | 100.0 | ||
| Democratic hold | ||||
2010
| Party | Candidate | Votes | % | |
|---|---|---|---|---|
| Democratic | Grace Napolitano (incumbent) | 85,459 | 73.4 | |
| Republican | Robert Vaughn | 30,883 | 26.6 | |
| Total votes | 116,342 | 100.00 | ||
| Democratic hold | ||||
2012
| Party | Candidate | Votes | % | |
|---|---|---|---|---|
| Democratic | Linda Sánchez (incumbent) | 145,280 | 67.5 | |
| Republican | Benjamin Campos | 69,807 | 32.5 | |
| Total votes | 215,087 | 100.0 | ||
| Democratic hold | ||||
2014
| Party | Candidate | Votes | % | |
|---|---|---|---|---|
| Democratic | Linda Sánchez (incumbent) | 58,192 | 59.1 | |
| Republican | Benjamin Campos | 40,288 | 40.9 | |
| Total votes | 98,480 | 100.0 | ||
| Democratic hold | ||||
2016
| Party | Candidate | Votes | % | |
|---|---|---|---|---|
| Democratic | Linda Sánchez (incumbent) | 163,590 | 70.5 | |
| Republican | Ryan Downing | 68,524 | 29.5 | |
| Total votes | 232,114 | 100.0 | ||
| Democratic hold | ||||
2018
| Party | Candidate | Votes | % | |
|---|---|---|---|---|
| Democratic | Linda Sánchez (incumbent) | 139,188 | 68.9 | |
| Republican | Ryan Downing | 62,968 | 31.1 | |
| Total votes | 202,156 | 100.0 | ||
| Democratic hold | ||||
2020
| Party | Candidate | Votes | % | |
|---|---|---|---|---|
| Democratic | Linda Sánchez (incumbent) | 190,467 | 74.3 | |
| Democratic | Michael Tolar | 65,739 | 25.7 | |
| Total votes | 256,206 | 100.0 | ||
| Democratic hold | ||||
2022
| Party | Candidate | Votes | % | |
|---|---|---|---|---|
| Democratic | Linda Sánchez (incumbent) | 101,260 | 58.1 | |
| Republican | Eric Ching | 73,051 | 41.9 | |
| Total votes | 174,311 | 100.0 | ||
| Democratic hold | ||||
Historical district boundaries
From 2003 through 2013, the district consisted of most of the San Gabriel Valley in Los Angeles County. Due to redistricting after the 2010 United States census, the district has moved east and south east in Los Angeles County and includes much of the previous areas as well as Bellflower and Artesia.
References
- US Census
- "2022 Cook PVI: District Map and List". Cook Political Report. Retrieved January 10, 2023.
- Statement of Vote (1990 Governor)
- Statement of Vote (1992 President)
- Statement of Vote (1992 Senate)
- Statement of Vote (1994 Governor)
- Statement of Vote (1994 Senate)
- Statement of Vote (1996 President)
- Statement of Vote (1998 Governor) Archived September 29, 2011, at the Wayback Machine
- Statement of Vote (1998 Senate) Archived September 29, 2011, at the Wayback Machine
- Statement of Vote (2000 President)
- Statement of Vote (2000 Senator)
- Statement of Vote (2002 Governor)
- Statement of Vote (2003 Recall Question)
- Statement of Vote (2003 Governor)
- Statement of Vote (2004 President)
- Statement of Vote (2004 Senator)
- Statement of Vote (2006 Governor)
- Statement of Vote (2006 Senator)
- Statement of Vote (2008 President)
- Statement of Vote (2010 Governor)
- Statement of Vote (2010 Senator)
- Statement of Vote (2012 President)
- Statement of Vote (2012 Senator)
- Statement of Vote (2014 Governor)
- Statement of Vote (2016 President)
- Statement of Vote (2016 Senate)
- Statement of Vote (2018 Governor)
- Statement of Vote (2018 Senator)
- "Daily Kos Elections' presidential results by congressional district for 2020, 2016, and 2012".
- "Counties by Congressional District for Recall Question" (PDF). sos.ca.gov. September 14, 2021. Retrieved May 2, 2022.
- "Counties by Congressional Districts for Governor" (PDF). sos.ca.gov. November 8, 2022. Retrieved May 4, 2023.
- "1962 election results" (PDF).
- "1964 election results" (PDF).
- "1966 election results" (PDF).
- "1968 election results" (PDF).
- "1970 election results" (PDF).
- "1972 election results" (PDF).
- "1974 election results" (PDF).
- "1976 election results" (PDF).
- "1978 election results" (PDF).
- "1980 election results" (PDF).
- "1982 election results" (PDF).
- "1984 election results" (PDF).
- "1986 election results" (PDF).
- "1988 election results" (PDF).
- "1990 election results" (PDF).
- "1992 election results" (PDF).
- "1994 election results" (PDF).
- "1996 election results" (PDF).
- "1998 election results" (PDF).
- "2000 election results" (PDF).
- 2002 election results
- 2004 election results
- 2006 election results
- 2008 election results
- 2010 election results
- 2012 election results
- 2014 election results
- 2016 election results
- 2018 election results