California's 9th congressional district
| California's 9th congressional district | |||
|---|---|---|---|
Interactive map of district boundaries since 2023 (Used in the 2022 elections). After the 2020 redistricting cycle, this district will include the California cities of Tracy and Manteca, but will not include Brentwood nor Lathrop. | |||
| Representative |
| ||
| Population (2022) | 769,426 | ||
| Median household income | $86,062[1] | ||
| Ethnicity |
| ||
| Cook PVI | D+5[2] | ||
.svg.png.webp)
California's 9th congressional district is a congressional district in the U.S. state of California. Josh Harder, a Democrat, has represented the district since January 2023.
Prior to redistricting by the California Citizens Redistricting Commission of 2011, the 9th district encompassed part of the East Bay region of the San Francisco Bay Area. Cities in the district included Oakland, Berkeley and Castro Valley. Most of that area became parts of 13th district, while the 9th district in 2012 through 2022 was primarily made up of portions of the 18th and 11th districts from the 2002 through 2012.
Since the redistricting prior to the 2012 election, the 9th district centered on Stockton. It consisted of most of San Joaquin County and portions of Contra Costa and Sacramento counties. Cities in the district include Galt, Oakley, Lodi, Mountain House, and Stockton.[3]
With the redistricting in advance of the 2022 elections in California, the 9th district is still centered on Stockton. However, Tracy, Manteca, and Ripon, which were formerly in California's 10th congressional district, are now part of this district, while Antioch, Lathrop and Brentwood are no longer in the district. Antioch and Brentwood are part of the new 10th district, which is now west of the 9th district (as opposed to south).[4] Lathrop will be part of the new 13th district.[5]
John Kerry won the penultimate version of the district in 2004 with 85.9% of the vote. Barack Obama swept the same district in 2008 with 88.13% of the vote while John McCain received 9.87% of the vote, making it Obama's best and McCain's worst performance in California. The latter version of the 9th district (starting in 2012) was substantially more competitive, though it also favored the Democratic Party. According to poll-aggregation website FiveThirtyEight, the 2022 version of the district leans toward the Democratic Party.[6]
Election results from statewide races
| Year | Office | Results |
|---|---|---|
| 1992 | President | Clinton 78.7 - 12.4% |
| U.S. Senator | Boxer 80.5 - 14.5% | |
| U.S. Senator | Feinstein 82.9 - 13.0% | |
| 1994 | Governor | |
| U.S. Senator | ||
| 1996 | President | |
| 1998 | Governor | |
| U.S. Senator | ||
| 2000 | President[7] | Gore 78.6 - 12.0% |
| Senator[8] | Feinstein 73.1 - 12.2% | |
| 2002 | Governor[9] | Davis 67.5 - 12.8% |
| 2003 | Recall[10][11] | |
| Bustamante 66.2 - 14.7% | ||
| 2004 | President[12] | Kerry 85.9 - 12.6% |
| Senator[13] | Boxer 84.4 - 11.1% | |
| 2006 | Governor[14] | Angelides 67.3 - 24.0% |
| Senator[15] | Feinstein 81.4 - 8.3% | |
| 2008 | President[16] | Obama 88.1 - 9.9% |
| 2010 | Governor | Brown 85.1 - 11.4% |
| Senator | Boxer 84.8 - 11.7% | |
| 2012 | President | Obama 58.2 - 40.0% |
| Senator | Feinstein 59.6 - 40.4% | |
| 2014 | Governor[17] | Brown 55.1 - 44.9% |
| 2016 | President | Clinton 56.6 - 38.0% |
| Senator | Harris 59.0 - 41.0% | |
| 2018 | Governor | Newsom 53.9 - 46.1% |
| Senator | de Leon 51.2 - 48.8% | |
| 2020 | President | Biden 57.9 - 39.9% |
| 2021 | Recall[18][19] | |
| Elder 52.5 - 6.5% | ||
| 2022 | Governor[20] | Dahle 52.5 - 47.5% |
| Senator | Padilla 50.8 - 49.2% |
Composition
| # | County | Seat | Population |
|---|---|---|---|
| 77 | San Joaquin | Stockton | 789,410 |
As of the 2022 redistricting, California's 9th congressional district is located between the Sacramento Valley, Gold Country, and the San Joaquin Valley. It encompasses most of San Joaquin County, and parts of Contra Costa and Stanislaus Counties.
San Joaquin County is split between this district and the 13th district. They are partitioned by Union Pacific, Highway 380, S Tracy Blvd, the California Aqueduct, S Banta Rd, Highway 5, Paradise Cut, S Manthey Rd, Walthall Slough, E West Ripon Rd, Kincaid Rd, Hutchinson Rd, and Stanislaus River. The 9th district takes in the cities of Stockton, Tracy, Manteca, and Lodi.
Contra Costa County is split between this district and the 10th district. They are partitioned by Old River, Italian Slough, Western Farms Ranch Rd, Rankin Rd, Highway J14, Byron Hot Springs Rd, Camino Diablo, Kellogg Creek, Sellers Ave, Brentwood Blvd, Alloro Dr, Ghiggeri Dr, Emilio Dr, Guthrie Ln, Balfour Rd, Chestnut St, Byron Highway, Orwood Rd, Burlington Northern Santa Fe, Werner Dredger Cut, and Rock Slough. The 9th district takes in the census-designated place Discovery Bay.
Stanislaus County is split between this district and the 13th district. Lon Dale Rd, Highway J9, Highway J14, River Rock Rd, Lesnini Creek, Sonora Rd, and Stanislaus River. The 9th district takes in the Woodward Reservoir, and the only census-designated place within it is Valley Home.
List of members representing the district
| Representative | Party | Dates | Cong ress |
Electoral history | Counties |
|---|---|---|---|---|---|
| District created March 4, 1913 | |||||
 Charles W. Bell (Pasadena) |
Progressive | March 4, 1913 – March 3, 1915 |
63rd | Elected in 1912. Lost re-election. |
Los Angeles outside Los Angeles city |
 Charles Hiram Randall (Los Angeles) |
Prohibition | March 4, 1915 – March 3, 1921 |
64th 65th 66th |
Elected in 1914. Re-elected in 1916. Re-elected in 1918. Lost re-election. | |
| Vacant | March 4, 1921 – April 11, 1921 |
67th | Representative-elect Charles F. Van de Water died November 20, 1920. | ||
 Walter F. Lineberger (Long Beach) |
Republican | April 11, 1921 – March 3, 1927 |
67th 68th 69th |
Elected to finish Van de Water's term. Re-elected in 1922. Re-elected in 1924. Retired to run for U.S. Senator. | |
 William E. Evans (Glendale) |
Republican | March 4, 1927 – March 3, 1933 |
70th 71st 72nd |
Elected in 1926. Re-elected in 1928. Re-elected in 1930. Redistricted to the 11th district. | |
 Denver S. Church (Fresno) |
Democratic | March 4, 1933 – January 3, 1935 |
73rd | Elected in 1932. Retired. |
1933–1943 Fresno, Kings, Madera, Merced, Stanislaus |
 Bertrand W. Gearhart (Fresno) |
Republican | January 3, 1935 – January 3, 1949 |
74th 75th 76th 77th 78th 79th 80th |
Elected in 1934. Re-elected in 1936. Re-elected in 1938. Re-elected in 1940. Re-elected in 1942. Re-elected in 1944. Re-elected in 1946. Lost re-election. | |
| 1943–1953 Fresno, Madera, Merced, Stanislaus | |||||
.jpg.webp) Cecil F. White (Fresno) |
Democratic | January 3, 1949 – January 3, 1951 |
81st | Elected in 1948. Lost re-election. | |
.jpg.webp) Allan O. Hunter (Fresno) |
Republican | January 3, 1951 – January 3, 1953 |
82nd | Elected in 1950. Redistricted to the 12th district. | |
 J. Arthur Younger (San Mateo) |
Republican | January 3, 1953 – January 3, 1963 |
83rd 84th 85th 86th 87th |
Elected in 1952. Re-elected in 1954. Re-elected in 1956. Re-elected in 1958. Re-elected in 1960. Redistricted to the 11th district. |
San Mateo |
 Don Edwards (San Jose) |
Democratic | January 3, 1963 – January 3, 1975 |
88th 89th 90th 91st 92nd 93rd |
Elected in 1962. Re-elected in 1964. Re-elected in 1966. Re-elected in 1968. Re-elected in 1970. Re-elected in 1972. Redistricted to the 10th district. |
1963–1967 Eastern Santa Clara |
| 1967–1973 Southwest Alameda, most of Santa Clara | |||||
| 1973–1975 Southwest Alameda, northeast Santa Clara | |||||
 Pete Stark (Oakland) |
Democratic | January 3, 1975 – January 3, 1993 |
94th 95th 96th 97th 98th 99th 100th 101st 102nd |
Redistricted from the 8th district and re-elected in 1974. Re-elected in 1976. Re-elected in 1978. Re-elected in 1980. Re-elected in 1982. Re-elected in 1984. Re-elected in 1986. Re-elected in 1988. Re-elected in 1990. Redistricted to the 13th district. |
1975–1983 Alameda outside Oakland |
 Ron Dellums (Oakland) |
Democratic | January 3, 1993 – February 6, 1998 |
103rd 104th 105th |
Redistricted from the 8th district and re-elected in 1992. Re-elected in 1994. Re-elected in 1996. Resigned. |
1993–2003 Alameda (Berkeley, Oakland) |
| Vacant | February 6, 1998 – April 7, 1998 |
105th | |||
 Barbara Lee (Oakland) |
Democratic | April 7, 1998 – January 3, 2013 |
105th 106th 107th 108th 109th 110th 111th 112th |
Elected to finish Dellums's term. Re-elected in 1998. Re-elected in 2000. Re-elected in 2002. Re-elected in 2004. Re-elected in 2006. Re-elected in 2008. Re-elected in 2010. Redistricted to the 13th district. | |
2003–2013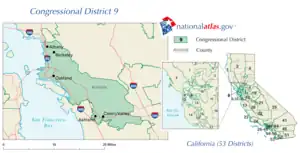 Alameda (Berkeley, Oakland) | |||||
 Jerry McNerney (Stockton) |
Democratic | January 3, 2013 – January 3, 2023 |
113th 114th 115th 116th 117th |
Redistricted from the 11th district and re-elected in 2012. Re-elected in 2014. Re-elected in 2016. Re-elected in 2018. Re-elected in 2020. Retired. |
2013–2023.tif.png.webp) Central Valley including San Joaquin Delta and Stockton |
 Josh Harder (Tracy) |
Democratic | January 3, 2023 – present |
118th | Redistricted from the 10th district and re-elected in 2022. | 2023–present:_(new_version).svg.png.webp) northern San Joaquin Valley |
Election results
|
1912 • 1914 • 1916 • 1918 • 1920 • 1921 (Special) • 1922 • 1924 • 1926 • 1928 • 1930 • 1932 • 1934 • 1936 • 1938 • 1940 • 1942 • 1944 • 1946 • 1948 • 1950 • 1952 • 1954 • 1956 • 1958 • 1960 • 1962 • 1964 • 1966 • 1968 • 1970 • 1972 • 1974 • 1976 • 1978 • 1980 • 1982 • 1984 • 1986 • 1988 • 1990 • 1992 • 1994 • 1996 • 1998 (Special) • 1998 • 2000 • 2002 • 2004 • 2006 • 2008 • 2010 • 2012 • 2014 • 2016 • 2018 • 2020 • 2022 |
1912
| Party | Candidate | Votes | % | ||
|---|---|---|---|---|---|
| Republican | Charles W. Bell | 28,845 | 47.2 | ||
| Democratic | Thomas H. Kirk | 14,571 | 23.9 | ||
| Socialist | Ralph L. Criswell | 11,123 | 18.2 | ||
| Prohibition | George S. Yarnall | 6,510 | 10.7 | ||
| Total votes | 61,049 | 100.0 | |||
| Turnout | {{{votes}}} | ||||
| Republican win (new seat) | |||||
1914
| Party | Candidate | Votes | % | |||
|---|---|---|---|---|---|---|
| Prohibition | Charles Hiram Randall | 28,097 | 30.9 | |||
| Progressive | Charles W. Bell (incumbent) | 27,560 | 30.3 | |||
| Republican | Frank C. Roberts | 25,176 | 27.7 | |||
| Socialist | Henry A. Hart | 10,084 | 11.1 | |||
| Total votes | 90,917 | 100.0 | ||||
| Turnout | {{{votes}}} | |||||
| Prohibition gain from Republican | ||||||
1916
| Party | Candidate | Votes | % | |
|---|---|---|---|---|
| Prohibition | Charles Hiram Randall (Incumbent) | 58,826 | 57.8 | |
| Independent | Charles W. Bell | 33,270 | 32.7 | |
| Socialist | Ralph L. Criswell | 9,661 | 9.5 | |
| Total votes | 101,757 | 100.0 | ||
| Turnout | {{{votes}}} | |||
| Prohibition hold | ||||
1918
| Party | Candidate | Votes | % | |
|---|---|---|---|---|
| Prohibition | Charles Hiram Randall (Incumbent) | 38,782 | 53.0 | |
| Republican | Montaville Flowers | 31,689 | 43.3 | |
| Socialist | Grace Silver Henry | 2,718 | 3.7 | |
| Total votes | 73,189 | 100.0 | ||
| Turnout | {{{votes}}} | |||
| Prohibition hold | ||||
1920
| Party | Candidate | Votes | % | |||
|---|---|---|---|---|---|---|
| Republican | Charles F. Van de Water | 62,952 | 59.7 | |||
| Prohibition | Charles Hiram Randall (Incumbent) | 36,675 | 34.8 | |||
| Socialist | Mary E. Garbutt | 5,819 | 5.5 | |||
| Total votes | 105,446 | 100.0 | ||||
| Turnout | {{{votes}}} | |||||
| Republican gain from Prohibition | ||||||
1921 (Special)
Republican Walter F. Lineberger won the special election to replace fellow Republican Charles F. Van de Water, who won the election but died before the 67th Congress convened. Data for this special election is not available.[22]
1922
| Party | Candidate | Votes | % | |
|---|---|---|---|---|
| Republican | Walter F. Lineberger (Incumbent) | 66,265 | 59.1 | |
| Prohibition | Charles Hiram Randall | 45,794 | 40.9 | |
| Total votes | 112,059 | 100.0 | ||
| Turnout | {{{votes}}} | |||
| Republican hold | ||||
1924
| Party | Candidate | Votes | % | |
|---|---|---|---|---|
| Republican | Walter F. Lineberger (Incumbent) | 119,993 | 63.9 | |
| Prohibition | Charles Hiram Randall | 67,735 | 36.1 | |
| Total votes | 187,728 | 100.0 | ||
| Turnout | {{{votes}}} | |||
| Republican hold | ||||
1926
| Party | Candidate | Votes | % | |
|---|---|---|---|---|
| Republican | William E. Evans (incumbent) | 102,270 | 59.5 | |
| Prohibition | Charles Hiram Randall | 61,719 | 35.9 | |
| Socialist | Charles F. Conley | 7,943 | 4.6 | |
| Total votes | 171,932 | 100.0 | ||
| Turnout | {{{votes}}} | |||
| Republican hold | ||||
1928
| Party | Candidate | Votes | % | |
|---|---|---|---|---|
| Republican | William E. Evans (incumbent) | 222,261 | 77.0 | |
| Democratic | James B. Ogg | 58,263 | 20.2 | |
| Socialist | Christian Sorenson | 8,090 | 2.8 | |
| Total votes | 288,614 | 100.0 | ||
| Turnout | {{{votes}}} | |||
| Republican hold | ||||
1930
| Party | Candidate | Votes | % | |
|---|---|---|---|---|
| Republican | William E. Evans (incumbent) | 182,176 | 100.0 | |
| Turnout | {{{votes}}} | |||
| Republican hold | ||||
1932
| Party | Candidate | Votes | % | |||
|---|---|---|---|---|---|---|
| Democratic | Denver S. Church | 50,125 | 61.6 | |||
| Republican | Henry E. Barbour (Incumbent) | 31,209 | 38.4 | |||
| Total votes | 81,334 | 100.0 | ||||
| Turnout | {{{votes}}} | |||||
| Democratic gain from Republican | ||||||
1934
| Party | Candidate | Votes | % | |||
|---|---|---|---|---|---|---|
| Republican | Bertrand W. Gearhart | 77,650 | 100.0 | |||
| Turnout | {{{votes}}} | |||||
| Republican gain from Democratic | ||||||
1936
| Party | Candidate | Votes | % | |
|---|---|---|---|---|
| Republican | Bertrand W. Gearhart (Incumbent) | 82,360 | 97 | |
| Communist | Carl B. Patterson | 2,571 | 3 | |
| Total votes | 84,931 | 100 | ||
| Turnout | {{{votes}}} | |||
| Republican hold | ||||
1938
| Party | Candidate | Votes | % | |
|---|---|---|---|---|
| Republican | Bertrand W. Gearhart (Incumbent) | 91,128 | 96.3 | |
| No party | George H. Sciaroni (write-in) | 3,536 | 3.7 | |
| Total votes | 94,664 | 100.0 | ||
| Turnout | {{{votes}}} | |||
| Republican hold | ||||
1940
| Party | Candidate | Votes | % | |
|---|---|---|---|---|
| Republican | Bertrand W. Gearhart (Incumbent) | 99,708 | 100.0 | |
| Turnout | {{{votes}}} | |||
| Republican hold | ||||
1942
| Party | Candidate | Votes | % | |
|---|---|---|---|---|
| Republican | Bertrand W. Gearhart (Incumbent) | 65,791 | 100.0 | |
| Turnout | {{{votes}}} | |||
| Republican hold | ||||
1944
| Party | Candidate | Votes | % | |
|---|---|---|---|---|
| Republican | Bertrand W. Gearhart (Incumbent) | 66,845 | 100.0 | |
| Turnout | {{{votes}}} | |||
| Republican hold | ||||
1946
| Party | Candidate | Votes | % | |
|---|---|---|---|---|
| Republican | Bertrand W. Gearhart (Incumbent) | 50,171 | 53.7 | |
| Democratic | Hubert Phillips | 43,244 | 46.3 | |
| Total votes | 93,415 | 100.0 | ||
| Turnout | {{{votes}}} | |||
| Republican hold | ||||
1948
| Party | Candidate | Votes | % | |||
|---|---|---|---|---|---|---|
| Democratic | Cecil F. White | 72,826 | 51.3 | |||
| Republican | Bertrand W. Gearhart (Incumbent) | 66,563 | 46.9 | |||
| Progressive | Josephine F. Daniels | 2,573 | 1.8 | |||
| Total votes | 141,962 | 100.0 | ||||
| Turnout | {{{votes}}} | |||||
| Democratic gain from Republican | ||||||
1950
| Party | Candidate | Votes | % | |||
|---|---|---|---|---|---|---|
| Republican | Allan O. Hunter | 76,015 | 52 | |||
| Democratic | Cecil F. White (incumbent) | 70,201 | 48 | |||
| Total votes | 146,216 | 100.0 | ||||
| Turnout | {{{votes}}} | |||||
| Republican gain from Democratic | ||||||
1952
| Party | Candidate | Votes | % | ||
|---|---|---|---|---|---|
| Republican | J. Arthur Younger (incumbent) | 71,426 | 53.1 | ||
| Democratic | Harold F. Taggart | 61,028 | 45.3 | ||
| Progressive | Charles S. Brown | 2,140 | 1.6 | ||
| Total votes | 134,594 | 100.0 | |||
| Turnout | {{{votes}}} | ||||
| Republican win (new seat) | |||||
1954
| Party | Candidate | Votes | % | |
|---|---|---|---|---|
| Republican | J. Arthur Younger (incumbent) | 60,648 | 54.5 | |
| Democratic | Harold F. Taggart | 50,619 | 45.5 | |
| Total votes | 111,267 | 100.0 | ||
| Turnout | {{{votes}}} | |||
| Republican hold | ||||
1956
| Party | Candidate | Votes | % | |
|---|---|---|---|---|
| Republican | J. Arthur Younger (incumbent) | 96,388 | 60.3 | |
| Democratic | James T. McKay | 63,504 | 39.7 | |
| Total votes | 159,892 | 100.0 | ||
| Turnout | {{{votes}}} | |||
| Republican hold | ||||
1958
| Party | Candidate | Votes | % | |
|---|---|---|---|---|
| Republican | J. Arthur Younger (incumbent) | 90,735 | 58.8 | |
| Democratic | Elma D. Oddstad | 63,597 | 41.2 | |
| Total votes | 154,332 | 100.0 | ||
| Turnout | {{{votes}}} | |||
| Republican hold | ||||
1960
| Party | Candidate | Votes | % | |
|---|---|---|---|---|
| Republican | J. Arthur Younger (incumbent) | 116,589 | 59.2 | |
| Democratic | John D. Kaster | 80,227 | 40.8 | |
| Total votes | 196,816 | 100.0 | ||
| Turnout | {{{votes}}} | |||
| Republican hold | ||||
1962
| Party | Candidate | Votes | % | ||
|---|---|---|---|---|---|
| Democratic | Don Edwards | 79,616 | 66 | ||
| Republican | Joseph F. Donovan | 41,104 | 34 | ||
| Total votes | 120,720 | 100 | |||
| Turnout | {{{votes}}} | ||||
| Democratic win (new seat) | |||||
1964
| Party | Candidate | Votes | % | |
|---|---|---|---|---|
| Democratic | Don Edwards (incumbent) | 115,954 | 69.8 | |
| Republican | Joseph F. Donovan | 50,261 | 30.2 | |
| Total votes | 166,215 | 100.0 | ||
| Turnout | {{{votes}}} | |||
| Democratic hold | ||||
1966
| Party | Candidate | Votes | % | |
|---|---|---|---|---|
| Democratic | Don Edwards (incumbent) | 97,311 | 63.2 | |
| Republican | Wilbur G. Durkee | 56,784 | 36.8 | |
| Total votes | 154,095 | 100.0 | ||
| Turnout | {{{votes}}} | |||
| Democratic hold | ||||
1968
| Party | Candidate | Votes | % | |
|---|---|---|---|---|
| Democratic | Don Edwards (incumbent) | 100,891 | 56.5 | |
| Republican | Larry Fargher | 77,521 | 43.5 | |
| Total votes | 178,412 | 100.0 | ||
| Turnout | {{{votes}}} | |||
| Democratic hold | ||||
1970
| Party | Candidate | Votes | % | |
|---|---|---|---|---|
| Democratic | Don Edwards (incumbent) | 120,041 | 69.1 | |
| Republican | Mark Guerra | 49,556 | 28.5 | |
| American Independent | Edmon V. Kaiser | 4,009 | 2.3 | |
| Total votes | 173,606 | 100.0 | ||
| Turnout | {{{votes}}} | |||
| Democratic hold | ||||
1972
| Party | Candidate | Votes | % | |
|---|---|---|---|---|
| Democratic | Don Edwards (incumbent) | 123,837 | 72.3 | |
| Republican | Herb Smith | 43,134 | 25.2 | |
| American Independent | Edmon V. Kaiser | 4,403 | 2.5 | |
| Total votes | 171,374 | 100 | ||
| Turnout | {{{votes}}} | |||
| Democratic hold | ||||
1974
| Party | Candidate | Votes | % | |
|---|---|---|---|---|
| Democratic | Pete Stark (incumbent) | 87,854 | 70.6 | |
| Republican | Edson Adams | 36,522 | 29.4 | |
| Total votes | 124,376 | 100.0 | ||
| Turnout | {{{votes}}} | |||
| Democratic hold | ||||
1976
| Party | Candidate | Votes | % | |
|---|---|---|---|---|
| Democratic | Pete Stark (incumbent) | 116,398 | 70.8 | |
| Republican | James K. Mills | 44,607 | 27.1 | |
| Peace and Freedom | Albert L. Sargis | 3,386 | 2.1 | |
| Total votes | 164,391 | 100.0 | ||
| Turnout | {{{votes}}} | |||
| Democratic hold | ||||
1978
| Party | Candidate | Votes | % | |
|---|---|---|---|---|
| Democratic | Pete Stark (incumbent) | 88,179 | 65.4 | |
| Republican | Robert S. Allen | 41,138 | 30.5 | |
| Peace and Freedom | Lawrance J. Phillips | 5,562 | 4.1 | |
| Total votes | 134,879 | 100.0 | ||
| Turnout | {{{votes}}} | |||
| Democratic hold | ||||
1980
| Party | Candidate | Votes | % | |
|---|---|---|---|---|
| Democratic | Pete Stark (incumbent) | 90,504 | 55.3 | |
| Republican | William J. "Bill" Kennedy | 67,265 | 41.1 | |
| Libertarian | Steven W. Clanin | 5,823 | 3.6 | |
| Total votes | 163,592 | 100.0 | ||
| Turnout | {{{votes}}} | |||
| Democratic hold | ||||
1982
| Party | Candidate | Votes | % | |
|---|---|---|---|---|
| Democratic | Pete Stark (incumbent) | 104,393 | 60.7 | |
| Republican | William J. "Bill" Kennedy | 67,702 | 39.3 | |
| Total votes | 172,095 | 100.0 | ||
| Turnout | {{{votes}}} | |||
| Democratic hold | ||||
1984
| Party | Candidate | Votes | % | |
|---|---|---|---|---|
| Democratic | Pete Stark (incumbent) | 136,511 | 69.9 | |
| Republican | J. T. "Eager" Beaver | 51,399 | 26.3 | |
| Libertarian | Martha Fuhrig | 7,398 | 3.8 | |
| Total votes | 195,308 | 100.0 | ||
| Turnout | {{{votes}}} | |||
| Democratic hold | ||||
1986
| Party | Candidate | Votes | % | |
|---|---|---|---|---|
| Democratic | Pete Stark (incumbent) | 113,490 | 69.7 | |
| Republican | David M. "Dave" Williams | 49,300 | 30.3 | |
| Total votes | 162,790 | 100.0 | ||
| Turnout | {{{votes}}} | |||
| Democratic hold | ||||
1988
| Party | Candidate | Votes | % | |
|---|---|---|---|---|
| Democratic | Pete Stark (incumbent) | 152,866 | 73 | |
| Republican | Howard Hertz | 56,656 | 27 | |
| Total votes | 214,522 | 100 | ||
| Turnout | {{{votes}}} | |||
| Democratic hold | ||||
1990
| Party | Candidate | Votes | % | |
|---|---|---|---|---|
| Democratic | Pete Stark (incumbent) | 94,739 | 58.4 | |
| Republican | Victor Romero | 67,412 | 41.6 | |
| Total votes | 162,151 | 100.0 | ||
| Turnout | {{{votes}}} | |||
| Democratic hold | ||||
1992
| Party | Candidate | Votes | % | |
|---|---|---|---|---|
| Democratic | Ron Dellums (incumbent) | 164,265 | 71.9 | |
| Republican | G. William "Billy" Hunter | 53,707 | 23.5 | |
| Peace and Freedom | Dave Linn | 10,472 | 4.6 | |
| No party | Muss (write-in) | 23 | 0.0 | |
| Total votes | 228,467 | 100.0 | ||
| Turnout | {{{votes}}} | |||
| Democratic hold | ||||
1994
| Party | Candidate | Votes | % | |
|---|---|---|---|---|
| Democratic | Ron Dellums (incumbent) | 129,233 | 72.25 | |
| Republican | Deborah Wright | 40,448 | 22.61 | |
| Peace and Freedom | Emma Wong Mar | 9,194 | 5.14 | |
| Total votes | 178,875 | 100.0 | ||
| Turnout | {{{votes}}} | |||
| Democratic hold | ||||
1996
| Party | Candidate | Votes | % | |
|---|---|---|---|---|
| Democratic | Ron Dellums (incumbent) | 154,806 | 77.1 | |
| Republican | Deborah Wright | 37,126 | 18.5 | |
| Peace and Freedom | Tom Condit | 5,561 | 2.7 | |
| Natural Law | Jack Forem | 3,475 | 1.7 | |
| Republican | Omari Musa (write-in) | 8 | 0.0 | |
| Total votes | 200,976 | 100.0 | ||
| Turnout | {{{votes}}} | |||
| Democratic hold | ||||
1998 (Special)
| Party | Candidate | Votes | % | |
|---|---|---|---|---|
| Democratic | Barbara Lee | 33,497 | 66.81 | |
| Democratic | Greg Harper | 8,048 | 16.05 | |
| Republican | Claiborne Sanders | 6,114 | 12.19 | |
| Democratic | Randal Stewart | 2,481 | 4.95 | |
| Total votes | 50,140 | 100.00 | ||
| Turnout | {{{votes}}} | |||
| Democratic hold | ||||
1998
| Party | Candidate | Votes | % | |
|---|---|---|---|---|
| Democratic | Barbara Lee (incumbent) | 140,722 | 82.83 | |
| Republican | Claiborne "Clay" Sanders | 22,431 | 13.20 | |
| Peace and Freedom | Gerald Sanders | 4,767 | 2.81 | |
| Natural Law | Walter Ruehlig | 1,975 | 1.16 | |
| Total votes | 169,895 | 100.0 | ||
| Turnout | {{{votes}}} | |||
| Democratic hold | ||||
2000
| Party | Candidate | Votes | % | |
|---|---|---|---|---|
| Democratic | Barbara Lee (incumbent) | 182,352 | 85.0 | |
| Republican | Arneze Washington | 21,033 | 9.8 | |
| Libertarian | Fred E. Foldvary | 7,051 | 3.3 | |
| Natural Law | Ellen Jefferds | 4,214 | 1.9 | |
| Total votes | 214,650 | 100.0 | ||
| Turnout | {{{votes}}} | |||
| Democratic hold | ||||
2002
| Party | Candidate | Votes | % | |
|---|---|---|---|---|
| Democratic | Barbara Lee (incumbent) | 135,893 | 85.0 | |
| Republican | Jerald Udinsky | 25,333 | 9.8 | |
| Libertarian | James M. Eyer | 5,685 | 3.4 | |
| Republican | Hector Reyna (write-in) | 6 | 0.0 | |
| Total votes | 166,917 | 100.0 | ||
| Turnout | {{{votes}}} | |||
| Democratic hold | ||||
2004
| Party | Candidate | Votes | % | |
|---|---|---|---|---|
| Democratic | Barbara Lee (incumbent) | 215,630 | 84.6 | |
| Republican | Claudia Bermudez | 31,278 | 12.3 | |
| Libertarian | James M. Eyer | 8,131 | 3.1 | |
| Total votes | 255,039 | 100.0 | ||
| Turnout | {{{votes}}} | |||
| Democratic hold | ||||
2006
| Party | Candidate | Votes | % | |
|---|---|---|---|---|
| Democratic | Barbara Lee (incumbent) | 167,245 | 86.4 | |
| Republican | John "J.D." Den Dulk | 20,786 | 10.7 | |
| Libertarian | James M. Eyer | 5,655 | 2.9 | |
| Total votes | 193,686 | 100.0 | ||
| Turnout | {{{votes}}} | |||
| Democratic hold | ||||
2008
| Party | Candidate | Votes | % | |
|---|---|---|---|---|
| Democratic | Barbara Lee (incumbent) | 238,915 | 86.06 | |
| Republican | Charles Hargrave | 26,917 | 9.70 | |
| Libertarian | James M. Eyer | 11,704 | 4.22 | |
| Total votes | 277,536 | 100.0 | ||
| Turnout | {{{votes}}} | |||
| Democratic hold | ||||
2010
| Party | Candidate | Votes | % | |
|---|---|---|---|---|
| Democratic | Barbara Lee (incumbent) | 180,400 | 84.27 | |
| Republican | Gerald Hashimito | 23,054 | 10.77 | |
| Green | Dave Heller | 4,848 | 2.27 | |
| Libertarian | James M. Eyer | 4,113 | 1.92 | |
| Peace and Freedom | Larry Allen | 1,670 | 0.78 | |
| Total votes | 214,085 | 100.0 | ||
| Turnout | {{{votes}}} | |||
| Democratic hold | ||||
2012
| Party | Candidate | Votes | % | |
|---|---|---|---|---|
| Democratic | Jerry McNerney (incumbent) | 118,373 | 55.6 | |
| Republican | Ricky Gill | 94,704 | 44.4 | |
| Total votes | 213,077 | 100.0 | ||
| Democratic hold | ||||
2014
| Party | Candidate | Votes | % | |
|---|---|---|---|---|
| Democratic | Jerry McNerney (incumbent) | 63,475 | 52.4 | |
| Republican | Antonio C. Amador | 57,729 | 47.6 | |
| Total votes | 121,204 | 100.0 | ||
| Democratic hold | ||||
2016
| Party | Candidate | Votes | % | |
|---|---|---|---|---|
| Democratic | Jerry McNerney (incumbent) | 133,163 | 57.4 | |
| Republican | Antonio C. Amador | 98,992 | 42.6 | |
| Total votes | 232,155 | 100.0 | ||
| Democratic hold | ||||
2018
| Party | Candidate | Votes | % | |
|---|---|---|---|---|
| Democratic | Jerry McNerney (incumbent) | 113,414 | 56.5 | |
| Republican | Marla Livengood | 87,349 | 43.5 | |
| Total votes | 200,763 | 100.0 | ||
| Democratic hold | ||||
2020
| Party | Candidate | Votes | % | |
|---|---|---|---|---|
| Democratic | Jerry McNerney (incumbent) | 174,252 | 57.6 | |
| Republican | Antonio C. "Tony" Amador | 128,358 | 42.4 | |
| Total votes | 302,610 | 100.0 | ||
| Democratic hold | ||||
2022
| Party | Candidate | Votes | % | |
|---|---|---|---|---|
| Democratic | Josh Harder (incumbent) | 95,598 | 54.8 | |
| Republican | Tom Patti | 78,802 | 45.2 | |
| Total votes | 174,400 | 100.0 | ||
| Democratic hold | ||||
References
- "My Congressional District: Congressional District 9 (118th Congress), California". United States Census Bureau.
- "2022 Cook PVI: District Map and List". Cook Political Report. Retrieved January 10, 2023.
- "Maps: Final Congressional Districts". Citizens Redistricting Commission. Archived from the original on March 10, 2013. Retrieved February 24, 2013.
- "Map Viewer". We Draw the Lines CA. Retrieved January 22, 2022.
- "Congressional pdf Final.pdf". wedrawthelinesca.org. Retrieved February 21, 2022. - PDF retrieved via "Final Maps". We Draw the Lines CA. Retrieved February 21, 2022.
- Rakich, Ryan Best, Aaron Bycoffe and Nathaniel (August 9, 2021). "What Redistricting Looks Like In Every State - California - Commission-approved draft plan". FiveThirtyEight. Retrieved January 22, 2022.
{{cite web}}: CS1 maint: multiple names: authors list (link) - Statement of Vote (2000 President) Archived 2007-06-11 at the Wayback Machine
- Statement of Vote (2000 Senator) Archived 2007-06-11 at the Wayback Machine
- Statement of Vote (2002 Governor) Archived 2010-11-11 at the Wayback Machine
- Statement of Vote (2003 Recall Question) Archived 2011-05-20 at the Wayback Machine
- Statement of Vote (2003 Governor) Archived 2011-05-20 at the Wayback Machine
- Statement of Vote (2004 President) Archived 2010-08-01 at the Wayback Machine
- Statement of Vote (2004 Senator) Archived 2011-08-10 at the Wayback Machine
- Statement of Vote (2006 Governor) Archived 2011-08-10 at the Wayback Machine
- Statement of Vote (2006 Senator) Archived 2011-08-10 at the Wayback Machine
- (2008 President) Archived 2010-07-24 at the Wayback Machine
- Supplement to the Statement of Vote - Counties by Congressional Districts for Governor
- "Supplement to the Statement of Vote September 14, 2021, California Gubernatorial Recall Election Counties by Congressional Districts for Recall Question" (PDF). Archived (PDF) from the original on March 7, 2022.
- "Counties by Congressional Districts for Recall Election Gubernatorial Replacement Candidates" (PDF).
- "Counties by Congressional Districts for Governor" (PDF). sos.ca.gov. November 8, 2022. Retrieved May 4, 2023.
- 1920 election results
- 1921 special election results
- 1922 election results
- 1924 election results
- 1926 election results
- 1928 election results
- 1930 election results
- 1932 election results
- 1934 election results
- 1936 election results
- 1938 election results
- 1940 election results
- 1942 election results
- 1944 election results
- 1946 election results
- 1948 election results
- 1950 election results
- 1952 election results
- 1954 election results
- 1956 election results
- 1958 election results
- 1960 election results
- 1962 election results
- 1964 election results
- 1966 election results
- 1968 election results
- 1970 election results
- 1972 election results
- 1974 election results
- 1976 election results
- 1978 election results
- 1980 election results
- 1982 election results
- 1984 election results
- 1986 election results
- 1988 election results
- 1990 election results
- 1992 election results
- 1994 election results
- 1996 election results
- 1998 special election results
- 1998 election results
- 2000 election results
- 2002 general election results Archived February 3, 2009, at the Wayback Machine
- 2004 general election results
- 2006 general election results Archived November 27, 2008, at the Wayback Machine
- 2008 general election results
- 2010 general election results
- 2012 general election results Archived October 19, 2013, at the Wayback Machine
- 2014 general election results
- 2014 general election results
- 2018 general election results
External links
- GovTrack.us: California's 9th congressional district