Connecticut's 2nd congressional district
Connecticut's 2nd congressional district is a congressional district in the U.S. state of Connecticut. Located in the eastern part of the state, the district includes all of New London County, Tolland County, and Windham County, along with parts of Hartford, Middlesex, and New Haven counties. Principal cities include Enfield, Norwich, New London, and Groton.
| Connecticut's 2nd congressional district | |||
|---|---|---|---|
Interactive map of district boundaries since January 3, 2023 | |||
| Representative |
| ||
| Area | 2,143 sq mi (5,550 km2) | ||
| Distribution |
| ||
| Population (2022) | 727,411 | ||
| Median household income | $88,894[1] | ||
| Ethnicity |
| ||
| Cook PVI | D+3[2] | ||
The district is currently represented by Democrat Joe Courtney. With a Cook Partisan Voting Index rating of D+3, it is one of the least Democratic districts in Connecticut, a state with an all-Democratic congressional delegation.[2]
Towns in the district
The district includes the following towns:
- Hartford County – Enfield, Glastonbury (part), Marlborough, and Suffield.
- Middlesex County – Chester, Clinton, Deep River, East Haddam, East Hampton, Essex, Haddam, Killingworth, Old Saybrook, and Westbrook.
- New Haven County – Madison.
- New London County – Bozrah, Colchester, East Lyme, Franklin, Griswold, Groton, Lebanon, Ledyard, Lisbon, Lyme, Montville, New London, North Stonington, Norwich, Old Lyme, Preston, Salem, Sprague, Stonington, Voluntown, and Waterford.
- Tolland County – Andover, Bolton, Columbia, Coventry, Ellington, Hebron, Mansfield, Somers, Stafford, Tolland, Union, Vernon, and Willington.
- Windham County – Ashford, Brooklyn, Canterbury, Chaplin, Eastford, Hampton, Killingly, Plainfield, Pomfret, Putnam, Scotland, Sterling, Thompson, Windham, and Woodstock.
Voter registration
| Voter registration and party enrollment as of October 31, 2023[3] | |||||
|---|---|---|---|---|---|
| Party | Active | Inactive | Total | Percentage | |
| Democratic | 144,072 | 13,769 | 157,841 | 29.85% | |
| Republican | 115,845 | 9,243 | 125,088 | 23.66% | |
| Minor Parties | 8,840 | 948 | 9,788 | 1.85% | |
| Unaffiliated | 211,538 | 24,486 | 236,024 | 44.64% | |
| Total | 480,295 | 48,446 | 528,741 | 100% | |
Recent statewide election results
| Election results from statewide races | ||
|---|---|---|
| Year | Office | Results |
| 2000 | President | Gore 55–38% |
| 2004 | President | Kerry 54–44% |
| 2008 | President | Obama 58–40% |
| 2012 | President | Obama 56–43% |
| 2016 | President | Clinton 49–46% |
| Senate | Blumenthal 61–36% | |
| 2018 | Senate | Murphy 56–42% |
| Governor | Stefanowski 49–45% | |
| 2020 | President | Biden 55–44% |
| 2022 | Senate | Blumenthal 55–45% |
Recent elections
1992
| Party | Candidate | Votes | % | ±% | |
|---|---|---|---|---|---|
| Democratic | Samuel Gejdenson (incumbent) | 123,291 | 51% | ||
| Republican | Edward W. Munster | 119,416 | 49% | ||
| Democratic hold | Swing | ||||
| Turnout | 242,707 | 100% | |||
1994
| Party | Candidate | Votes | % | ±% | |
|---|---|---|---|---|---|
| Democratic | Samuel Gejdenson (incumbent) | 79,188 | 43% | ||
| Republican | Edward W. Munster | 79,167 | 43% | ||
| A Connecticut Party (1990) | David Bingham | 27,716 | 14% | ||
| Democratic hold | Swing | ||||
| Turnout | 186,071 | 100% | |||
1996
| Party | Candidate | Votes | % | ±% | |
|---|---|---|---|---|---|
| Democratic | Samuel Gejdenson (incumbent) | 115,175 | 52% | ||
| Republican | Edward W. Munster | 100,332 | 45% | ||
| Independence Party of America | Dianne G. Ondusko | 6,477 | 3% | ||
| Natural Law | Thomas E. Hall | 1,263 | 0.4% | ||
| Democratic hold | Swing | ||||
| Turnout | 223,258 | 100% | |||
1998
| Party | Candidate | Votes | % | ±% | |
|---|---|---|---|---|---|
| Democratic | Samuel Gejdenson (inc.) | 99,567 | 61% | ||
| Republican | Gary M. Koval | 57,860 | 35% | ||
| Independence Party of America | Dianne G. Ondusko | 5,116 | 3% | ||
| Term Limits | Paul W. Cook | 658 | 0.4% | ||
| Democratic hold | Swing | ||||
| Turnout | 163,201 | 100% | |||
2000
| Party | Candidate | Votes | % | ±% | |
|---|---|---|---|---|---|
| Republican | Rob Simmons | 114,380 | 51% | ||
| Democratic | Samuel Gejdenson (incumbent) | 111,520 | 49% | ||
| Republican gain from Democratic | Swing | ||||
| Turnout | 225,900 | 100% | |||
2002
| Party | Candidate | Votes | % | ±% | |
|---|---|---|---|---|---|
| Republican | Rob Simmons (incumbent) | 117,434 | 54% | ||
| Democratic | Joe Courtney | 99,674 | 46% | ||
| Republican hold | Swing | ||||
| Turnout | 217,108 | 100% | |||
2004
| Party | Candidate | Votes | % | ±% | |
|---|---|---|---|---|---|
| Republican | Rob Simmons (inc.) | 165,558 | 54% | ||
| Democratic | James Sullivan | 139,987 | 46% | - | |
| Republican hold | Swing | ||||
| Turnout | 305,545 | 100% | |||
2006
| Party | Candidate | Votes | % | ±% | |
|---|---|---|---|---|---|
| Democratic | Joe Courtney | 121,248 | 50% | ||
| Republican | Rob Simmons (incumbent) | 121,158 | 50% | ||
| Democratic gain from Republican | Swing | ||||
| Turnout | 242,413 | 100% | |||
2008
| Party | Candidate | Votes | % | ±% | |
|---|---|---|---|---|---|
| Democratic | Joe Courtney (incumbent) | 212,411 | 66% | ||
| Republican | Sean Sullivan | 104,469 | 32% | ||
| Green | G. Scott Deshefy | 6,287 | 2% | ||
| Democratic hold | Swing | ||||
| Turnout | 323,167 | 100% | |||
2010
| Party | Candidate | Votes | % | ±% | |
|---|---|---|---|---|---|
| Democratic | Joe Courtney (incumbent) | 147,748 | 60% | ||
| Republican | Janet Peckinpaugh | 95,671 | 39% | ||
| Green | G. Scott Deshefy | 3,344 | 1% | ||
| Democratic hold | Swing | ||||
| Turnout | 246,763 | 100% | |||
2012
| Party | Candidate | Votes | % | ±% | |
|---|---|---|---|---|---|
| Democratic | Joe Courtney (incumbent) | 204,691 | 68% | ||
| Republican | Paul Formica | 87,828 | 29% | ||
| Green | Colin Bennett | 3,269 | 2% | ||
| Libertarian | Daniel Reale | 3,504 | 1% | ||
| Democratic hold | Swing | ||||
| Turnout | 299,652 | 100% | |||
2014
| Party | Candidate | Votes | % | ±% | |
|---|---|---|---|---|---|
| Democratic | Joe Courtney (incumbent) | 141,948 | 62% | ||
| Republican | Lori Hopkins-Cavanagh | 80,837 | 36% | ||
| Green | William Clyde | 2,602 | 1% | ||
| Libertarian | Daniel Reale | 2,549 | 1% | ||
| Democratic hold | Swing | ||||
| Turnout | 227,936 | 100% | |||
2016
| Party | Candidate | Votes | % | ±% | |
|---|---|---|---|---|---|
| Democratic | Joe Courtney (incumbent) | 207,584 | 63% | ||
| Republican | Daria Novak | 111,587 | 34% | ||
| Green | Jonathan Pelto | 5,332 | 2% | ||
| Libertarian | Daniel Reale | 5,016 | 1% | ||
| Democratic hold | Swing | ||||
| Turnout | 329,519 | 100% | |||
2018
| Party | Candidate | Votes | % | ±% | |
|---|---|---|---|---|---|
| Democratic | Joe Courtney (incumbent) | 179,731 | 62% | ||
| Republican | Dan Postemski | 102,483 | 35% | ||
| Green | Michelle Louise Bicking | 3,595 | 1% | ||
| Libertarian | Dan Reale | 3,305 | 1% | ||
| Democratic hold | Swing | ||||
| Turnout | 289,114 | 100% | |||
2020
| Party | Candidate | Votes | % | ±% | |
|---|---|---|---|---|---|
| Democratic | Joe Courtney (incumbent) | 217,982 | 59.37% | ||
| Republican | Justin Anderson | 140,340 | 38.2% | ||
| Green | Cassandra Martineau | 4,949 | 1.35% | ||
| Libertarian | Dan Reale | 3,901 | 1.06% | ||
| Democratic hold | Swing | ||||
| Turnout | 367,181 | 100% | |||
2022
| Party | Candidate | Votes | % | ±% | |
|---|---|---|---|---|---|
| Democratic | Joe Courtney (incumbent) | 165,946 | 58.2 | ||
| Republican | Mike France | 114,506 | 40.2 | ||
| Green | Kevin Blacker | 2,439 | 0.9 | ||
| Libertarian | William Hall | 2,140 | 0.7 | ||
| Total votes | 285,031 | 100.0 | |||
| Democratic hold | |||||
List of members representing the district
District organized from Connecticut's at-large congressional district in 1837.
| Member (Residence) |
Party | Years of Service | Cong ress |
Electoral history | Location |
|---|---|---|---|---|---|
| District created March 4, 1837 | |||||
| Samuel Ingham (Saybrook) |
Democratic | March 4, 1837 – March 3, 1839 |
25th | Redistricted from the at-large district and re-elected in 1837. Lost re-election. |
|
| William L. Storrs (Middletown) |
Whig | March 4, 1839 – June, 1840 |
26th | Elected in 1839. Resigned when appointed Associate Justice of the Connecticut Supreme Court. | |
| Vacant | June, 1840 – December 7, 1840 |
||||
 William Whiting Boardman (New Haven) |
Whig | December 7, 1840 – March 3, 1843 |
26th 27th |
Elected in special election due to Storrs resignation. Retired. | |
| John Stewart (Middle Haddam) |
Democratic | March 4, 1843 – March 3, 1845 |
28th | Elected in 1843. Lost re-election. | |
 Samuel Dickinson Hubbard (Middletown) |
Whig | March 4, 1845 – March 3, 1849 |
29th 30th |
Elected in 1845. Re-elected in 1847. Retired. | |
 Walter Booth (Meriden) |
Free Soil | March 4, 1849 – March 3, 1851 |
31st | Elected in 1849. Lost re-election. | |
| Colin M. Ingersoll (New Haven) |
Democratic | March 4, 1851 – March 3, 1855 |
32nd 33rd |
Elected in 1851. Re-elected in 1853. Retired. | |
 John Woodruff (New Haven) |
American | March 4, 1855 – March 3, 1857 |
34th | Elected in 1855. Lost re-election. | |
 Samuel Arnold (Haddam) |
Democratic | March 4, 1857 – March 3, 1859 |
35th | Elected in 1857. Retired. | |
John Woodruff (New Haven) |
Republican | March 4, 1859 – March 3, 1861 |
36th | Elected in 1859. Retired. | |
 James E. English (New Haven) |
Democratic | March 4, 1861 – March 3, 1865 |
37th 38th |
Elected in 1861. Re-elected in 1863. Retired. | |
 Samuel L. Warner (Middletown) |
Republican | March 4, 1865 – March 3, 1867 |
39th | Elected in 1865. Retired. | |
 Julius Hotchkiss (Middletown) |
Democratic | March 4, 1867 – March 3, 1869 |
40th | Elected in 1867. Retired. | |
.jpg.webp) Stephen Wright Kellogg (Waterbury) |
Republican | March 4, 1869 – March 3, 1875 |
41st 42nd 43rd |
Elected in 1869. Re-elected in 1871. Re-elected in 1873. Lost re-election. | |
 James Phelps (Essex) |
Democratic | March 4, 1875 – March 3, 1883 |
44th 45th 46th 47th |
Elected in 1875. Re-elected in 1876. Re-elected in 1878. Re-elected in 1880. Retired. | |
.jpg.webp) Charles Le Moyne Mitchell (New Haven) |
Democratic | March 4, 1883 – March 3, 1887 |
48th 49th |
Elected in 1882. Re-elected in 1884. Retired. | |
.jpg.webp) Carlos French (Seymour) |
Democratic | March 4, 1887 – March 3, 1889 |
50th | Elected in 1886. Retired. | |
.jpg.webp) Washington F. Willcox (Chester) |
Democratic | March 4, 1889 – March 3, 1893 |
51st 52nd |
Elected in 1888. Re-elected in 1890. Retired. | |
.jpg.webp) James P. Pigott (New Haven) |
Democratic | March 4, 1893 – March 3, 1895 |
53rd | Elected in 1892. Lost re-election. | |
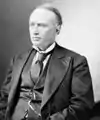
.jpg.webp) Nehemiah D. Sperry (New Haven) |
Republican | March 4, 1895 – March 3, 1911 |
54th 55th 56th 57th 58th 59th 60th 61st |
Elected in 1894. Re-elected in 1896. Re-elected in 1898. Re-elected in 1900. Re-elected in 1902. Re-elected in 1904. Re-elected in 1906. Re-elected in 1908. Retired. | |
 Thomas L. Reilly (Meriden) |
Democratic | March 4, 1911 – March 3, 1913 |
62nd | Elected in 1910. Redistricted to the 3rd district. | |
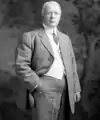
 Bryan F. Mahan (New London) |
Democratic | March 4, 1913 – March 3, 1915 |
63rd | Elected in 1912. Lost re-election. | |
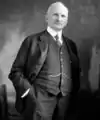
 Richard P. Freeman (New London) |
Republican | March 4, 1915 – March 3, 1933 |
64th 65th 66th 67th 68th 69th 70th 71st 72nd |
Elected in 1914. Re-elected in 1916. Re-elected in 1918. Re-elected in 1920. Re-elected in 1922. Re-elected in 1924. Re-elected in 1926. Re-elected in 1928. Re-elected in 1930. Lost re-election. | |
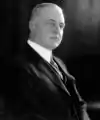
.jpg.webp) William L. Higgins (South Coventry) |
Republican | March 4, 1933 – January 3, 1937 |
73rd 74th |
Elected in 1932. Re-elected in 1934. Lost re-election. | |
| William J. Fitzgerald (Norwich) |
Democratic | January 3, 1937 – January 3, 1939 |
75th | Elected in 1936. Lost re-election. | |
| Thomas R. Ball (Old Lyme) |
Republican | January 3, 1939 – January 3, 1941 |
76th | Elected in 1938. Lost re-election. | |
| William J. Fitzgerald (Norwich) |
Democratic | January 3, 1941 – January 3, 1943 |
77th | Elected in 1940. Lost re-election. | |
| John D. McWilliams (Norwich) |
Republican | January 3, 1943 – January 3, 1945 |
78th | Elected in 1942. Lost re-election. | |
 Chase G. Woodhouse (New London) |
Democratic | January 3, 1945 – January 3, 1947 |
79th | Elected in 1944. Lost re-election. | |
.jpg.webp) Horace Seely-Brown Jr. (Pomfret Center) |
Republican | January 3, 1947 – January 3, 1949 |
80th | Elected in 1946. Lost re-election. | |
Chase G. Woodhouse (Sprague) |
Democratic | January 3, 1949 – January 3, 1951 |
81st | Elected in 1948. Lost re-election. | |
Horace Seely-Brown Jr. (Pomfret Center) |
Republican | January 3, 1951 – January 3, 1959 |
82nd 83rd 84th 85th |
Elected in 1950. Re-elected in 1952. Re-elected in 1954. Re-elected in 1956. Lost re-election. | |
.jpg.webp) Chester Bowles (Essex) |
Democratic | January 3, 1959 – January 3, 1961 |
86th | Elected in 1958. Retired when appointed Under Secretary of State | |
Horace Seely-Brown Jr. (Pomfret Center) |
Republican | January 3, 1961 – January 3, 1963 |
87th | Elected in 1960. Retired after running for US Senate | |
 William St. Onge (Putnam) |
Democratic | January 3, 1963 – May 1, 1970 |
88th 89th 90th 91st |
Elected in 1962. Re-elected in 1964. Re-elected in 1966. Re-elected in 1968. Died. | |
| Vacant | May 1, 1970 – November 3, 1970 |
91st | |||
 Robert H. Steele (Vernon) |
Republican | November 3, 1970 – January 3, 1975 |
91st 92nd 93rd |
Elected to finish St. Onge's term. Re- elected in 1970. Re-elected in 1972. Retired after running for Governor of Connecticut. | |
 Chris Dodd (North Stonington) |
Democratic | January 3, 1975 – January 3, 1981 |
94th 95th 96th |
Elected in 1974. Re-elected in 1976. Re-elected in 1978. Retired when elected to the US Senate | |
 Sam Gejdenson (Bozrah) |
Democratic | January 3, 1981 – January 3, 2001 |
97th 98th 99th 100th 101st 102nd 103rd 104th 105th 106th |
Elected in 1980. Re-elected in 1982. Re-elected in 1984. Re-elected in 1986. Re-elected in 1988. Re-elected in 1990. Re-elected in 1992. Re-elected in 1994. Re-elected in 1996. Re-elected in 1998. Lost re-election. | |
 Rob Simmons (Stonington) |
Republican | January 3, 2001 – January 3, 2007 |
107th 108th 109th |
Elected in 2000. Re-elected in 2002. Re-elected in 2004. Lost re-election. | |
2003–2013 | |||||
 Joe Courtney (Vernon) |
Democratic | January 3, 2007 – present |
110th 111th 112th 113th 114th 115th 116th 117th 118th |
Elected in 2006. Re-elected in 2008. Re-elected in 2010. Re-elected in 2012. Re-elected in 2014. Re-elected in 2016. Re-elected in 2018. Re-elected in 2020. Re-elected in 2022. | |
2013–2023.tif.png.webp) | |||||
2023–present.svg.png.webp) | |||||
References
- "My Congressional District".
- "2022 Cook PVI: District Map and List". Cook Political Report. Retrieved January 10, 2023.
- "Registration and Party Enrollment Statistics as of October 31, 2023" (PDF). Connecticut Secretary of State. Retrieved December 13, 2023.
- "Archived copy" (PDF). Archived from the original (PDF) on December 16, 2006. Retrieved December 4, 2006.
{{cite web}}: CS1 maint: archived copy as title (link) 2006 Official Election Results
- Martis, Kenneth C. (1989). The Historical Atlas of Political Parties in the United States Congress. New York: Macmillan Publishing Company.
- Martis, Kenneth C. (1982). The Historical Atlas of United States Congressional Districts. New York: Macmillan Publishing Company.
- Congressional Biographical Directory of the United States 1774–present
This article is issued from Wikipedia. The text is licensed under Creative Commons - Attribution - Sharealike. Additional terms may apply for the media files.