1957 Indian general election
General elections were held in India between 24 February and 14 March 1957, the second elections to the Lok Sabha after independence. Elections to many state legislatures were held simultaneously.
| |||||||||||||||||||||||||||||||||||||
494 of the 505 seats in the Lok Sabha 248 seats needed for a majority | |||||||||||||||||||||||||||||||||||||
|---|---|---|---|---|---|---|---|---|---|---|---|---|---|---|---|---|---|---|---|---|---|---|---|---|---|---|---|---|---|---|---|---|---|---|---|---|---|
| Registered | 193,652,179 | ||||||||||||||||||||||||||||||||||||
| Turnout | 45.44% ( | ||||||||||||||||||||||||||||||||||||
| |||||||||||||||||||||||||||||||||||||
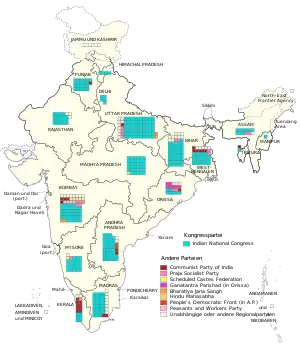 Results by constituency | |||||||||||||||||||||||||||||||||||||
| |||||||||||||||||||||||||||||||||||||

.jpg.webp)
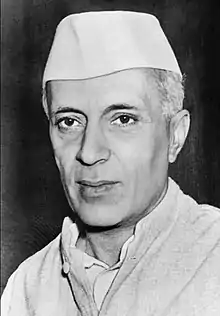
Under the leadership of Jawaharlal Nehru, the Indian National Congress easily won a second term in power, taking 371 of the 494 seats. They gained an extra seven seats (the size of the Lok Sabha had been increased by five) and their vote share increased from 45% to 48%. The INC received nearly five times more votes than the Communist Party, the second largest party. In addition, 19% of the vote and 42 seats went to independent candidates, the highest of any Indian general election.
Electoral system
There were 494 seats elected using first past the post voting. Out of the 403 constituencies, 91 elected two members, while the remaining 312 elected a single member.[1][2] The multi-seat constituencies were abolished before the next election.
The elections were overseen by Sukumar Sen, the Chief Election Commissioner, who used the existing election infrastructure to reduce costs and improve efficiency. Historian Ramachandra Guha wrote "this general election cost the exchequer Rs45 million less than the previous one. The prudent Sen had safely stored the 3.5 million ballot boxes the first time round and only half a million additional ones were required."[3]
Results
 | |||||
|---|---|---|---|---|---|
| Party | Votes | % | Seats | +/– | |
| Indian National Congress | 57,579,589 | 47.78 | 371 | ||
| Praja Socialist Party | 12,542,666 | 10.41 | 19 | ||
| Communist Party of India | 10,754,075 | 8.92 | 27 | ||
| Bharatiya Jana Sangh | 7,193,267 | 5.97 | 4 | ||
| Scheduled Castes Federation | 2,038,890 | 1.69 | 6 | ||
| All India Ganatantra Parishad | 1,291,141 | 1.07 | 7 | ||
| People's Democratic Front | 1,044,032 | 0.87 | 2 | ||
| Hindu Mahasabha | 1,032,322 | 0.86 | 1 | ||
| Peasants and Workers Party of India | 924,832 | 0.77 | 4 | ||
| Jharkhand Party | 751,830 | 0.62 | 6 | ||
| Forward Bloc (Marxist) | 665,341 | 0.55 | 2 | ||
| Chota Nagpur Santhal Parganas Janata Party | 501,359 | 0.42 | 3 | ||
| Akhil Bharatiya Ram Rajya Parishad | 460,838 | 0.38 | 0 | ||
| Revolutionary Socialist Party | 308,742 | 0.26 | 0 | ||
| Praja Party | 140,742 | 0.12 | 0 | 0 | |
| Independents | 23,284,249 | 19.32 | 42 | ||
| Appointed members[lower-alpha 1] | 11 | ||||
| Total | 120,513,915 | 100.00 | 505 | ||
| Registered voters/turnout | 193,652,179 | 45.44 | |||
| Source: ECI | |||||
- Six representing Jammu and Kashmir, two representing Anglo-Indians, one representing Part B Tribal Areas in Assam, one representing the Amindive, Laccadive and Minicoy Islands and one representing the Andaman and Nicobar Islands.
Results by state
| State | Total seats |
Seats won | |||||||||
|---|---|---|---|---|---|---|---|---|---|---|---|
| INC | CPI | PSP | GP | SCF | JKP | BJS | Others | Ind. | App. | ||
| Andaman and Nicobar Islands | 1 | 1 | |||||||||
| Andhra Pradesh | 43 | 37 | 2 | 2 | 2 | ||||||
| Assam | 12 | 9 | 2 | 1 | |||||||
| Bihar | 53 | 41 | 2 | 6 | 3 | 1 | |||||
| Bombay | 66 | 38 | 4 | 5 | 5 | 2 | 4 | 8 | |||
| Delhi | 5 | 5 | |||||||||
| Himachal Pradesh | 4 | 4 | |||||||||
| Kerala | 18 | 6 | 9 | 1 | 2 | ||||||
| Jammu and Kashmir | 6 | 6 | |||||||||
| Laccadive, Minicoy, and Amindivi Islands | 1 | 1 | |||||||||
| Madhya Pradesh | 36 | 35 | 1 | ||||||||
| Madras | 41 | 31 | 2 | 8 | |||||||
| Manipur | 2 | 1 | 1 | ||||||||
| Mysore | 26 | 23 | 1 | 1 | 1 | ||||||
| North-East Frontier Agency | 1 | 1 | |||||||||
| Orissa | 20 | 7 | 1 | 2 | 7 | 3 | |||||
| Punjab | 22 | 21 | 1 | ||||||||
| Rajasthan | 22 | 19 | 3 | ||||||||
| Tripura | 2 | 1 | 1 | ||||||||
| Uttar Pradesh | 86 | 70 | 1 | 4 | 2 | 9 | |||||
| West Bengal | 36 | 23 | 6 | 2 | 2 | 3 | |||||
| Anglo-Indians | 2 | 2 | |||||||||
| Total | 505 | 371 | 27 | 19 | 7 | 6 | 6 | 4 | 12 | 42 | 11 |
| Source: ECI | |||||||||||
Andhra Pradesh
| Party | Votes | % | Seats | |
|---|---|---|---|---|
| Indian National Congress | 4,906,044 | 51.47 | 37 | |
| Communist Party of India | 1,144,811 | 12.01 | 2 | |
| People's Democratic Front | 1,044,032 | 10.95 | 2 | |
| Other parties | 600,686 | 6.30 | 0 | |
| Independents | 1,835,800 | 19.26 | 2 | |
| Total | 9,531,373 | 100.00 | 43 | |
Assam
| Party | Votes | % | +/– | Seats | +/– | |
|---|---|---|---|---|---|---|
| Indian National Congress | 1,184,708 | 51.68 | +5.94 | 9 | –2 | |
| Praja Socialist Party | 457,643 | 19.96 | –9.23 | 2 | +1 | |
| Communist Party of India | 235,044 | 10.25 | New | 0 | New | |
| Independents | 415,217 | 18.11 | +4.37 | 1 | +1 | |
| Total | 2,292,612 | 100.00 | – | 12 | 0 | |
Bihar
| Party | Votes | % | +/– | Seats | +/– | |
|---|---|---|---|---|---|---|
| Indian National Congress | 4,450,208 | 44.47 | –1.30 | 41 | –4 | |
| Jharkhand Party | 751,830 | 7.51 | +0.10 | 6 | +3 | |
| Chota Nagpur Santhal Parganas Janata Party | 501,359 | 5.01 | +2.65 | 3 | +2 | |
| Praja Socialist Party | 2,165,462 | 21.64 | –2.83 | 2 | –1 | |
| Communist Party of India | 502,707 | 5.02 | +4.62 | 0 | 0 | |
| Other parties | 51,416 | 0.51 | –6.00 | 0 | –2 | |
| Independents | 1,584,894 | 15.84 | +2.76 | 1 | 0 | |
| Total | 10,007,876 | 100.00 | – | 53 | –2 | |
Bombay
| Party | Votes | % | +/– | Seats | +/– | |
|---|---|---|---|---|---|---|
| Indian National Congress | 8,156,272 | 48.66 | –1.49 | 38 | –2 | |
| Praja Socialist Party | 1,457,203 | 8.69 | –11.45 | 5 | +5 | |
| Scheduled Caste Federation | 1,354,475 | 8.08 | +3.65 | 5 | +4 | |
| Communist Party of India | 1,055,013 | 6.29 | +4.95 | 4 | +4 | |
| Peasants and Workers Party of India | 924,832 | 5.52 | –1.48 | 4 | +3 | |
| Bharatiya Jana Sangh | 566,008 | 3.38 | New | 2 | New | |
| Other parties | 136,749 | 0.82 | –4.14 | 0 | 0 | |
| Independents | 3,109,733 | 18.55 | +6.58 | 8 | +5 | |
| Total | 16,760,285 | 100.00 | – | 66 | +21 | |
Kerala
| Party | Votes | % | Seats | |
|---|---|---|---|---|
| Communist Party of India | 2,267,888 | 37.48 | 9 | |
| Indian National Congress | 2,102,883 | 34.76 | 6 | |
| Praja Socialist Party | 438,459 | 7.25 | 1 | |
| Revolutionary Socialist Party | 308,742 | 5.10 | 0 | |
| Independents | 932,274 | 15.41 | 2 | |
| Total | 6,050,246 | 100.00 | 18 | |
Madhya Pradesh
| Party | Votes | % | +/– | Seats | +/– | |
|---|---|---|---|---|---|---|
| Indian National Congress | 3,967,199 | 52.10 | +0.47 | 35 | +8 | |
| Hindu Mahasabha | 373,503 | 4.91 | +4.60 | 1 | +1 | |
| Praja Socialist Party | 1,225,735 | 16.10 | –2.38 | 0 | 0 | |
| Bharatiya Jana Sangh | 1,062,936 | 13.96 | +9.02 | 0 | 0 | |
| Other parties | 376,441 | 4.94 | –7.77 | 0 | 0 | |
| Independents | 608,408 | 7.99 | –3.94 | 0 | –2 | |
| Total | 7,614,222 | 100.00 | – | 36 | +7 | |
Madras
| Party | Votes | % | +/– | Seats | +/– | |
|---|---|---|---|---|---|---|
| Indian National Congress | 5,094,552 | 46.52 | +10.13 | 31 | –4 | |
| Communist Party of India | 1,101,338 | 10.06 | +1.11 | 2 | –6 | |
| Praja Socialist Party | 399,789 | 3.65 | –11.43 | 0 | –8 | |
| Independents | 4,355,162 | 39.77 | +16.62 | 8 | –7 | |
| Total | 10,950,841 | 100.00 | – | 41 | –34 | |
Mysore
| Party | Votes | % | +/– | Seats | +/– | |
|---|---|---|---|---|---|---|
| Indian National Congress | 3,219,014 | 55.52 | –13.42 | 23 | +13 | |
| Praja Socialist Party | 1,082,698 | 18.67 | –10.79 | 1 | 0 | |
| Scheduled Caste Federation | 115,214 | 1.99 | New | 1 | New | |
| Other parties | 228,979 | 3.95 | 0 | 0 | ||
| Independents | 1,152,535 | 19.88 | +9.52 | 1 | +1 | |
| Total | 5,798,440 | 100.00 | – | 26 | +15 | |
Orissa
| Party | Votes | % | +/– | Seats | +/– | |
|---|---|---|---|---|---|---|
| Indian National Congress | 1,776,767 | 40.01 | –2.50 | 7 | –4 | |
| All India Ganatantra Parishad | 1,291,141 | 29.08 | +2.85 | 7 | +1 | |
| Praja Socialist Party | 684,023 | 15.40 | –1.44 | 2 | +1 | |
| Communist Party of India | 214,903 | 4.84 | –0.93 | 1 | 0 | |
| Independents | 473,656 | 10.67 | +2.02 | 3 | +2 | |
| Total | 4,440,490 | 100.00 | – | 20 | 0 | |
Punjab
| Party | Votes | % | +/– | Seats | +/– | |
|---|---|---|---|---|---|---|
| Indian National Congress | 3,682,219 | 51.26 | +8.50 | 21 | +5 | |
| Communist Party of India | 1,207,600 | 16.81 | +11.77 | 1 | +1 | |
| Bharatiya Jana Sangh | 1,152,672 | 16.05 | +10.45 | 0 | 0 | |
| Other parties | 333,630 | 4.64 | –23.32 | 0 | –2 | |
| Independents | 807,709 | 11.24 | –7.40 | 0 | 0 | |
| Total | 7,183,830 | 100.00 | – | 22 | +4 | |
Rajasthan
| Party | Votes | % | +/– | Seats | +/– | |
|---|---|---|---|---|---|---|
| Indian National Congress | 2,494,094 | 53.65 | +12.23 | 19 | +10 | |
| Bharatiya Jana Sangh | 518,355 | 11.15 | +8.11 | 0 | –1 | |
| Other parties | 356,278 | 7.66 | –18.72 | 0 | –4 | |
| Independents | 1,280,356 | 27.54 | –1.62 | 3 | –3 | |
| Total | 4,649,083 | 100.00 | – | 22 | +2 | |
Uttar Pradesh
| Party | Votes | % | +/– | Seats | +/– | |
|---|---|---|---|---|---|---|
| Indian National Congress | 10,599,639 | 46.29 | –6.70 | 70 | –11 | |
| Praja Socialist Party | 3,511,157 | 15.34 | –2.50 | 4 | +2 | |
| Bharatiya Jana Sangh | 3,385,247 | 14.79 | +7.50 | 2 | +2 | |
| Communist Party of India | 383,509 | 1.67 | +1.32 | 1 | +1 | |
| Akhil Bharatiya Ram Rajya Parishad | 98,138 | 0.43 | –3.12 | 0 | 0 | |
| Independents | 4,918,413 | 21.48 | +10.14 | 9 | +7 | |
| Total | 22,896,103 | 100.00 | – | 86 | 0 | |
West Bengal
| Party | Votes | % | +/– | Seats | +/– | |
|---|---|---|---|---|---|---|
| Indian National Congress | 5,031,696 | 48.20 | +6.10 | 23 | –1 | |
| Communist Party of India | 1,985,181 | 19.01 | +9.55 | 6 | +1 | |
| Marxist Forward Bloc | 665,341 | 6.37 | +1.85 | 2 | +2 | |
| Praja Socialist Party | 590,692 | 5.66 | –5.26 | 2 | +2 | |
| Hindu Mahasabha | 561,741 | 5.38 | +1.11 | 0 | –1 | |
| Bharatiya Jana Sangh | 149,351 | 1.43 | –4.51 | 0 | –2 | |
| Independents | 1,456,098 | 13.95 | –4.51 | 3 | +3 | |
| Total | 10,440,100 | 100.00 | – | 36 | +2 | |
Women performance in elections
Based on the published data from the Election Commission of India (ECI) website.[4]
Participation
| State/UT | Total seats | Women contestants | Elected | Women contestants (%) | Elected (%) | |
|---|---|---|---|---|---|---|
| Women | Seats | |||||
| Andhra Pradesh | 43 | 4 | 3 | 3 | 3.5% | 6.9% |
| Assam | 12 | 2 | 2 | 2 | 6.5% | 14.3% |
| Bihar | 53 | 7 | 7 | 5 | 3.7% | 9.4% |
| Bombay | 66 | 5 | 5 | 3 | 3.11% | 4.5% |
| Kerala | 18 | 1 | 1 | 0 | 1.7% | 0 |
| Madhya Pradesh | 36 | 8 | 6 | 3 | 6.6% | 8.3% |
| Madras | 41 | 2 | 2 | 1 | 3.2% | 2.4% |
| Mysore | 26 | 0 | 0 | 0 | 0 | 0 |
| Manipur | 2 | 0 | 0 | 0 | 0 | 0 |
| Orissa | 20 | 0 | 0 | 0 | 0 | 0 |
| Punjab | 22 | 1 | 1 | 1 | 1.3% | 4.5% |
| Rajasthan | 22 | 0 | 0 | 0 | 0 | 0 |
| Tripura | 1 | 0 | 0 | 0 | 0 | 0 |
| Uttar Pradesh | 86 | 6 | 4 | 1 | 2.05% | 13.75% |
| West Bengal | 36 | 5 | 4 | 2 | 11.59% | 1.1% |
| Delhi | 5 | 4 | 2 | 1 | 14.8% | 20% |
| Himachal Pradesh | 4 | 0 | 0 | 0 | 0 | 0 |
| India | 494 | 45 | 37 | 22 | 2.96% | 4.45% |
Voting
The first instance of booth capturing in India was recorded in 1957 in the General Elections of that year in Rachiyahi, in Begusarai's Matihani assembly seat.[5][6][7][8]
See also
- List of members of the 2nd Lok Sabha
- Election Commission of India
- Booth capturing
- 1957 Indian presidential election
References
- "Statistical Report on General Election, 1957 : To the Second Lok Sabha Volume-I" (PDF). Election Commission of India. p. 5. Archived (PDF) from the original on 20 March 2012. Retrieved 11 July 2015.
- "Statistical Report on General Election, 1957 : To the Second Lok Sabha Volume-II" (PDF). Election Commission of India. Archived (PDF) from the original on 6 June 2016. Retrieved 11 July 2015.
- Guha, Ramachandra (2022). India after Gandhi: the history of the world's largest democracy (10th anniversary edition, updated and expanded, first published in hardcover ed.). New Delhi: Picador India. ISBN 978-93-82616-97-9.
- "Statistical Report on General Election, 1957 : To the Second Lok Sabha Volume-I" (PDF). Election Commission of India. p. 5. Archived (PDF) from the original on 20 March 2012. Retrieved 11 July 2015.
- "Where booth capturing was born". Archived from the original on 20 June 2018. Retrieved 21 September 2015.
- "In central Bihar, development runs into caste wall". Archived from the original on 30 July 2018. Retrieved 21 September 2015.
- "Empty words in legend's forgotten village". Archived from the original on 13 October 2015.
- "The myth of history's first booth capturing taking place in Begusarai's Rachiyahi". Archived from the original on 12 October 2015. Retrieved 18 October 2015.
| General elections | |
|---|---|
| State elections |
|