Kentucky's 2nd congressional district
Kentucky's 2nd congressional district is a congressional district in the U.S. state of Kentucky. Located in west central Kentucky, the district includes Bowling Green, Owensboro, Elizabethtown, and a portion of eastern Louisville. The district has not seen an incumbent defeated since 1884.
| Kentucky's 2nd congressional district | |||
|---|---|---|---|
Interactive map of district boundaries since January 3, 2023 | |||
| Representative |
| ||
| Distribution |
| ||
| Population (2022) | 756,377[2] | ||
| Median household income | $61,768[3] | ||
| Ethnicity |
| ||
| Cook PVI | R+21[4] | ||
.svg.png.webp)
The district is currently represented by Republican Brett Guthrie.
Former Representative Democrat William Natcher is noted for holding the record for most consecutive roll call votes in the history of Congress—more than 18,000 votes.
Characteristics
The district is similar in character to the 1st district. While Democrats still hold most local offices in the district, they tend to be very conservative on social issues, a trend that leads them to vote Republican in most national elections.
| Voter registration and party enrollment as of October 2023[5] | |||||
|---|---|---|---|---|---|
| Party | Number of voters | Percentage | |||
| Republican | 280,024 | 49.65% | |||
| Democratic | 227,264 | 40.30% | |||
| Other | 33,936 | 6.02% | |||
| Independent | 22,761 | 4.03% | |||
| Total | 563,985 | 100% | |||
Until January 1, 2006, Kentucky did not track party affiliation for registered voters who were neither Democratic nor Republican.[6] The Kentucky voter registration card does not explicitly list anything other than Democratic Party, Republican Party, or Other, with the "Other" option having a blank line and no instructions on how to register as something else.[7]
Kentucky counties within the 2nd congressional district: Barren, Breckinridge, Bullitt, Butler, Daviess, Edmonson, Grayson, Green, Hancock, Hardin, Hart, Jefferson (partial), LaRue, Logan (partial), McLean, Meade, Muhlenberg, Nelson (partial), Ohio, Warren.
Recent statewide elections
| Election results from statewide races | ||
|---|---|---|
| Year | Office | Results |
| 2000 | President | Bush 62–37% |
| 2004 | President | Bush 65–34% |
| 2008 | President | McCain 61–38% |
| 2012 | President | Romney 63–35% |
| 2016 | President | Trump 68–28% |
| Senate | Paul 61–39% | |
| 2019 | Governor | Bevin 54–44% |
| Attorney General | Cameron 64–36% | |
| 2020 | President | Trump 67–31% |
| Senate | McConnell 62–33% | |
| 2022 | Senate | Paul 68–32% |
| 2023 | Governor | Cameron 54–46% |
List of members representing the district
| Member | Party | Years | Cong ress |
Electoral history | Location |
|---|---|---|---|---|---|
| District created November 8, 1792 | |||||
| Alexander D. Orr (Maysville) |
Anti-Administration | November 8, 1792 – March 3, 1795 |
2nd 3rd 4th |
Elected September 7, 1792. Re-elected in 1793. Re-elected in 1795. Retired. |
1792–1797: "Northern district": Bourbon, Fayette, Mason, Scott, and Woodford counties |
| Democratic-Republican | March 4, 1795 – March 3, 1797 | ||||
| John Fowler (Lexington) |
Democratic-Republican | March 4, 1797 – March 3, 1803 |
5th 6th 7th |
Elected in 1797. Re-elected in 1799. Re-elected in 1801. Redistricted to the 5th district. |
1797–1803: "Northern district": Bourbon, Campbell, Clark, Fayette, Franklin, Harrison, Mason, Scott, and Woodford counties |
 John Boyle (Lancaster) |
Democratic-Republican | March 4, 1803 – March 3, 1809 |
8th 9th 10th |
Elected in 1803. Re-elected in 1804. Re-elected in 1806. Retired. |
1803–1813 [data missing] |
| Samuel McKee (Lancaster) |
Democratic-Republican | March 4, 1809 – March 3, 1813 |
11th 12th |
Elected in 1808. Re-elected in 1810. Redistricted to the 7th district. | |
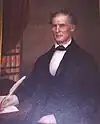
 Henry Clay (Lexington) |
Democratic-Republican | March 4, 1813 – January 19, 1814 |
13th | Redistricted from the 5th district and re-elected in 1812. Resigned to accept a position as diplomatic envoy to Great Britain. |
1813–1823 [data missing] |
| Vacant | January 19, 1814 – March 29, 1814 | ||||
| Joseph H. Hawkins (Lexington) |
Democratic-Republican | March 29, 1814 – March 3, 1815 |
Elected to finish Clay's term. Retired. | ||
| Vacant | March 3, 1815 – October 30, 1815 |
14th | Henry Clay was re-elected in 1814, but the Governor declared the seat vacant as Clay was out of the country. | ||
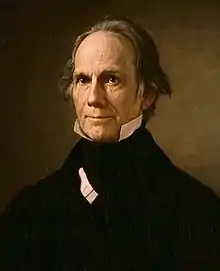
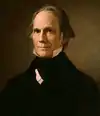 Henry Clay (Lexington) |
Democratic-Republican | October 30, 1815 – March 3, 1821 |
14th 15th 16th |
Elected to finish his vacant term. Re-elected in 1816. Re-elected in 1818. Retired. | |
| Samuel H. Woodson (Lexington) |
Democratic-Republican | March 4, 1821 – March 3, 1823 |
17th | Elected in 1820. Redistricted to the 7th district and lost re-election. | |
 Thomas Metcalfe (Carlisle) |
Democratic-Republican | March 3, 1823 – March 3, 1825 |
18th 19th 20th |
Redistricted from the 4th district and re-elected in 1822. Re-elected in 1824. Re-elected in 1827. Resigned to run for Governor of Kentucky. |
1823–1833 Bourbon, Bracken, Mason, Nicholas counties |
| Anti-Jacksonian | March 4, 1825 – June 1, 1828 | ||||
| Vacant | June 1, 1828 – December 1, 1828 |
20th | |||
 John Chambers (Washington) |
Anti-Jacksonian | December 1, 1828 – March 3, 1829 |
Elected to finish Metcalfe's term. Retired. | ||
| Nicholas D. Coleman (Washington) |
Jacksonian | March 4, 1829 – March 3, 1831 |
21st | Elected in 1829. Retired. | |
| Thomas A. Marshall (Paris) |
Anti-Jacksonian | March 4, 1831 – March 3, 1833 |
22nd | Elected in 1831. Redistricted to the 12th district. | |
| Albert G. Hawes (Hawesville) |
Jacksonian | March 4, 1833 – March 3, 1837 |
23rd 24th |
Redistricted from the 11th district and re-elected in 1833. Re-elected in 1835. Retired. |
1833–1843 [data missing] |
 Edward Rumsey (Greenville) |
Whig | March 4, 1837 – March 3, 1839 |
25th | Elected in 1837. Retired. | |
| Philip Triplett (Owensboro) |
Whig | March 4, 1839 – March 3, 1843 |
26th 27th |
Elected in 1839. Re-elected in 1841. Retired. | |
| Willis Green (Green) |
Whig | March 4, 1843 – March 3, 1845 |
28th | Redistricted from the 6th district and re-elected in 1843. Retired. |
1843–1853 [data missing] |
| John H. McHenry (Hartford) |
Whig | March 4, 1845 – March 3, 1847 |
29th | Elected in 1845. Renominated but withdrew prior to election. | |
 Beverly L. Clarke (Franklin) |
Democratic | March 4, 1847 – March 3, 1849 |
30th | Elected in 1847. Retired to become a delegate to the state constitutional convention. | |
| James L. Johnson (Owensboro) |
Whig | March 4, 1849 – March 3, 1851 |
31st | Elected in 1849. Renominated but declined. | |
| Benjamin E. Grey (Hopkinsville) |
Whig | March 4, 1851 – March 3, 1855 |
32nd 33rd |
Elected in 1851. Re-elected in 1853. Lost re-election. | |
| 1853–1863 [data missing] | |||||
| John P. Campbell Jr. (Belleview) |
Know Nothing | March 4, 1855 – March 3, 1857 |
34th | Elected in 1855. Renominated but declined. | |
 Samuel Peyton (Hartford) |
Democratic | March 4, 1857 – March 3, 1861 |
35th 36th |
Elected in 1857. Re-elected in 1859. Lost renomination. | |
 James S. Jackson (Hopkinsville) |
Unionist | March 4, 1861 – December 13, 1861 |
37th | Elected in 1861. Resigned to enter the Union Army. | |
| Vacant | December 13, 1861 – December 1, 1862 | ||||
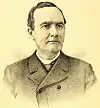
.jpg.webp) George H. Yeaman (Owensboro) |
Unionist | December 1, 1862 – March 3, 1865 |
37th 38th |
Elected to finish Jackson's term. Re-elected in 1863. Lost re-election. | |
| 1863–1873 [data missing] | |||||
 Burwell C. Ritter (Hopkinsville) |
Democratic | March 4, 1865 – March 3, 1867 |
39th | Elected in 1865. Retired. | |
| Vacant | March 4, 1867 – March 3, 1869 |
40th | John Y. Brown was elected in 1867 but the seat was declared vacant due to Brown's alleged disloyalty during the Civil War, and the district refused to elect anyone to fill the vacancy. | ||
 William N. Sweeney (Owensboro) |
Democratic | March 4, 1869 – March 3, 1871 |
41st | Elected in 1868. Renominated but declined. | |
 Henry D. McHenry (Hartford) |
Democratic | March 4, 1871 – March 3, 1873 |
42nd | Elected in 1870. Retired. | |
 John Y. Brown (Henderson) |
Democratic | March 4, 1873 – March 3, 1877 |
43rd 44th |
Elected in 1872. Re-elected in 1874. Retired. |
1873–1883 [data missing] |
 James A. McKenzie (Long View) |
Democratic | March 4, 1877 – March 3, 1883 |
45th 46th 47th |
Elected in 1876. Re-elected in 1878. Re-elected in 1880. Lost renomination. | |
| James F. Clay (Henderson) |
Democratic | March 4, 1883 – March 3, 1885 |
48th | Elected in 1882. Lost renomination. |
1883–1893 [data missing] |
 Polk Laffoon (Madisonville) |
Democratic | March 4, 1885 – March 3, 1889 |
49th 50th |
Elected in 1884. Re-elected in 1886. Retired. | |
 William T. Ellis (Owensboro) |
Democratic | March 4, 1889 – March 3, 1895 |
51st 52nd 53rd |
Elected in 1888. Re-elected in 1890. Re-elected in 1892. Retired. | |
| 1893–1903 [data missing] | |||||
 John D. Clardy (Newstead) |
Democratic | March 4, 1895 – March 3, 1899 |
54th 55th |
Elected in 1894. Re-elected in 1896. Retired. | |
 Henry D. Allen (Morganfield) |
Democratic | March 4, 1899 – March 3, 1903 |
56th 57th |
Elected in 1898. Re-elected in 1900. Retired. | |
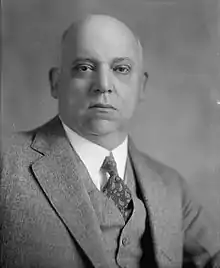 Augustus O. Stanley (Henderson) |
Democratic | March 4, 1903 – March 3, 1915 |
58th 59th 60th 61st 62nd 63rd |
Elected in 1902. Re-elected in 1904. Re-elected in 1906. Re-elected in 1908. Re-elected in 1910. Re-elected in 1912. Retired to run for U.S. Senator. |
1903–1913 [data missing] |
| 1913–1923 [data missing] | |||||
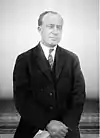 David H. Kincheloe (Madisonville) |
Democratic | March 4, 1915 – October 5, 1930 |
64th 65th 66th 67th 68th 69th 70th 71st |
Elected in 1914. Re-elected in 1916. Re-elected in 1918. Re-elected in 1920. Re-elected in 1922. Re-elected in 1924. Re-elected in 1926. Re-elected in 1928. Resigned when appointed to the U.S. Customs Court. | |
| 1923–1933 [data missing] | |||||
| Vacant | October 5, 1930 – November 4, 1930 |
71st | |||
| John L. Dorsey Jr. (Henderson) |
Democratic | November 4, 1930 – March 3, 1931 |
Elected to finish Kincheloe's term. Retired. | ||
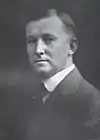 Glover H. Cary (Owensboro) |
Democratic | March 4, 1931 – March 3, 1933 |
72nd | Elected in 1930. Redistricted to the at-large district. | |
| District inactive | March 4, 1933 – March 3, 1935 |
73rd | |||
Glover H. Cary (Owensboro) |
Democratic | March 4, 1935 – December 5, 1936 |
74th | Redistricted from the at-large district and re-elected in 1934. Died. |
1935–1943 [data missing] |
| Vacant | December 5, 1936 – March 2, 1937 | ||||
| Beverly M. Vincent (Brownsville) |
Democratic | March 2, 1937 – January 3, 1945 |
74th 75th 76th 77th 78th |
Elected to finish Cary's term. Also elected to the next full term. Re-elected in 1938. Re-elected in 1940. Re-elected in 1942. Retired. | |
| 1943–1953 [data missing] | |||||
 Earle Clements (Morganfield) |
Democratic | January 3, 1945 – January 6, 1948 |
79th 80th |
Elected in 1944. Re-elected in 1946. Resigned when elected Governor of Kentucky. | |
| Vacant | January 6, 1948 – April 17, 1948 |
80th | |||
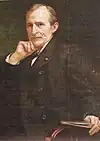
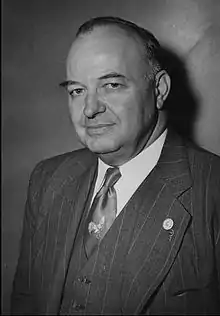
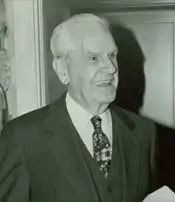
.jpg.webp) John A. Whitaker (Russellville) |
Democratic | April 17, 1948 – December 15, 1951 |
80th 81st 82nd |
Elected to finish Clements's term. Re-elected in 1948. Re-elected in 1950. Died. | |
| Vacant | December 15, 1951 – August 2, 1952 |
82nd | |||
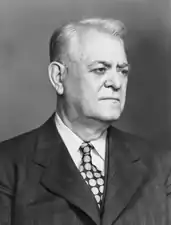 Garrett Withers (Dixon) |
Democratic | August 2, 1952 – April 30, 1953 |
82nd 83rd |
Elected to finish Whitaker's term. Re-elected later in 1952. Died. | |
| 1953–1963 [data missing] | |||||
| Vacant | April 30, 1953 – August 1, 1953 |
83rd | |||
 William Natcher (Bowling Green) |
Democratic | August 1, 1953 – March 29, 1994 |
83rd 84th 85th 86th 87th 88th 89th 90th 91st 92nd 93rd 94th 95th 96th 97th 98th 99th 100th 101st 102nd 103rd |
Elected to finish Wither's term. Re-elected in 1954. Re-elected in 1956. Re-elected in 1958. Re-elected in 1960. Re-elected in 1962. Re-elected in 1964. Re-elected in 1966. Re-elected in 1968. Re-elected in 1970. Re-elected in 1972. Re-elected in 1974. Re-elected in 1976. Re-elected in 1978. Re-elected in 1980. Re-elected in 1982. Re-elected in 1984. Re-elected in 1986. Re-elected in 1988. Re-elected in 1990. Re-elected in 1992. Died. | |
| 1963–1973 [data missing] | |||||
| 1973–1983 [data missing] | |||||
| 1983–1993 [data missing] | |||||
| 1993–2003 [data missing] | |||||
| Vacant | March 29, 1994 – May 24, 1994 |
103rd | |||
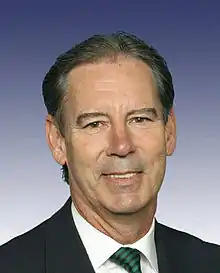 Ron Lewis (Cecilia) |
Republican | May 24, 1994 – January 3, 2009 |
103rd 104th 105th 106th 107th 108th 109th 110th |
Elected to finish Natcher's term. Re-elected in 1994. Re-elected in 1996. Re-elected in 1998. Re-elected in 2000. Re-elected in 2002. Re-elected in 2004. Re-elected in 2006. Retired. | |
2003–2013 | |||||
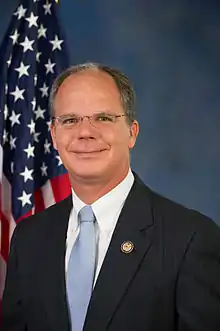 Brett Guthrie (Bowling Green) |
Republican | January 3, 2009 – present |
111th 112th 113th 114th 115th 116th 117th 118th |
Elected in 2008. Re-elected in 2010. Re-elected in 2012. Re-elected in 2014. Re-elected in 2016. Re-elected in 2018. Re-elected in 2020. Re-elected in 2022. | |
2013–2023.tif.png.webp) Counties: Barren, Boyle, Breckinridge, Bullitt, Butler, Daviess, Edmonson, Garrard, Grayson, Green, Hancock, Hardin, Hart, Jessamine (partial), LaRue, Meade, Mercer, Nelson, Spencer (partial), Warren, Washington (partial) | |||||
2023–present.svg.png.webp) | |||||
Recent election results
2002
| Party | Candidate | Votes | % | |
|---|---|---|---|---|
| Republican | Ron Lewis (Incumbent) | 122,773 | 69.64% | |
| Democratic | David Lynn Williams | 51,431 | 29.17% | |
| Libertarian | Robert Guy Dyer | 2,084 | 1.18% | |
| Total votes | 176,288 | 100.00% | ||
| Turnout | {{{votes}}} | |||
| Republican hold | ||||
2004
| Party | Candidate | Votes | % | |
|---|---|---|---|---|
| Republican | Ron Lewis (Incumbent) | 185,394 | 67.92% | |
| Democratic | Adam Smith | 87,585 | 32.08% | |
| Total votes | 272,979 | 100.00% | ||
| Turnout | {{{votes}}} | |||
| Republican hold | ||||
2006
| Party | Candidate | Votes | % | |
|---|---|---|---|---|
| Republican | Ron Lewis (Incumbent) | 118,548 | 55.41% | |
| Democratic | Mike Weaver | 95,415 | 44.59% | |
| Total votes | 213,963 | 100.00% | ||
| Turnout | {{{votes}}} | |||
| Republican hold | ||||
2008
| Party | Candidate | Votes | % | |
|---|---|---|---|---|
| Republican | Brett Guthrie | 158,936 | 52.57% | |
| Democratic | David E. Boswell | 143,379 | 47.43% | |
| Total votes | 302,315 | 100.00% | ||
| Turnout | {{{votes}}} | |||
| Republican hold | ||||
2010
| Party | Candidate | Votes | % | |
|---|---|---|---|---|
| Republican | Brett Guthrie (Incumbent) | 155,906 | 67.89% | |
| Democratic | Ed Marksberry | 73,749 | 28.75% | |
| Total votes | 229,655 | 100.00% | ||
| Turnout | {{{votes}}} | |||
| Republican hold | ||||
2012
| Party | Candidate | Votes | % | |
|---|---|---|---|---|
| Republican | Brett Guthrie (Incumbent) | 181,508 | 64.30% | |
| Democratic | David Lynn Williams | 89,541 | 31.72% | |
| Independent | Andrew R. Beacham | 6,304 | 2.23% | |
| Libertarian | Craig Astor | 4,914 | 1.74% | |
| Total votes | 282,267 | 100.00% | ||
| Turnout | {{{votes}}} | |||
| Republican hold | ||||
2014
| Party | Candidate | Votes | % | |
|---|---|---|---|---|
| Republican | Brett Guthrie (Incumbent) | 156,936 | 69.19% | |
| Democratic | Ron Leach | 69,898 | 30.81% | |
| Total votes | 226,834 | 100.00% | ||
| Turnout | {{{votes}}} | |||
| Republican hold | ||||
2016
| Party | Candidate | Votes | % | |
|---|---|---|---|---|
| Republican | Brett Guthrie (Incumbent) | 251,823 | 100.00% | |
| Total votes | 251,823 | 100.00% | ||
| Turnout | {{{votes}}} | |||
| Republican hold | ||||
2018
| Party | Candidate | Votes | % | |
|---|---|---|---|---|
| Republican | Brett Guthrie (Incumbent) | 171,700 | 66.7% | |
| Democratic | Hank Linderman | 79,964 | 31.1% | |
| Independent | Thomas Loecken | 5,681 | 2.2% | |
| Total votes | 257,345 | 100.0% | ||
| Republican hold | ||||
2020
| Party | Candidate | Votes | % | |
|---|---|---|---|---|
| Republican | Brett Guthrie (incumbent) | 255,735 | 70.9 | |
| Democratic | Hank Linderman | 94,643 | 26.3 | |
| Libertarian | Robert Lee Perry | 7,588 | 2.1 | |
| Populist | Lewis Carter | 2,431 | 0.7 | |
| Write-in | 2 | 0.0 | ||
| Total votes | 360,399 | 100.0 | ||
| Republican hold | ||||
2022
| Party | Candidate | Votes | % | |
|---|---|---|---|---|
| Republican | Brett Guthrie (incumbent) | 170,487 | 71.8 | |
| Democratic | Hank Linderman | 66,769 | 28.1 | |
| Total votes | 237,256 | 100.0 | ||
| Republican hold | ||||
See also
- Kentucky's congressional districts
- List of United States congressional districts
References
- Geography. "Congressional Districts Relationship Files (state-based) Bureau". www.census.gov. Archived from the original on July 17, 2017. Retrieved February 11, 2018.
- "My Congressional District". www.census.gov. Center for New Media & Promotion (CNMP), US Census Bureau.
- "My Congressional District Bureau". www.census.gov. Center for New Media & Promotion (CNMP), US Census Bureau.
- "2022 Cook PVI: District Map and List". Cook Political Report. Retrieved January 10, 2023.
- "Registration Statistics". Kentucky State Board of Elections. January 2022.
- "Kentucky Administrative Regulations 31KAR4:150". Kentucky Legislative Research Commission. November 2005. Retrieved February 6, 2014.
- "Register To Vote". Kentucky State Board of Elections. August 2003. Retrieved February 6, 2014.
- Martis, Kenneth C. (1989). The Historical Atlas of Political Parties in the United States Congress. New York: Macmillan Publishing Company.
- Martis, Kenneth C. (1982). The Historical Atlas of United States Congressional Districts. New York: Macmillan Publishing Company.
- Congressional Biographical Directory of the United States 1774–present