Kentucky's 3rd congressional district
Kentucky's 3rd congressional district is a congressional district in the U.S. state of Kentucky. It encompasses almost all of Louisville Metro, which, since the merger of 2003, is consolidated with Jefferson County, though other incorporated cities exist within the county, such as Shively and St. Matthews. The far eastern portions of Louisville Metro are part of the 2nd congressional district.
| Kentucky's 3rd congressional district | |||
|---|---|---|---|
Interactive map of district boundaries since January 3, 2023 | |||
| Representative |
| ||
| Distribution |
| ||
| Population (2022) | 742,826[2] | ||
| Median household income | $63,327[3] | ||
| Ethnicity |
| ||
| Cook PVI | D+9[4] | ||
.svg.png.webp)
The district is currently represented by Democrat Morgan McGarvey. With a Cook Partisan Voting Index rating of D+9, it is the only Democratic district in Kentucky.[4]
Characteristics
The district's character is very different from the rest of Kentucky. It is entirely contained within Jefferson County, and in contrast to the rest of the state, it is urban and leans Democratic. It has the highest percentage of African Americans in the state, who are concentrated in and near Louisville. It is a cosmopolitan, diverse district, with major businesses, health care organizations and universities.
Until January 1, 2006, Kentucky did not track party affiliation for registered voters who were neither Democratic nor Republican.[5] The Kentucky voter registration card does not explicitly list anything other than Democratic Party, Republican Party, or Other, with the "Other" option having a blank line and no instructions on how to register as something else.[6]
| Year (Sept.) | Democratic | Republican | Other | Independent | Libertarian | Green | Constitution | Reform | Socialist Worker's | Male | Female | Registered | ||||||||||||
|---|---|---|---|---|---|---|---|---|---|---|---|---|---|---|---|---|---|---|---|---|---|---|---|---|
| Voters | % | Voters | % | Voters | % | Voters | % | Voters | % | Voters | % | Voters | % | Voters | % | Voters | % | Voters | % | Voters | % | Voters | % | |
| 2017 | 328,432 | 57.835 | 183,755 | 32.358 | 35,988 | 6.337 | 17,632 | 3.105 | 1,568 | 0.276 | 421 | 0.074 | 58 | 0.01 | 4 | 0.001 | 21 | 0.004 | 261,561 | 46.059 | 306,317 | 53.941 | 567,879 | 100 |
| 2018 | 335,172 | 57.984 | 185,426 | 32.078 | 36,011 | 6.23 | 19,204 | 3.322 | 1,724 | 0.298 | 397 | 0.069 | 63 | 0.011 | 7 | 0.001 | 40 | 0.007 | 266,355 | 46.079 | 311,688 | 53.921 | 578,044 | 100 |
| 2019 | 343,512 | 58.24 | 187,470 | 31.784 | 36,222 | 6.141 | 20,313 | 3.444 | 1,832 | 0.311 | 347 | 0.059 | 78 | 0.013 | 6 | 0.001 | 38 | 0.006 | 272,144 | 46.14 | 317,525 | 53.834 | 589,818 | 100 |
| 2020 | 354,146 | 58.045 | 194,002 | 31.797 | 34,855 | 5.713 | 24,185 | 3.964 | 2,317 | 0.38 | 408 | 0.067 | 116 | 0.019 | 24 | 0.004 | 73 | 0.012 | 282,897 | 46.367 | 326,906 | 53.58 | 610,126 | 100 |
| 2021 | 352,605 | 57.916 | 192,258 | 31.579 | 35,335 | 5.804 | 25,549 | 4.196 | 2,407 | 0.395 | 437 | 0.072 | 122 | 0.02 | 26 | 0.004 | 82 | 0.013 | 282,681 | 46.431 | 325,822 | 53.517 | 608,821 | 100 |
| 2022 | 100 | |||||||||||||||||||||||
Recent statewide elections
| Election results from statewide races | ||
|---|---|---|
| Year | Office | Results |
| 2000 | Kentucky | Gore 50–48% |
| 2004 | Kentucky | Kerry 51–49% |
| 2008 | Kentucky | Obama 56–43% |
| 2012 | Kentucky | Obama 56–43% |
| 2016 | Kentucky | Clinton 55–40% |
| Senate | Gray 60–40% | |
| 2019 | Governor | Beshear 68–30% |
| Attorney General | Stumbo 61–39% | |
| 2020 | Kentucky | Biden 60–38% |
| Senate | McGrath 61–36% | |
| 2022 | Senate | Booker 60–40% |
| 2023 | Governor | Beshear 71–29% |
List of members representing the district
| Member | Party | Years | Cong ress |
Electoral history | Location |
|---|---|---|---|---|---|
| District created March 4, 1803 | |||||
| Matthew Walton (Springfield) |
Democratic-Republican | March 4, 1803 – March 3, 1807 |
8th 9th |
Elected in 1803. Re-elected in 1804. Retired. |
1803–1813 Breckinridge, Bullitt, Green, Hardin, Jefferson, Nelson, and Washington counties |
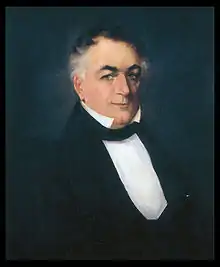
 John Rowan (Louisville) |
Democratic-Republican | March 4, 1807 – March 3, 1809 |
10th | Elected in 1806. Retired. | |
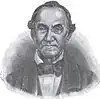
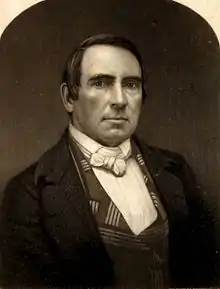
| Henry Crist (Shepherdsville) |
Democratic-Republican | March 4, 1809 – March 3, 1811 |
11th | Elected in 1808. Retired. | |
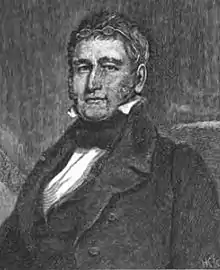
| Stephen Ormsby (Louisville) |
Democratic-Republican | March 4, 1811 – March 3, 1813 |
12th | Elected in 1810. Redistricted to the 8th district and lost re-election. | |
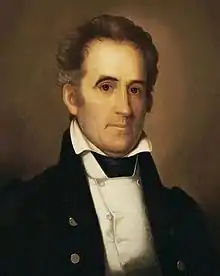 Richard M. Johnson (Great Crossings) |
Democratic-Republican | March 4, 1813 – March 3, 1819 |
13th 14th 15th |
Redistricted from the 4th district and re-elected in 1812. Re-elected in 1814. Re-elected in 1816. Retired. |
1813–1823 Boone, Campbell, Franklin, Gallatin, Harrison, Pendleton, and Scott counties |
| William Brown (Cynthiana) |
Democratic-Republican | March 4, 1819 – March 3, 1821 |
16th | Elected in 1818. Retired. | |
 John T. Johnson (Georgetown) |
Democratic-Republican | March 4, 1821 – March 3, 1823 |
17th | Elected in 1820. Redistricted to the 5th district. | |
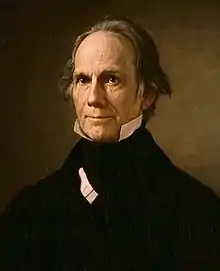 Henry Clay (Lexington) |
Democratic-Republican | March 3, 1823 – March 3, 1825 |
18th 19th |
Elected in 1822. Re-elected in 1824. Resigned to become U.S. Secretary of State. |
1823–1833 Clark, Fayette, and Woodford counties |
| Anti-Jacksonian | March 4, 1825 – March 6, 1825 | ||||
| Vacant | March 6, 1825 – August 1, 1825 |
19th | |||
 James Clark (Winchester) |
Anti-Jacksonian | August 1, 1825 – March 3, 1831 |
19th 20th 21st |
Elected to finish Clay's term and seated December 5, 1825. Re-elected in 1827. Re-elected in 1829. Renominated but declined. | |
| Chilton Allan (Winchester) |
Anti-Jacksonian | March 4, 1831 – March 3, 1833 |
22nd | Elected in 1831. Redistricted to the 10th district. | |
| Christopher Tompkins (Glasgow) |
Anti-Jacksonian | March 4, 1833 – March 3, 1835 |
23rd | Redistricted from the 10th district and re-elected in 1833. Retired to run for state representative. |
1833–1843 [data missing] |
 Joseph R. Underwood (Bowling Green) |
Anti-Jacksonian | March 4, 1835 – March 3, 1837 |
24th 25th 26th 27th |
Elected in 1835. Re-elected in 1837. Re-elected in 1839. Re-elected in 1841. Retired. | |
| Whig | March 4, 1837 – March 3, 1843 | ||||
 Henry Grider (Bowling Green) |
Whig | March 4, 1843 – March 3, 1847 |
28th 29th |
Elected in 1843. Re-elected in 1845. Retired. |
1843–1853 [data missing] |
 Samuel Peyton (Hartford) |
Democratic | March 4, 1847 – March 3, 1849 |
30th | Elected in 1847. Lost re-election. | |
| Finis McLean (Elkton) |
Whig | March 4, 1849 – March 3, 1851 |
31st | Elected in 1849. Retired. | |
| Presley Ewing (Russellville) |
Whig | March 4, 1851 – September 27, 1854 |
32nd 33rd |
Elected in 1851. Re-elected in 1853. Died. | |
| 1853–1863 [data missing] | |||||
| Vacant | September 27, 1854 – December 4, 1854 |
33rd | |||
| Francis Bristow (Elkton) |
Whig | December 4, 1854 – March 3, 1855 |
Elected to finish Ewing's term Lost re-election. | ||
 Warner Underwood (Bowling Green) |
Know Nothing | March 4, 1855 – March 3, 1859 |
34th 35th |
Elected in 1855. Re-elected in 1857. Retired. | |
| Francis Bristow (Elkton) |
Opposition | March 4, 1859 – March 3, 1861 |
36th | Elected in 1859. Retired. | |
Henry Grider (Bowling Green) |
Unionist | March 4, 1861 – March 3, 1865 |
37th 38th 39th |
Elected in 1861. Re-elected in 1863. Re-elected in 1865. Died. | |
| 1863–1873 [data missing] | |||||
| Democratic | March 4, 1865 – September 7, 1866 | ||||
| Vacant | September 7, 1866 – December 3, 1866 |
39th | |||
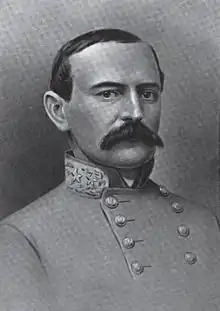
 Elijah Hise (Russellville) |
Democratic | December 3, 1866 – May 8, 1867 |
Elected to finish Grider's term. Also elected to the next full term. Died. | ||
| Vacant | May 8, 1867 – December 5, 1867 |
40th | |||
 Jacob Golladay (Allensville) |
Democratic | December 5, 1867 – February 28, 1870 |
40th 41st |
Elected to finish Hise's term. Re-elected in 1868. Resigned. | |
| Vacant | February 28, 1870 – May 10, 1870 |
41st | |||
 Joseph H. Lewis (Glasgow) |
Democratic | May 10, 1870 – March 3, 1873 |
41st 42nd |
Elected to finish Golladay's term Re-elected in 1870. Retired. | |
 Charles W. Milliken (Franklin) |
Democratic | March 4, 1873 – March 3, 1877 |
43rd 44th |
Elected in 1872. Re-elected in 1874. Retired. |
1873–1883 [data missing] |
 John W. Caldwell (Russellville) |
Democratic | March 4, 1877 – March 3, 1883 |
45th 46th 47th |
Elected in 1876. Re-elected in 1878. Re-elected in 1880. Retired. | |
.jpg.webp) John E. Halsell (Bowling Green) |
Democratic | March 4, 1883 – March 3, 1887 |
48th 49th |
Elected in 1882. Re-elected in 1884. Lost renomination. |
1883–1893 [data missing] |
 W. Godfrey Hunter (Burkesville) |
Republican | March 4, 1887 – March 3, 1889 |
50th | Elected in 1886. Lost re-election. | |
 Isaac Goodnight (Franklin) |
Democratic | March 4, 1889 – March 3, 1895 |
51st 52nd 53rd |
Elected in 1888. Re-elected in 1890. Re-elected in 1892. Retired. | |
| 1893–1903 [data missing] | |||||
W. Godfrey Hunter (Burkesville) |
Republican | March 4, 1895 – March 3, 1897 |
54th | Elected in 1894. Lost re-election. | |
| John S. Rhea (Russellville) |
Democratic | March 4, 1897 – March 25, 1902 |
55th 56th 57th |
Elected in 1896. Re-elected in 1898. Re-elected in 1900. Lost contested election. | |
 J. McKenzie Moss (Bowling Green) |
Republican | March 25, 1902 – March 3, 1903 |
57th | Won contested election. Lost re-election. | |
| John S. Rhea (Russellville) |
Democratic | March 4, 1903 – March 3, 1905 |
58th | Elected in 1902. Retired. |
1903–1913 [data missing] |
 James M. Richardson (Glasgow) |
Democratic | March 4, 1905 – March 3, 1907 |
59th | Elected in 1904. Lost re-election. | |
.jpg.webp) Addison James (Penrod) |
Republican | March 4, 1907 – March 3, 1909 |
60th | Elected in 1906. Lost re-election. | |
 Robert Y. Thomas Jr. (Central City) |
Democratic | March 4, 1909 – September 3, 1925 |
61st 62nd 63rd 64th 65th 66th 67th 68th 69th |
Elected in 1908. Re-elected in 1910. Re-elected in 1912. Re-elected in 1914. Re-elected in 1916. Re-elected in 1918. Re-elected in 1920. Re-elected in 1922. Re-elected in 1924. Died. | |
| 1913–1933 [data missing] | |||||
| Vacant | September 3, 1925 – December 26, 1925 |
69th | |||
| John W. Moore (Morgantown) |
Democratic | December 26, 1925 – March 3, 1929 |
69th 70th |
Elected to finish Thomas's term. Re-elected in 1926. Lost re-election. | |
.jpg.webp) Charles W. Roark (Greenville) |
Republican | March 4, 1929 – April 5, 1929 |
71st | Elected in 1928. Died. | |
| Vacant | April 5, 1929 – June 1, 1929 | ||||
| John W. Moore (Morgantown) |
Democratic | June 1, 1929 – March 3, 1933 |
71st 72nd |
Elected to finish Roark's term. Re-elected in 1930. Retired. | |
| District inactive | March 4, 1933 – January 3, 1935 |
73rd | See Kentucky's at-large congressional district. | ||
.jpg.webp) Emmet O'Neal (Louisville) |
Democratic | January 3, 1935 – January 3, 1947 |
74th 75th 76th 77th 78th 79th |
Elected in 1934. Re-elected in 1936. Re-elected in 1938. Re-elected in 1940. Re-elected in 1942. Re-elected in 1944. Lost re-election. |
1935–1943.jpg.webp) |
1943–1953.jpg.webp) | |||||
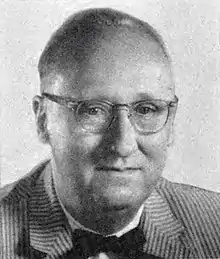
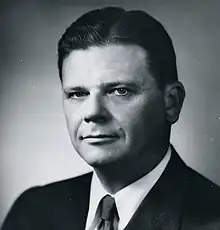 Thruston B. Morton (Glenview) |
Republican | January 3, 1947 – January 3, 1953 |
80th 81st 82nd |
Elected in 1946. Re-elected in 1948. Re-elected in 1950. Retired. | |
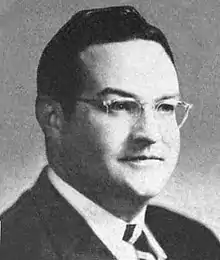
.jpg.webp) John M. Robsion Jr. (Louisville) |
Republican | January 3, 1953 – January 3, 1959 |
83rd 84th 85th |
Elected in 1952. Re-elected in 1954. Re-elected in 1956. Lost re-election. |
1953–1963.jpg.webp) |
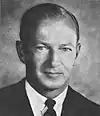
 Frank W. Burke (Louisville) |
Democratic | January 3, 1959 – January 3, 1963 |
86th 87th |
Elected in 1958. Re-elected in 1960. Lost re-election. | |
 Gene Snyder (Jeffersontown) |
Republican | January 3, 1963 – January 3, 1965 |
88th | Elected in 1962. Lost re-election. |
1963–1973.jpg.webp) |
 Charles R. Farnsley (Louisville) |
Democratic | January 3, 1965 – January 3, 1967 |
89th | Elected in 1964. Retired. | |
 William O. Cowger (Louisville) |
Republican | January 3, 1967 – January 3, 1971 |
90th 91st |
Elected in 1966. Re-elected in 1968. Lost re-election. | |
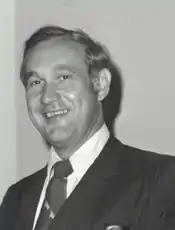
 Romano Mazzoli (Louisville) |
Democratic | January 3, 1971 – January 3, 1995 |
92nd 93rd 94th 95th 96th 97th 98th 99th 100th 101st 102nd 103rd |
Elected in 1970. Re-elected in 1972. Re-elected in 1974. Re-elected in 1976. Re-elected in 1978. Re-elected in 1980. Re-elected in 1982. Re-elected in 1984. Re-elected in 1986. Re-elected in 1988. Re-elected in 1990. Re-elected in 1992. Retired. | |
1973–1983.jpg.webp) | |||||
1983–1993.jpg.webp) | |||||
1993–2003.jpg.webp) | |||||
 Mike Ward (Louisville) |
Democratic | January 3, 1995 – January 3, 1997 |
104th | Elected in 1994. Lost re-election. | |
 Anne Northup (Louisville) |
Republican | January 3, 1997 – January 3, 2007 |
105th 106th 107th 108th 109th |
Elected in 1996. Re-elected in 1998. Re-elected in 2000. Re-elected in 2002. Re-elected in 2004. Lost re-election. | |
2003–2013.jpg.webp) | |||||
 John Yarmuth (Louisville) |
Democratic | January 3, 2007 – January 3, 2023 |
110th 111th 112th 113th 114th 115th 116th 117th |
Elected in 2006. Re-elected in 2008. Re-elected in 2010. Re-elected in 2012. Re-elected in 2014. Re-elected in 2016. Re-elected in 2018. Re-elected in 2020. Retired. | |
2013–2023.jpg.webp) | |||||
.jpg.webp) Morgan McGarvey (Louisville) |
Democratic | January 3, 2023 – present |
118th | Elected in 2022. | 2023–present.svg.png.webp) |
Election results
1932
| Party | Candidate | Votes | % | |
|---|---|---|---|---|
| Democratic | Fred M. Vinson (incumbent) | 575,191 | ||
| Democratic | John Y. Brown Sr. | 574,270 | ||
| Democratic | Andrew J. May (incumbent) | 574,189 | ||
| Democratic | Brent Spence (incumbent) | 574,079 | ||
| Democratic | Virgil Chapman (incumbent) | 573,750 | ||
| Democratic | Glover H. Cary (incumbent) | 573,505 | ||
| Democratic | William Voris Gregory (incumbent) | 573,269 | ||
| Democratic | Cap R. Carden (incumbent) | 573,257 | ||
| Democratic | Finley Hamilton | 573,024 | ||
| Republican | Hillard H. Smith | 391,868 | ||
| Republican | Robert E. Lee Blackburn | 391,674 | ||
| Republican | William Lewis | 390,982 | ||
| Republican | George P. Ellison | 390,739 | ||
| Republican | D.E. McClure | 390,474 | ||
| Republican | J.C. Speight | 390,370 | ||
| Republican | Hugh H. Asher | 390,148 | ||
| Republican | B.T. Rountree | 390,041 | ||
| Republican | Frank B. Russell | 389,950 | ||
| Socialist | John T. Scopes[7] | 3,273 | ||
| Socialist | J.J. Thobe | 3,264 | ||
| Socialist | C.E. Trimble | 3,260 | ||
| Socialist | W.G. Haag | 3,259 | ||
| Socialist | E. L. Nance | 3,256 | ||
| Socialist | E.C. Schulz | 3,256 | ||
| Socialist | J.M. Woodward | 3,255 | ||
| Socialist | H.L. Harwood | 3,254 | ||
| Socialist | D.S. Bennett | 3,252 | ||
| Communist | Frank Reynolds | 241 | ||
| Communist | George N. Conway | 236 | ||
| Total votes | ||||
| Turnout | {{{votes}}} | |||
| Democratic hold | ||||
1934
| Party | Candidate | Votes | % | |
|---|---|---|---|---|
| Democratic | Emmet O'Neal | 48,664 | 56.20 | |
| Republican | Frank M. Drake | 36,922 | 42.64 | |
| Independent | Peter J. Gnau | 414 | 0.48 | |
| Socialist | Clell G. Fowler | 395 | 0.46 | |
| Socialist Labor | William H. Brann | 165 | 0.19 | |
| Communist | J. Stuart McIntyre | 38 | 0.04 | |
| Total votes | 86,598 | 100.00 | ||
| Turnout | {{{votes}}} | |||
| Democratic hold | ||||
1936
| Party | Candidate | Votes | % | |
|---|---|---|---|---|
| Democratic | Emmet O'Neal (incumbent) | 85,034 | 60.30 | |
| Republican | W. A. Armstrong | 52,600 | 37.30 | |
| Union | Jerry V. Spencer | 3,206 | 2.27 | |
| Socialist | Sara Kasdan | 170 | 0.12 | |
| Total votes | 93,588 | 100.00 | ||
| Turnout | {{{votes}}} | |||
| Democratic hold | ||||
1938
| Party | Candidate | Votes | % | |
|---|---|---|---|---|
| Democratic | Emmet O'Neal (incumbent) | 57,227 | 61.15 | |
| Republican | Frank A. Ropke | 36,361 | 38.85 | |
| Total votes | 93,588 | 100.00 | ||
| Turnout | {{{votes}}} | |||
| Democratic hold | ||||
1940
| Party | Candidate | Votes | % | |
|---|---|---|---|---|
| Democratic | Emmet O'Neal (incumbent) | 96,253 | 60.00 | |
| Republican | Ben. J. Brumleve | 64,053 | 40.00 | |
| Total votes | 160,306 | 100.00 | ||
| Turnout | {{{votes}}} | |||
| Democratic hold | ||||
1942
| Party | Candidate | Votes | % | |
|---|---|---|---|---|
| Democratic | Emmet O'Neal (incumbent) | 39,866 | 55.16 | |
| Republican | Joett Ross Todd | 32,404 | 44.84 | |
| Total votes | 72,270 | 100.00 | ||
| Turnout | {{{votes}}} | |||
| Democratic hold | ||||
1944
| Party | Candidate | Votes | % | |||
|---|---|---|---|---|---|---|
| Republican | Garland R. Hubbard | 79,922 | 62.00 | |||
| Prohibition | Bessie Graham | 308 | 0.24 | |||
| Democratic | Frank L. Chelf | 48,671 | 37.76 | |||
| Total votes | 128,901 | 100.00 | ||||
| Turnout | {{{votes}}} | |||||
| Republican gain from Democratic | ||||||
1946
| Party | Candidate | Votes | % | |
|---|---|---|---|---|
| Republican | Thurston Ballard Morton | 61,899 | 58.12 | |
| Democratic | Emmet O'Neil | 44,599 | 41.88 | |
| Total votes | 106,498 | 100.00 | ||
| Turnout | {{{votes}}} | |||
| Republican hold | ||||
1948
| Party | Candidate | Votes | % | |
|---|---|---|---|---|
| Republican | Thruston Ballard Morton (incumbent) | 74,168 | 52.96 | |
| Democratic | Ralph H. Logan | 64,877 | 46.33 | |
| Progressive | Alfred M. Carroll | 686 | 0.49 | |
| Prohibition | Robert Jack Garrison | 315 | 0.22 | |
| Total votes | 140,046 | 100.00 | ||
| Turnout | {{{votes}}} | |||
| Republican hold | ||||
1950
| Party | Candidate | Votes | % | |
|---|---|---|---|---|
| Republican | Thruston Ballard Morton (incumbent) | 62,363 | 55.53 | |
| Democratic | Alex P. Humphrey | 49,935 | 44.47 | |
| Total votes | 112,298 | 100.00 | ||
| Turnout | {{{votes}}} | |||
| Republican hold | ||||
1952
| Party | Candidate | Votes | % | |
|---|---|---|---|---|
| Republican | John M Robsion, Jr | 95,041 | 54.01 | |
| Democratic | Boman L. Shamburger | 80,347 | 45.66 | |
| Independent | H. A. I. Rosenberg | 573 | 0.33 | |
| Total votes | 175,961 | 100.00 | ||
| Turnout | {{{votes}}} | |||
| Republican hold | ||||
1954
| Party | Candidate | Votes | % | |
|---|---|---|---|---|
| Republican | John M Robsion, Jr (incumbent) | 72,073 | 50.20 | |
| Democratic | Harrison M Robertson | 71,500 | 49.80 | |
| Total votes | 143,573 | 100.00 | ||
| Turnout | {{{votes}}} | |||
| Republican hold | ||||
1956
| Party | Candidate | Votes | % | |
|---|---|---|---|---|
| Democratic | Phillip Ardery | 84,912 | 43.21 | |
| Republican | John M Robsion, Jr (incumbent) | 111,598 | 56.79 | |
| Total votes | 196,510 | 100.00 | ||
| Turnout | {{{votes}}} | |||
| Republican hold | ||||
1958
| Party | Candidate | Votes | % | |||
|---|---|---|---|---|---|---|
| Democratic | Frank W Burke | 73,121 | 52.16 | |||
| Republican | John M Robsion (incumbent) | 67,059 | 47.84 | |||
| Total votes | 140,180 | 100.00 | ||||
| Turnout | {{{votes}}} | |||||
| Democratic gain from Republican | ||||||
1960
| Party | Candidate | Votes | % | |
|---|---|---|---|---|
| Democratic | Frank W. Burke (incumbent) | 115,421 | 50.25 | |
| Republican | Henry R. Heyburn | 114,263 | 49.75 | |
| Total votes | 229,684 | 100.00 | ||
| Turnout | {{{votes}}} | |||
| Democratic hold | ||||
1962
| Party | Candidate | Votes | % | |||
|---|---|---|---|---|---|---|
| Democratic | Frank W. Burke (incumbent) | 91,544 | 49.18 | |||
| Republican | M. G. "Gene" Snyder | 94,579 | 50.82 | |||
| Total votes | 229,684 | 100.00 | ||||
| Turnout | {{{votes}}} | |||||
| Republican gain from Democratic | ||||||
1964
| Party | Candidate | Votes | % | |||
|---|---|---|---|---|---|---|
| Democratic | Charles P. Farnsley | 117,892 | 53.82 | |||
| Republican | M.G. "Gene" Snyder (incumbent) | 101,168 | 46.18 | |||
| Total votes | 219,060 | 100.00 | ||||
| Turnout | {{{votes}}} | |||||
| Democratic gain from Republican | ||||||
1966
| Party | Candidate | Votes | % | |||
|---|---|---|---|---|---|---|
| Democratic | Norbert Blume | 46,240 | 40.99 | |||
| Republican | William O. Cowger | 66,577 | 59.01 | |||
| Total votes | 112,817 | 100.00 | ||||
| Turnout | {{{votes}}} | |||||
| Republican gain from Democratic | ||||||
1968
| Party | Candidate | Votes | % | |
|---|---|---|---|---|
| Republican | William O. Cowger (incumbent) | 70,318 | 55.95 | |
| Democratic | Tom Ray | 55,366 | 44.05 | |
| Total votes | 125,684 | 100.00 | ||
| Turnout | {{{votes}}} | |||
| Republican hold | ||||
1970
| Party | Candidate | Votes | % | |||
|---|---|---|---|---|---|---|
| Republican | William O. Cowger (incumbent) | 49,891 | 48.32 | |||
| Democratic | Romano L. Mazzoli | 50,102 | 48.52 | |||
| American | Ronald W. Watson | 3,265 | 3.16 | |||
| Total votes | 103,258 | 100.00 | ||||
| Turnout | {{{votes}}} | |||||
| Democratic gain from Republican | ||||||
1972
| Party | Candidate | Votes | % | |
|---|---|---|---|---|
| Democratic | Romano L. Mazzoli (incumbent) | 86,810 | 62.15 | |
| Republican | Phil Kaelin, Jr | 51,634 | 36.97 | |
| American | William P. Chambers | 1,227 | 0.88 | |
| Total votes | 139,671 | 100.00 | ||
| Turnout | {{{votes}}} | |||
| Democratic hold | ||||
1974
| Party | Candidate | Votes | % | |
|---|---|---|---|---|
| Republican | Vincent N. Barclay | 28,813 | 26.56 | |
| Democratic | Romano L. Mazzoli (incumbent) | 37,346 | 69.67 | |
| American | William P. Chambers | 3,383 | 3.12 | |
| Independent | Luther J. Wilson | 708 | 0.65 | |
| Total votes | 108,475 | 100.00 | ||
| Turnout | {{{votes}}} | |||
| Democratic hold | ||||
1976
| Party | Candidate | Votes | % | |
|---|---|---|---|---|
| Republican | Denzil J. Ramsey | 58,019 | 41.22 | |
| Democratic | Romano L. Mazzoli (incumbent) | 80,496 | 57.19 | |
| American | William P. Chambers | 2,229 | 1.58 | |
| Total votes | 140,744 | 100.00 | ||
| Turnout | {{{votes}}} | |||
| Democratic hold | ||||
1978
| Party | Candidate | Votes | % | |
|---|---|---|---|---|
| Democratic | Romano L. Mazzoli (incumbent) | 37,346 | 65.67 | |
| Republican | Norbert D. Leveronne | 17,785 | 31.27 | |
| Independent | Tom Beckham | 1,312 | 2.31 | |
| Socialist Workers | John Cumbler | 428 | 0.75 | |
| Total votes | 56,871 | 100.00 | ||
| Turnout | {{{votes}}} | |||
| Democratic hold | ||||
1980
| Party | Candidate | Votes | % | |
|---|---|---|---|---|
| Democratic | Romano L. Mazzoli (incumbent) | 85,873 | 63.74 | |
| Republican | Richard Cesler | 46,681 | 34.65 | |
| American | Robert D. Vessels | 468 | 0.35 | |
| Citizens | John Cumbler | 1,272 | 0.94 | |
| Libertarian | Henry G. Logsdon | 430 | 0.32 | |
| Total votes | 134,724 | 100.00 | ||
| Turnout | {{{votes}}} | |||
| Democratic hold | ||||
1982
| Party | Candidate | Votes | % | |
|---|---|---|---|---|
| Republican | Carl Brown | 45,900 | 32.19 | |
| Democratic | Romano L. Mazzoli (incumbent) | 92,849 | 65.11 | |
| Independent | Norbert D. Leveronne | 2,840 | 1.99 | |
| Libertarian | Dan Murray | 608 | 0.43 | |
| Socialist Workers | Craig Honts | 400 | 0.28 | |
| Total votes | 142,597 | 100.00 | ||
| Turnout | {{{votes}}} | |||
| Democratic hold | ||||
1984
| Party | Candidate | Votes | % | |
|---|---|---|---|---|
| Republican | Suzanne M. Warner | 68,185 | 31.67 | |
| Democratic | Romano L. Mazzoli (incumbent) | 145,680 | 67.67 | |
| Independent | Peggy Kreiner | 1,273 | 0.59 | |
| Write-In | 139 | 0.06 | ||
| Total votes | 215,277 | 100.00 | ||
| Turnout | {{{votes}}} | |||
| Democratic hold | ||||
1986
| Party | Candidate | Votes | % | |
|---|---|---|---|---|
| Republican | Lee Holmes | 29,348 | 26.15 | |
| Democratic | Romano L. Mazzoli (incumbent) | 81,943 | 73.01 | |
| Socialist Workers | Estelle Debates | 899 | 0.80 | |
| Write-In | 43 | 0.04 | ||
| Total votes | 112,233 | 100.00 | ||
| Turnout | {{{votes}}} | |||
| Democratic hold | ||||
1988
| Party | Candidate | Votes | % | |
|---|---|---|---|---|
| Republican | Philip Dunnagan | 57,387 | 30.30 | |
| Democratic | Romano L. Mazzoli (incumbent) | 131,981 | 69.70 | |
| Total votes | 189,368 | 100.00 | ||
| Turnout | {{{votes}}} | |||
| Democratic hold | ||||
1990
| Party | Candidate | Votes | % | |
|---|---|---|---|---|
| Republican | Al Brown | 55,188 | 39.44 | |
| Democratic | Romano L. Mazzoli | 84,750 | 60.56 | |
| Total votes | 139,938 | 100.00 | ||
| Turnout | {{{votes}}} | |||
| Democratic hold | ||||
1992
| Party | Candidate | Votes | % | |
|---|---|---|---|---|
| Democratic | Romano L. Mazzoli (incumbent) | 148,066 | 52.74 | |
| Republican | Susan B. Stokes | 132,689 | 47.26 | |
| Write-In | Patricia Metten | 15 | 0.005 | |
| Total votes | 280,770 | 100.00 | ||
| Turnout | {{{votes}}} | |||
| Democratic hold | ||||
1994
| Party | Candidate | Votes | % | |
|---|---|---|---|---|
| Democratic | Mike Ward | 67,663 | 44.36 | |
| Republican | Susan B. Stokes | 67,238 | 44.08 | |
| U.S. Taxpayers' Party (United States) | Richard Lewis | 17,591 | 11.53 | |
| Write-In | Valerie Cohen | 31 | 0.02 | |
| Total votes | 152,523 | 100.00 | ||
| Turnout | {{{votes}}} | |||
| Democratic hold | ||||
1996
| Party | Candidate | Votes | % | |||
|---|---|---|---|---|---|---|
| Republican | Anne Northup | 126,625 | 50.26 | |||
| Democratic | Mike Ward (Incumbent) | 125,326 | 49.74 | |||
| Total votes | 251,951 | 100.00 | ||||
| Turnout | {{{votes}}} | |||||
| Republican gain from Democratic | ||||||
1998
| Party | Candidate | Votes | % | |
|---|---|---|---|---|
| Republican | Anne Northup (Incumbent) | 100,690 | 52.02 | |
| Democratic | Chris Gorman | 92,865 | 47.98 | |
| Total votes | 193,555 | 100.00 | ||
| Turnout | {{{votes}}} | |||
| Republican hold | ||||
2000
| Party | Candidate | Votes | % | |
|---|---|---|---|---|
| Republican | Anne Northup (Incumbent) | 142,106 | 52.87 | |
| Democratic | Eleanor Jordon | 118,875 | 44.23 | |
| Libertarian | Donna Walker Mancini | 7,804 | 2.90 | |
| Total votes | 268,785 | 100.00 | ||
| Turnout | {{{votes}}} | 67.9 | ||
| Republican hold | ||||
2002
| Party | Candidate | Votes | % | |
|---|---|---|---|---|
| Republican | Anne Northup (Incumbent) | 118,228 | 51.61 | |
| Democratic | Jack Conway | 110,846 | 48.39 | |
| Total votes | 229,074 | 100.00 | ||
| Turnout | {{{votes}}} | |||
| Republican hold | ||||
2004
| Party | Candidate | Votes | % | |
|---|---|---|---|---|
| Republican | Anne Northup (Incumbent) | 197,736 | 60.26 | |
| Democratic | Tony Miller | 124,040 | 37.80 | |
| Libertarian | George C. Dick | 6,363 | 1.94 | |
| Total votes | 328,139 | 100.00 | ||
| Turnout | {{{votes}}} | |||
| Republican hold | ||||
2006
| Party | Candidate | Votes | % | |||
|---|---|---|---|---|---|---|
| Democratic | John Yarmuth | 122,471 | 50.62 | |||
| Republican | Anne Northup (Incumbent) | 116,555 | 48.18 | |||
| Libertarian | Donna Walker Mancini | 2,134 | 0.88 | |||
| Constitution | W. Ed Parker | 774 | 0.32 | |||
| Total votes | 241,934 | 100.00 | ||||
| Turnout | {{{votes}}} | |||||
| Democratic gain from Republican | ||||||
2008
| Party | Candidate | Votes | % | |
|---|---|---|---|---|
| Democratic | John Yarmuth (Incumbent) | 203,843 | 59.37 | |
| Republican | Anne Northup | 139,527 | 40.64 | |
| Libertarian | Ed Martin | Republican sued; votes not counted | 0.00 | |
| Total votes | 343,370 | 100.00 | ||
| Turnout | {{{votes}}} | |||
| Democratic hold | ||||
2010
| Party | Candidate | Votes | % | |
|---|---|---|---|---|
| Democratic | John Yarmuth (Incumbent) | 139,940 | 54.68 | |
| Republican | Todd Lally | 112,627 | 44.01 | |
| Libertarian | Ed Martin | 2,029 | 0.79 | |
| Independent | Michael Hansen | 1,334 | 0.52 | |
| Total votes | 255,930 | 100.00 | ||
| Turnout | {{{votes}}} | |||
| Democratic hold | ||||
2012
| Party | Candidate | Votes | % | |
|---|---|---|---|---|
| Democratic | John Yarmuth (Incumbent) | 206,385 | 63.96 | |
| Republican | Brooks Wicker | 111,452 | 34.54 | |
| Independent | Robert L. DeVore, Jr. | 4.819 | 1.49 | |
| Total votes | 322,656 | 100.0 | ||
| Turnout | {{{votes}}} | |||
| Democratic hold | ||||
2014
| Party | Candidate | Votes | % | |
|---|---|---|---|---|
| Democratic | John Yarmuth (Incumbent) | 157,056 | 63.5 | |
| Republican | Michael MacFarlane | 87,981 | 35.6 | |
| Independent | Gregory Peter Puccetti | 2,318 | 0.9 | |
| Total votes | 247,355 | 100 | ||
| Democratic hold | ||||
2016
| Party | Candidate | Votes | % | |
|---|---|---|---|---|
| Democratic | John Yarmuth (Incumbent) | 212,401 | 63.5 | |
| Republican | Harold Bratcher | 122,093 | 36.5 | |
| Total votes | 334,494 | 100.00 | ||
| Democratic hold | ||||
2018
| Party | Candidate | Votes | % | |
|---|---|---|---|---|
| Democratic | John Yarmuth (Incumbent) | 173,002 | 62.1 | |
| Republican | Vickie Yates Glisson | 101,930 | 36.6 | |
| Libertarian | Gregory Boles | 3,788 | 1.4 | |
| Total votes | 278,720 | 100.00 | ||
| Democratic hold | ||||
2020
| Party | Candidate | Votes | % | |
|---|---|---|---|---|
| Democratic | John Yarmuth (Incumbent) | 230,672 | 62.7 | |
| Republican | Rhonda Palazzo | 137,425 | 37.3 | |
| Total votes | 368,097 | 100.00 | ||
| Democratic hold | ||||
2022
| Party | Candidate | Votes | % | |
|---|---|---|---|---|
| Democratic | Morgan McGarvey | 160,920 | 61.9 | |
| Republican | Stuart Ray | 98,637 | 38.0 | |
| Daniel Cobble (write-in) | 30 | 0.01% | ||
| Total votes | 259,587 | 100.00 | ||
| Democratic hold | ||||
Historical district maps
| Year | District 3 | All Districts |
|---|---|---|
| 1935–1943 | |
.jpg.webp) |
| 1943–1953 | |
.jpg.webp) |
| 1953–1943 | |
.jpg.webp) |
| 1963–1973 | |
.jpg.webp) |
| 1973–1983 | |
.jpg.webp) |
| 1983–1993 | |
.jpg.webp) |
| 1993–2003 | |
.jpg.webp) |
| 2003–2013 | |
.jpg.webp) |
| 2013–2023 | |
.jpg.webp) |
See also
- Kentucky's congressional districts
- List of United States congressional districts
References
- Specific
- "Congressional Districts Relationship Files (state-based". www.census.gov. US Census Bureau Geography. Archived from the original on July 17, 2017. Retrieved February 11, 2018.
- "My Congressional District". www.census.gov. Center for New Media & Promotion (CNMP), US Census Bureau.
- "My Congressional District Bureau". www.census.gov. Center for New Media & Promotion (CNMP), US Census Bureau.
- "2022 Cook PVI: District Map and List". Cook Political Report. July 12, 2022. Retrieved January 10, 2023.
- "Kentucky Administrative Regulations 31KAR4:150". Kentucky Legislative Research Commission. November 2005. Archived from the original on September 11, 2016. Retrieved February 6, 2014.
- "Register To Vote". Kentucky State Board of Elections. August 2003. Retrieved February 6, 2014.
- "August 12, 1932 (Page 1 of 24)." The Courier-Journal (1923-2001), Aug 12, 1932, pp. 1.
- https://web.archive.org/web/*/https://history.house.gov/Institution/Election-Statistics/.
{{cite web}}: Missing or empty|title=(help) - "General Elections Results" (PDF). Kentucky Secretary of State. November 4, 2014. Retrieved December 19, 2014.
- General
- Martis, Kenneth C. (1989). The Historical Atlas of Political Parties in the United States Congress. New York: Macmillan Publishing Company.
- Martis, Kenneth C. (1982). The Historical Atlas of United States Congressional Districts. New York: Macmillan Publishing Company.
- Congressional Biographical Directory of the United States 1774–present