Kentucky's 4th congressional district
Kentucky's 4th congressional district is a congressional district in the U.S. state of Kentucky. Located in the northeastern portion of the state, it is a long district that follows the Ohio River. However, the district is dominated by its far western portion, comprising the eastern suburbs of Louisville and Northern Kentucky, the Kentucky side of the Cincinnati area.
| Kentucky's 4th congressional district | |||
|---|---|---|---|
Interactive map of district boundaries since January 3, 2023 | |||
| Representative |
| ||
| Distribution |
| ||
| Population (2022) | 762,092[2] | ||
| Median household income | $75,907[2] | ||
| Ethnicity |
| ||
| Cook PVI | R+19[3] | ||
The majority of voters live in the booming suburban Cincinnati counties of Boone, Kenton, and Campbell, which includes such suburbs as Fort Mitchell, Covington, Florence, Newport, and Fort Thomas. The next-largest population center is the northeastern suburbs of Louisville. It stretches as far south as northern portions of the city of Bardstown.
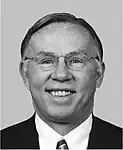
The district is currently represented by Republican Thomas Massie, who was elected in a special election in 2012 to succeed Republican Geoff Davis, who resigned on July 31, 2012, citing family concerns.
Characteristics
The 4th was one of the first areas of Kentucky to turn Republican outside of traditionally Republican south-central Kentucky; it has been in GOP hands for all but six years since 1967. Its politics are dominated by Republicans in the wealthy Cincinnati suburbs, which have swelled with former Cincinnati residents since the early 1960s. Between them, Boone, Kenton and Campbell counties have as many people as the rest of the district combined. As a measure of how much the Cincinnati suburbs have dominated the district, when Massie took office, he became the first congressman from the district's eastern portion in 45 years. Nonetheless, Democrats still hold state and local offices in rural counties.
| Voter registration and party enrollment as of October 2023[4] | |||||
|---|---|---|---|---|---|
| Party | Number of voters | Percentage | |||
| Republican | 307,967 | 50.38% | |||
| Democratic | 225,095 | 36.82% | |||
| Other | 46,963 | 7.68% | |||
| Independent | 31,255 | 5.11% | |||
| Total | 611,280 | 100% | |||
Until January 1, 2006, Kentucky did not track party affiliation for registered voters who were neither Democratic nor Republican.[5] The Kentucky voter registration card does not explicitly list anything other than Democratic Party, Republican Party, or Other, with the "Other" option having a blank line and no instructions on how to register as something else.[6]
Recent statewide elections
| Election results from statewide races | ||
|---|---|---|
| Year | Office | Results |
| 2000 | President | Bush 61–37% |
| 2004 | President | Bush 63–36% |
| 2008 | President | McCain 60–38% |
| 2012 | President | Romney 63–35% |
| 2016 | President | Trump 65–33% |
| Senate | Paul 66–34% | |
| 2019 | Governor | Bevin 53–45% |
| Attorney General | Cameron 63–37% | |
| 2020 | President | Trump 65–33% |
| Senate | McConnell 61–35% | |
| 2022 | Senate | Paul 66–34% |
| 2023 | Governor | Cameron 52–48% |
List of members representing the district
| Member | Party | Years | Cong ress |
Electoral history | Location |
|---|---|---|---|---|---|
| District created March 4, 1803 | |||||
| Thomas Sandford | Democratic-Republican | March 4, 1803 – March 3, 1807 |
8th 9th |
Elected in 1803. Re-elected in 1804. Lost re-election. |
1803–1813 Boone, Bracken, Campbell, Franklin, Gallatin, Harrison, Henry, Pendleton, Scott, and Shelby counties |
 Richard M. Johnson (Great Crossings) |
Democratic-Republican | March 4, 1807 – March 3, 1813 |
10th 11th 12th |
Elected in 1806. Re-elected in 1808. Re-elected in 1810. Redistricted to the 3rd district. | |
 Joseph Desha (Mays Lick) |
Democratic-Republican | March 4, 1813 – March 3, 1819 |
13th 14th 15th |
Redistricted from the 6th district and re-elected in 1812. Re-elected in 1814. Re-elected in 1816. Retired. |
1813–1823 Bourbon, Bracken, Lewis, Mason, and Nicholas counties |
 Thomas Metcalfe (Carlisle) |
Democratic-Republican | March 4, 1819 – March 3, 1823 |
16th 17th |
Elected in 1818. Re-elected in 1820. Redistricted to the 2nd district. | |
 Robert P. Letcher (Lancaster) |
Adams-Clay Democratic-Republican |
March 3, 1823 – March 3, 1825 |
18th 19th 20th 21st 22nd |
Elected in 1822. Re-elected in 1824. Re-elected in 1827. Re-elected in 1829. Re-elected in 1831. Redistricted to the 5th district. |
1823–1833 Clay, Estill, Garrard, Harlan, Knox, Madison, Perry, Rockcastle, and Whitley counties |
| Anti-Jacksonian | March 3, 1825 – March 3, 1833 | ||||
| Martin Beaty (South Fork) |
Anti-Jacksonian | March 4, 1833 – March 3, 1835 |
23rd | Elected in 1833. Lost re-election. |
1833–1843 [data missing] |
| Sherrod Williams (Monticello) |
Anti-Jacksonian | March 4, 1835 – March 3, 1837 |
24th 25th 26th |
Elected in 1835. Re-elected in 1837. Re-elected in 1839. Retired. | |
| Whig | March 4, 1837 – March 3, 1841 | ||||
| Bryan Owsley (Jamestown) |
Whig | March 4, 1841 – March 3, 1843 |
27th | Elected in 1841. Lost re-election. | |
| George Caldwell (Columbia) |
Democratic | March 4, 1843 – March 3, 1845 |
28th | Elected in 1843. Retired. |
1843–1853 [data missing] |
 Joshua F. Bell (Danville) |
Whig | March 4, 1845 – March 3, 1847 |
29th | Elected in 1845. Retired. | |
| Aylette Buckner (Greensburg) |
Whig | March 4, 1847 – March 3, 1849 |
30th | Elected in 1847. Lost re-election. | |
| George Caldwell (Columbia) |
Democratic | March 4, 1849 – March 3, 1851 |
31st | Elected in 1849. Retired. | |
 William T. Ward (Greensburg) |
Whig | March 4, 1851 – March 3, 1853 |
32nd | Elected in 1851. Retired. | |
| James Chrisman (Monticello) |
Democratic | March 4, 1853 – March 3, 1855 |
33rd | Elected in 1853. Retired. |
1853–1863 [data missing] |
 Albert G. Talbott (Danville) |
Democratic | March 4, 1855 – March 3, 1859 |
34th 35th |
Elected in 1855. Re-elected in 1857. Retired. | |
| William C. Anderson (Danville) |
Opposition | March 4, 1859 – March 3, 1861 |
36th | Elected in 1859. Retired to run for state representative. | |
 Aaron Harding (Greensburg) |
Unionist | March 4, 1861 – March 3, 1865 |
37th 38th 39th |
Elected in 1861. Re-elected in 1863. Re-elected in 1865. Retired. | |
| 1863–1873 [data missing] | |||||
| Democratic | March 4, 1865 – March 3, 1867 | ||||
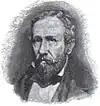
 J. Proctor Knott (Lebanon) |
Democratic | March 4, 1867 – March 3, 1871 |
40th 41st |
Elected in 1867. Re-elected in 1868. Retired. | |
 William B. Read (Hodgensville) |
Democratic | March 4, 1871 – March 3, 1875 |
42nd 43rd |
Elected in 1870. Re-elected in 1872. Lost renomination. | |
| 1873–1883 [data missing] | |||||
J. Proctor Knott (Lebanon) |
Democratic | March 4, 1875 – March 3, 1883 |
44th 45th 46th 47th |
Elected in 1874. Re-elected in 1876. Re-elected in 1878. Re-elected in 1880. Retired. | |
| Thomas A. Robertson (Elizabethtown) |
Democratic | March 4, 1883 – March 3, 1887 |
48th 49th |
Elected in 1882. Re-elected in 1884. Lost renomination. |
1883–1893 [data missing] |
 Alexander B. Montgomery (Elizabethtown) |
Democratic | March 4, 1887 – March 3, 1895 |
50th 51st 52nd 53rd |
Elected in 1886. Re-elected in 1888. Re-elected in 1890. Re-elected in 1892. Lost re-election. | |
| 1893–1903 [data missing] | |||||
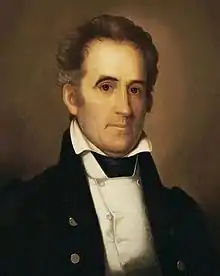
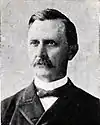
.jpg.webp) John W. Lewis (Springfield) |
Republican | March 4, 1895 – March 3, 1897 |
54th | Elected in 1894. Lost re-election. | |
 David H. Smith (Hodgensville) |
Democratic | March 4, 1897 – March 3, 1907 |
55th 56th 57th 58th 59th |
Elected in 1896. Re-elected in 1898. Re-elected in 1900. Re-elected in 1902. Re-elected in 1904. Retired. | |
| 1903–1913 [data missing] | |||||
 Ben Johnson (Bardstown) |
Democratic | March 4, 1907 – March 3, 1927 |
60th 61st 62nd 63rd 64th 65th 66th 67th 68th 69th |
Elected in 1906. Re-elected in 1908. Re-elected in 1910. Re-elected in 1912. Re-elected in 1914. Re-elected in 1916. Re-elected in 1918. Re-elected in 1920. Re-elected in 1922. Re-elected in 1924. Retired. | |
| 1913 – 1933 [data missing] | |||||
 Henry D. Moorman (Hardinsburg) |
Democratic | March 4, 1927 – March 3, 1929 |
70th | Elected in 1926. Lost re-election. | |
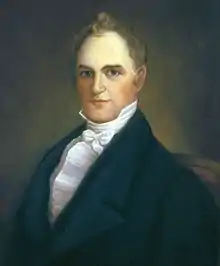
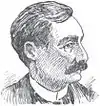
.jpg.webp) John D. Craddock (Munfordville) |
Republican | March 4, 1929 – March 3, 1931 |
71st | Elected in 1928. Lost re-election. | |
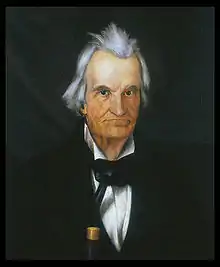
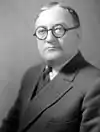
.jpg.webp) Cap R. Carden (Munfordville) |
Democratic | March 4, 1931 – March 3, 1933 |
72nd | Elected in 1930. Redistricted to the at-large district. | |
| District inactive | March 4, 1933 – January 3, 1935 |
73rd | See Kentucky's at-large congressional district. | ||
Cap R. Carden (Munfordville) |
Democratic | March 4, 1935 – June 13, 1935 |
74th | Redistricted from the at-large district and re-elected in 1934. Died. |
1935–1943 [data missing] |
| Vacant | June 13, 1935 – November 5, 1935 | ||||
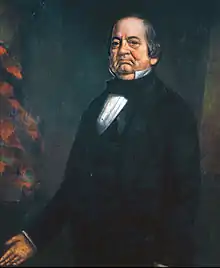
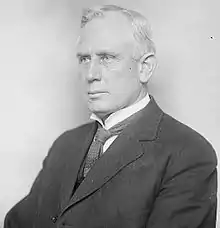
.jpg.webp) Edward W. Creal (Hodgenville) |
Democratic | November 5, 1935 – October 13, 1943 |
74th 75th 76th 77th 78th |
Elected to finish Carden's term. Re-elected in 1936. Re-elected in 1938. Re-elected in 1940. Re-elected in 1942. Died. | |
| 1943–1953 [data missing] | |||||
| Vacant | October 13, 1943 – November 30, 1943 |
78th | |||
| Chester O. Carrier(Leitchfield) | Republican | November 30, 1943 – January 3, 1945 |
Elected to finish Creal's term. Lost re-election. | ||
 Frank Chelf (Lebanon) |
Democratic | January 3, 1945 – January 3, 1967 |
79th 80th 81st 82nd 83rd 84th 85th 86th 87th 88th 89th |
Elected in 1944. Re-elected in 1946. Re-elected in 1948. Re-elected in 1950. Re-elected in 1952. Re-elected in 1954. Re-elected in 1956. Re-elected in 1958. Re-elected in 1960. Re-elected in 1962. Re-elected in 1964. Lost re-election. | |
| 1953–1963 [data missing] | |||||
| 1963–1973 [data missing] | |||||
 Gene Snyder (Brownsboro Farms) |
Republican | January 3, 1967 – January 3, 1987 |
90th 91st 92nd 93rd 94th 95th 96th 97th 98th 99th |
Elected in 1966. Re-elected in 1968. Re-elected in 1970. Re-elected in 1972. Re-elected in 1974. Re-elected in 1976. Re-elected in 1978. Re-elected in 1980. Re-elected in 1982. Re-elected in 1984. Retired. | |
| 1973–1983 [data missing] | |||||
| 1983–1993 [data missing] | |||||
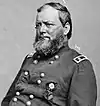
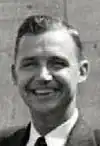
 Jim Bunning (Southgate) |
Republican | January 3, 1987 – January 3, 1999 |
100th 101st 102nd 103rd 104th 105th |
Elected in 1986. Re-elected in 1988. Re-elected in 1990. Re-elected in 1992. Re-elected in 1994. Re-elected in 1996. Retired to run for U.S. Senator. | |
| 1993–2003 [data missing] | |||||
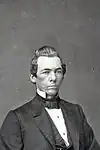
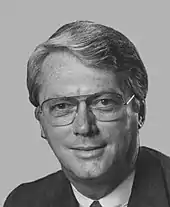
 Ken Lucas (Florence) |
Democratic | January 3, 1999 – January 3, 2005 |
106th 107th 108th |
Elected in 1998. Re-elected in 2000. Re-elected in 2002. Retired. | |
2003–2013 | |||||
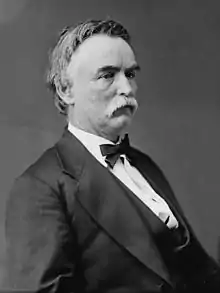
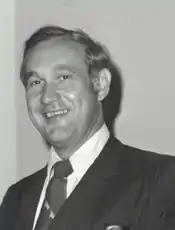
 Geoff Davis (Hebron) |
Republican | January 3, 2005 – July 31, 2012 |
109th 110th 111th 112th |
Elected in 2004. Re-elected in 2006. Re-elected in 2008. Re-elected in 2010. Resigned due to family health issues. | |
| Vacant | July 31, 2012 – November 6, 2012 |
112th | |||
 Thomas Massie (Garrison) |
Republican | November 6, 2012 – present |
112th 113th 114th 115th 116th 117th 118th |
Elected to finish Davis's term. Also elected in 2012 to the next term. Re-elected in 2014. Re-elected in 2016. Re-elected in 2018. Re-elected in 2020. Re-elected in 2022. | |
2013–2023.tif.png.webp) | |||||
2023–present.svg.png.webp) | |||||
Recent election results
2002
| Party | Candidate | Votes | % | |
|---|---|---|---|---|
| Democratic | Ken Lucas* | 87,776 | 51.11 | |
| Republican | Geoff Davis | 81,651 | 47.55 | |
| Libertarian | John Grote | 2,308 | 1.34 | |
| Total votes | 171,735 | 100.00 | ||
| Turnout | {{{votes}}} | |||
| Democratic hold | ||||
2004
| Party | Candidate | Votes | % | |||
|---|---|---|---|---|---|---|
| Republican | Geoff Davis | 160,982 | 54.40 | |||
| Democratic | Nick Clooney | 129,876 | 43.89 | |||
| Independent | Michael Slider | 5,069 | 1.71 | |||
| Total votes | 295,927 | 100.00 | ||||
| Turnout | {{{votes}}} | |||||
| Republican gain from Democratic | ||||||
2006
| Party | Candidate | Votes | % | |
|---|---|---|---|---|
| Republican | Geoff Davis* | 105,845 | 51.69 | |
| Democratic | Ken Lucas | 88,822 | 43.38 | |
| Libertarian | Brian Houillion | 10,100 | 4.93 | |
| Total votes | 204,765 | 100.00 | ||
| Turnout | {{{votes}}} | |||
| Republican hold | ||||
2008
| Party | Candidate | Votes | % | |
|---|---|---|---|---|
| Republican | Geoff Davis* | 190,210 | 63.03 | |
| Democratic | Michael Kelley | 111,549 | 36.97 | |
| Total votes | 301,759 | 100.00 | ||
| Turnout | {{{votes}}} | |||
| Republican hold | ||||
2010
| Party | Candidate | Votes | % | |
|---|---|---|---|---|
| Republican | Geoff Davis* | 151,774 | 69.48 | |
| Democratic | John Waltz | 66,675 | 30.52 | |
| Total votes | 218,449 | 100.00 | ||
| Turnout | {{{votes}}} | |||
| Republican hold | ||||
2012
| Party | Candidate | Votes | % | |
|---|---|---|---|---|
| Republican | Thomas Massie | 186,026 | 62.13 | |
| Democratic | William Adkins | 104,731 | 34.98 | |
| Independent | David Lewis | 8,673 | 2.90 | |
| Total votes | 299,430 | 100.00 | ||
| Turnout | {{{votes}}} | |||
| Republican hold | ||||
2014
| Party | Candidate | Votes | % | |
|---|---|---|---|---|
| Republican | Thomas Massie (Incumbent) | 150,464 | 67.7 | |
| Democratic | Peter Newberry | 71,694 | 32.3 | |
| Total votes | 222,158 | 100 | ||
| Republican hold | ||||
2016
| Party | Candidate | Votes | % | |
|---|---|---|---|---|
| Republican | Thomas Massie (Incumbent) | 233,922 | 71.32 | |
| Democratic | Calvin Sidle | 94,065 | 28.68 | |
| Total votes | 327,987 | 100 | ||
| Republican hold | ||||
2018
| Party | Candidate | Votes | % | |
|---|---|---|---|---|
| Republican | Thomas Massie (Incumbent) | 162,946 | 62.2 | |
| Democratic | Seth Hall | 90,536 | 34.6 | |
| Independent | Mike Moffett | 8,318 | 2.2 | |
| Independent | David Goodwin (write-in) | 12 | 0.0 | |
| Total votes | 261,812 | 100 | ||
| Republican hold | ||||
2020
| Party | Candidate | Votes | % | |
|---|---|---|---|---|
| Republican | Thomas Massie (Incumbent) | 256,613 | 67.1 | |
| Democratic | Alexandra Owensby | 125,896 | 32.9 | |
| Total votes | 382,509 | 100 | ||
| Republican hold | ||||
2022
| Party | Candidate | Votes | % | |
|---|---|---|---|---|
| Republican | Thomas Massie (incumbent) | 167,541 | 65.0 | |
| Democratic | Matthew Lehman | 79,977 | 31.0 | |
| Pirate Party | Ethan Osborne[lower-alpha 1] | 10,111 | 3.9 | |
| Total votes | 257,629 | 100.0 | ||
| Republican hold | ||||
See also
- Kentucky's congressional districts
- List of United States congressional districts
References
- "Congressional Districts Relationship Files (State-based) - Geography - U.S. Census Bureau". Archived from the original on July 17, 2017. Retrieved February 11, 2018.
- Center for New Media & Promotion (CNMP), US Census Bureau. "My Congressional District". www.census.gov.
- "2022 Cook PVI: District Map and List". Cook Political Report. Retrieved January 10, 2023.
- "Registration Statistics". Kentucky State Board of Elections. January 2022.
- "Kentucky Administrative Regulations 31KAR4:150". Kentucky Legislative Research Commission. November 2005. Retrieved February 6, 2014.
- "Register To Vote". Kentucky State Board of Elections. August 2003. Retrieved February 6, 2014.
- Martis, Kenneth C. (1989). The Historical Atlas of Political Parties in the United States Congress. New York: Macmillan Publishing Company.
- Martis, Kenneth C. (1982). The Historical Atlas of United States Congressional Districts. New York: Macmillan Publishing Company.
- Congressional Biographical Directory of the United States 1774–present
- Appeared on the ballot as an independent.