Missouri's 8th congressional district
Missouri's 8th congressional district is one of 435 congressional districts in the United States and one of eight congressional districts in the state of Missouri. The district encompasses rural Southeast Missouri and South Central Missouri as well as some counties in Southwest Missouri. The district stretches from the Bootheel in the south to the St. Louis southern exurbs of Festus, Hillsboro, and surrounding areas in the Lead Belt; it ranges in the east to counties along the Mississippi River and in the west to counties along the Ozark Plateau near Branson. With a Cook Partisan Voting Index rating of R+28, it is the most Republican district in Missouri.[2]
| Missouri's 8th congressional district | |||
|---|---|---|---|
Interactive map of district boundaries since January 3, 2023 | |||
| Representative |
| ||
| Distribution |
| ||
| Population (2022) | 775,424 | ||
| Median household income | $53,903[1] | ||
| Ethnicity |
| ||
| Cook PVI | R+28[2] | ||
Political history
The district's largest city is Cape Girardeau. A predominantly rural district, the district votes strongly Republican for national offices. In 2004, President George W. Bush received 63% of the vote in the district over U.S. Senator John Kerry (D-Massachusetts) who clinched 36%. In 2008, U.S. Senator John McCain (R-Arizona) carried the district with 61.92% over U.S. Senator Barack Obama (D-Illinois), who received 36.42%. The district increased the margin for Republicans in 2012 when former Governor Mitt Romney (R-Massachusetts) gained 65.88% of the vote over President Barack Obama's 31.99%. The district swung towards Republican Donald Trump in the 2016 presidential election. Trump garnered 75.4% of the vote, Democratic Nominee Hillary Clinton received just 21.0% of the vote, making it one of the most strongly Republican congressional districts in the United States.
Jason T. Smith, a Republican, has represented the district in the U.S. Congress since winning a special election on June 4, 2013. The incumbent Republican U.S. Representative Jo Ann Emerson resigned on January 22, 2013 to take a position as CEO for the National Rural Electric Cooperative Association.
Missouri lost one of its nine congressional district seats following redistricting based on population numbers from the 2010 U.S. census. The Republican-controlled state legislature decided to redefine Missouri's 3rd congressional district, which was represented by U.S. Representative Russ Carnahan (D-St. Louis). The district included all of Ste. Genevieve and Jefferson counties and southern St. Louis County and the neighborhoods making up what is known as South City of St. Louis. Missouri's 8th congressional district lost its Taney County parts (which were redistricted to the Southwestern-based 7th congressional district, and picked up all of Crawford and Ste. Genevieve counties, and most of the southern and western rural parts of Jefferson County. Parts of Jefferson County that are now included in Missouri's 8th include all of the cities of Hillsboro and De Soto, and the extreme southern portions of the Twin Cities of Festus and Crystal City (most of these two cities are now part of the 2nd congressional district).
List of members representing the district
| Member | Party | Years | Cong ress |
Electoral history | District location |
|---|---|---|---|---|---|
| District created March 4, 1863 | |||||
 William A. Hall (Huntsville) |
Unionist | March 4, 1863 – March 3, 1865 |
38th | Redistricted from the 3rd district and re-elected in 1862. Retired. |
|
 John F. Benjamin (Shelbyville) |
Republican | March 4, 1865 – March 3, 1871 |
39th 40th 41st |
Elected in 1864. Re-elected in 1866. Re-elected in 1868. Retired. | |
| James G. Blair (Canton) |
Liberal Republican |
March 4, 1871 – March 3, 1873 |
42nd | Elected in 1870. Retired. | |
 Abram Comingo (Independence) |
Democratic | March 4, 1873 – March 3, 1875 |
43rd | Redistricted from the 6th district and re-elected in 1872. Retired. | |
 Benjamin J. Franklin (Kansas City) |
Democratic | March 4, 1875 – March 3, 1879 |
44th 45th |
Elected in 1874. Re-elected in 1876. Withdrew during renomination. | |
 Samuel L. Sawyer (Independence) |
Independent Democratic |
March 4, 1879 – March 3, 1881 |
46th | Elected in 1878. Retired. | |
 Robert T. Van Horn (Kansas City) |
Republican | March 4, 1881 – March 3, 1883 |
47th | Elected in 1880. Lost re-election. | |
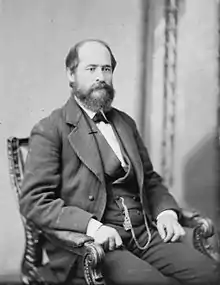
 John J. O'Neill (St. Louis) |
Democratic | March 4, 1883 – March 3, 1889 |
48th 49th 50th |
Elected in 1882. Re-elected in 1884. Re-elected in 1886. Lost re-election. | |
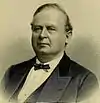
 Frederick G. Niedringhaus (St. Louis) |
Republican | March 4, 1889 – March 3, 1891 |
51st | Elected in 1888. Retired. | |
John J. O'Neill (St. Louis) |
Democratic | March 4, 1891 – March 3, 1893 |
52nd | Elected in 1890. Redistricted to 11th district. | |
 Richard P. Bland (Lebanon) |
Democratic | March 4, 1893 – March 3, 1895 |
53rd | Redistricted from the 11th district and re-elected in 1892. Lost re-election. | |
 Joel D. Hubbard (Versailles) |
Republican | March 4, 1895 – March 3, 1897 |
54th | Elected in 1894. Lost re-election. | |
Richard P. Bland (Lebanon) |
Democratic | March 4, 1897 – June 15, 1899 |
55th 56th |
Elected in 1896. Re-elected in 1898. Died. | |
| Vacant | June 15, 1899 – August 29, 1899 |
56th | |||
 Dorsey W. Shackleford (Jefferson City) |
Democratic | August 29, 1899 – March 3, 1919 |
56th 57th 58th 59th 60th 61st 62nd 63rd 64th 65th |
Elected to finish Bland's term. Re-elected in 1900. Re-elected in 1902. Re-elected in 1904. Re-elected in 1906. Re-elected in 1908. Re-elected in 1910. Re-elected in 1912. Re-elected in 1914. Re-elected in 1916. Lost renomination. | |
 William L. Nelson (Columbia) |
Democratic | March 4, 1919 – March 3, 1921 |
66th | Elected in 1918. Lost re-election. | |
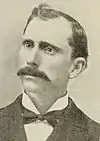
 Sidney C. Roach (Linn Creek) |
Republican | March 4, 1921 – March 3, 1925 |
67th 68th |
Elected in 1920. Re-elected in 1922. Lost re-election. | |
William L. Nelson (Columbia) |
Democratic | March 4, 1925 – March 3, 1933 |
69th 70th 71st 72nd |
Elected in 1924. Re-elected in 1926. Re-elected in 1928. Re-elected in 1930. Redistricted to the at-large district and lost renomination. | |
| District inactive | March 4, 1933 – January 3, 1935 |
73rd | All representatives elected At-large on a general ticket | ||
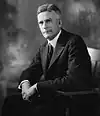
.jpg.webp) Clyde Williams (Hillsboro) |
Democratic | January 3, 1935 – January 3, 1943 |
74th 75th 76th 77th |
Redistricted from the at-large district and re-elected in 1934. Re-elected in 1936. Re-elected in 1938. Re-elected in 1940. Lost re-election. | |
| William P. Elmer (Salem) |
Republican | January 3, 1943 – January 3, 1945 |
78th | Elected in 1942. Lost re-election. | |
 A. S. J. Carnahan (Ellsinore) |
Democratic | January 3, 1945 – January 3, 1947 |
79th | Elected in 1944. Lost re-election. | |
.jpg.webp) Parke M. Banta (Arcadia) |
Republican | January 3, 1947 – January 3, 1949 |
80th | Elected in 1946. Lost re-election. | |
A. S. J. Carnahan (Ellsinore) |
Democratic | January 3, 1949 – January 3, 1961 |
81st 82nd 83rd 84th 85th 86th |
Elected in 1948. Re-elected in 1950. Re-elected in 1952. Re-elected in 1954. Re-elected in 1956. Re-elected in 1958. Lost renomination. | |
 Richard H. Ichord II (Houston) |
Democratic | January 3, 1961 – January 3, 1981 |
87th 88th 89th 90th 91st 92nd 93rd 94th 95th 96th |
Elected in 1960. Re-elected in 1962. Re-elected in 1964. Re-elected in 1966. Re-elected in 1968. Re-elected in 1970. Re-elected in 1972. Re-elected in 1974. Re-elected in 1976. Re-elected in 1978. Retired. | |
 Wendell Bailey (Willow Springs) |
Republican | January 3, 1981 – January 3, 1983 |
97th | Elected in 1980. Redistricted to the 4th district and lost re-election. | |
 Bill Emerson (Cape Girardeau) |
Republican | January 3, 1983 – June 22, 1996 |
98th 99th 100th 101st 102nd 103rd 104th |
Redistricted from the 10th district and re-elected in 1982. Re-elected in 1984. Re-elected in 1986. Re-elected in 1988. Re-elected in 1990. Re-elected in 1992. Re-elected in 1994. Died. |
1983–1993 [data missing] |
| 1993–2003 [data missing] | |||||
| Vacant | June 22, 1996 – November 5, 1996 |
104th | |||
 Jo Ann Emerson (Cape Girardeau) |
Republican | November 5, 1996 – January 3, 1997 |
104th 105th 106th 107th 108th 109th 110th 111th 112th 113th |
Elected to finish her husband's term. Re-elected in 1996. Re-elected in 1998. Re-elected in 2000. Re-elected in 2002. Re-elected in 2004. Re-elected in 2006. Re-elected in 2008. Re-elected in 2010. Re-elected in 2012. Resigned to become CEO of NRECA. | |
| Independent | January 3, 1997 – January 8, 1997 | ||||
| Republican | January 8, 1997 – January 22, 2013 | ||||
2003–2013.gif) | |||||
| Vacant | January 22, 2013 – June 5, 2013 |
113th | |||
 Jason T. Smith (Salem) |
Republican | June 5, 2013 – present |
113th 114th 115th 116th 117th 118th |
Elected to finish Emerson's term. Re-elected in 2014. Re-elected in 2016. Re-elected in 2018. Re-elected in 2020. Re-elected in 2022. | |
2013–2023.tif.png.webp) | |||||
2023–present.svg.png.webp) | |||||
Election results from statewide races
| Year | Office | Results |
|---|---|---|
| 2000 | President | George W. Bush 59 - Al Gore 39% |
| 2004 | President | George W. Bush 64 - John Kerry 36% |
| 2008 | President | John McCain 62 - Barack Obama 36% |
| 2012 | President | Mitt Romney 66 - Barack Obama 32% |
| 2016 | President | Donald Trump 75 - Hillary Clinton 21% |
| 2020 | President | Donald Trump 77 - Joe Biden 21% |
Recent election results
2012
| Party | Candidate | Votes | % | |
|---|---|---|---|---|
| Republican | Jo Ann Emerson (incumbent) | 216,083 | 71.93 | |
| Democratic | Jack Rushin | 73,755 | 24.55 | |
| Libertarian | Rob Vandeven | 10,553 | 3.51 | |
| Total votes | 300,391 | 100.00 | ||
| Republican hold | ||||
2013 special
| Party | Candidate | Votes | % | ||
|---|---|---|---|---|---|
| Republican | Jason Smith | 42,141 | 67.1 | ||
| Democratic | Steve Hodges | 17,207 | 27.4 | ||
| Constitution | Doug Enyart | 2,265 | 3.6 | ||
| Libertarian | Bill Slantz | 968 | 1.5 | ||
| Write-in | 185 | 0.3 | |||
| Total votes | 62,766 | 100 | |||
| Republican hold | |||||
2014
| Party | Candidate | Votes | % | |
|---|---|---|---|---|
| Republican | Jason Smith (incumbent) | 106,124 | 66.6 | |
| Democratic | Barbara Stocker | 38,721 | 24.3 | |
| Independent | Terry Hampton | 6,821 | 4.3 | |
| Constitution | Doug Enyart | 3,799 | 2.4 | |
| Libertarian | Rick Vandeven | 3,759 | 2.4 | |
| Total votes | 159,224 | 100.0 | ||
| Republican hold | ||||
2016
| Party | Candidate | Votes | % | |
|---|---|---|---|---|
| Republican | Jason Smith (incumbent) | 229,792 | 74.4 | |
| Democratic | Dave Cowell | 70,009 | 22.7 | |
| Libertarian | Jonathan Shell | 9,070 | 2.9 | |
| Total votes | 308,871 | 100.0 | ||
| Republican hold | ||||
2018
| Party | Candidate | Votes | % | |
|---|---|---|---|---|
| Republican | Jason Smith (incumbent) | 194,042 | 73.4 | |
| Democratic | Kathy Ellis | 66,151 | 25.0 | |
| Libertarian | Jonathan Shell | 4,206 | 1.6 | |
| Total votes | 264,399 | 100.0 | ||
| Republican hold | ||||
2020
| Party | Candidate | Votes | % | |
|---|---|---|---|---|
| Republican | Jason Smith (incumbent) | 253,811 | 76.9 | |
| Democratic | Kathy Ellis | 70,561 | 21.4 | |
| Libertarian | Tom Schmitz | 5,854 | 1.8 | |
| Total votes | 330,226 | 100.0 | ||
| Republican hold | ||||
Characteristics
Missouri's 8th is a relatively diverse congressional district. Although it is quite conservative and Republican-leaning at the federal level, Democrats formerly performed well here in local and state elections. Bill Clinton, a Democrat from neighboring Arkansas, carried the previous 8th district both times in 1992 and 1996; since then, however, voters in the district have solidly supported the past three Republican presidential nominees.
At the local level, Republicans control a majority of elected county offices in Southeast Missouri. In presidential elections, Democratic candidates formerly performed best in the Bootheel, an agricultural area that is the most impoverished region in the district (and the state, for that matter). It has a wide majority of whites and a significant minority of African Americans. Democrats also used to do well in the Lead Belt region, which contains a core constituency of voters who belong to labor unions, particularly in the mining industry.
The district takes in a large swath of the Bible Belt with evangelical Protestantism being the dominant religion in most counties in the district. This influence is demonstrated in conservative voters' positions on social issues such as abortion, gay rights and gun control. Racially, this district is predominantly white. Many voters here maintain a rural lifestyle where agriculture and farming are the backbone of the economy and are important issues of concern. Socioeconomically, it is the poorest district in Missouri (when measured by the median household income adjusted by inflation).
Largest cities
The 10 largest cities in the district are as follows.
| Rank | City | County | Population (2010) | Population (2015) | Population (2020) |
|---|---|---|---|---|---|
| 1 | Cape Girardeau | Cape Girardeau and Scott | 37,941 | 39,462 | 39,540 |
| 2 | Arnold | Jefferson | 20,875 | 21,213 | 20,858 |
| 3 | Rolla | Phelps | 19,559 | 20,019 | 19,943 |
| 4 | Farmington | St. Francois | 16,240 | 18,181 | 18,217 |
| 5 | Sikeston | Scott and New Madrid | 16,318 | 16,436 | 16,291 |
| 6 | Poplar Bluff | Butler | 17,023 | 17,266 | 16,225 |
| 7 | Jackson | Cape Girardeau | 13,758 | 14,869 | 15,481 |
| 8 | West Plains | Howell | 11,986 | 12,285 | 12,184 |
| 9 | Festus | Jefferson | 11,599 | 11,938 | 12,722 |
| 10 | Kennett | Dunklin | 10,932 | 10,662 | 10,515 |
Median household incomes
| Rank | County | Income (2008) |
|---|---|---|
| 1 | Cape Girardeau | $45,862 |
| 2 | Perry | $44,264 |
| 3 | Taney | $39,771 |
| 4 | Scott | $39,735 |
| 5 | St. Francois | $39,551 |
| 6 | Phelps | $37,243 |
| 7 | Bollinger | $36,744 |
| 8 | Butler | $34,422 |
| 9 | Stoddard | $33,120 |
| 10 | Dent | $32,991 |
| 11 | New Madrid | $32,758 |
| 12 | Washington | $32,001 |
| 13 | Howell | $31,761 |
| 14 | Reynolds | $31,546 |
| 15 | Ozark | $31,508 |
| 16 | Douglas | $31,335 |
| 17 | Iron | $31,276 |
| 18 | Madison | $31,137 |
| 19 | Dunklin | $30,927 |
| 20 | Wright | $30,685 |
| 21 | Texas | $29,260 |
| 22 | Wayne | $29,166 |
| 23 | Mississippi | $28,837 |
| 24 | Carter | $27,608 |
| 25 | Ripley | $27,285 |
| 26 | Pemiscot | $26,992 |
| 27 | Oregon | $26,119 |
| 28 | Shannon | $24,835 |
Median Family Incomes
| Rank | County | Income (2008) |
|---|---|---|
| 1 | Cape Girardeau | $58,037 |
| 2 | Perry | $53,034 |
| 3 | Phelps | $49,343 |
| 4 | Scott | $48,847 |
| 5 | St. Francois | $47,923 |
| 6 | Taney | $47,664 |
| 7 | Bollinger | $42,948 |
| 8 | Butler | $42,713 |
| 9 | Stoddard | $41,072 |
| 10 | Dent | $40,258 |
| 11 | New Madrid | $39,411 |
| 12 | Dunklin | $38,439 |
| 13 | Washington | $38,193 |
| 14 | Madison | $38,067 |
| 15 | Howell | $38,047 |
| 16 | Iron | $38,037 |
| 17 | Reynolds | $37,891 |
| 18 | Wright | $37,139 |
| 19 | Douglas | $36,648 |
| 20 | Ozark | $36,622 |
| 21 | Mississippi | $35,554 |
| 22 | Wayne | $34,727 |
| 23 | Texas | $34,503 |
| 24 | Pemiscot | $33,945 |
| 25 | Carter | $33,349 |
| 26 | Ripley | $33,101 |
| 27 | Oregon | $31,637 |
| 28 | Shannon | $30,102 |
Public school districts
Public Universities
- Southeast Missouri State University - Cape Girardeau
- Southeast Missouri State University-Kennett (Satellite Campus)
- Southeast Missouri State University-Malden (Satellite Campus)
- Perryville Area Higher Education Center (PAHEC) - Perryville (Satellite Campus)
- Sikeston Area Higher Education Center (SAHEC) - Sikeston (Satellite Campus)
- Southeast Missouri Hospital College of Nursing
- Missouri University of Science and Technology - Rolla (Formerly known as the University of Missouri-Rolla [UMR])
- Missouri State University - Springfield (Formerly known as Southwest Missouri State University) - Located in Missouri's 7th congressional district
- Missouri State University-Mountain Grove (Satellite Campus)
- Missouri State University-West Plains (Satellite Campus)
Community Colleges
- Mineral Area College - Park Hills
- Mineral Area Regional Medical Center School of Radiation Technology
- Three Rivers Community College - Poplar Bluff
Election results from presidential races, by county
2000
| County | George W. Bush | % | Al Gore | % | Ralph Nader | % | Others | % | Margin | % | Total |
|---|---|---|---|---|---|---|---|---|---|---|---|
| Bollinger | 3,487 | 65.87% | 1,692 | 31.96% | 41 | 0.77% | 74 | 1.40% | −1,795 | R+ 33.91% | 5,294 |
| Butler | 9,111 | 63.28% | 4,996 | 34.70% | 149 | 1.03% | 141 | 0.99% | −4,115 | R+ 28.58% | 14,397 |
| Cape Girardeau | 19,832 | 66.42% | 9,334 | 31.26% | 376 | 1.26% | 317 | 1.06% | −10,498 | R+ 35.16% | 29,859 |
| Carter | 1,730 | 61.61% | 997 | 35.51% | 40 | 1.42% | 41 | 1.46% | −733 | R+ 26.10% | 2,808 |
| Crawford | 4,754 | 57.26% | 3,350 | 40.35% | 100 | 1.20% | 98 | 1.19% | −1,404 | R+ 16.91% | 8,302 |
| Dent | 3,996 | 66.73% | 1,839 | 30.71% | 66 | 1.10% | 87 | 1.46% | −2,157 | R+ 36.02% | 5,988 |
| Dunklin | 5,426 | 51.55% | 4,947 | 47.00% | 78 | 0.74% | 74 | 0.70% | −479 | R+ 4.55% | 10,525 |
| Howell | 9,018 | 64.07% | 4,641 | 32.97% | 197 | 1.40% | 219 | 1.56% | −4,377 | R+ 31.10% | 14,075 |
| Iron | 2,237 | 50.68% | 2,044 | 46.31% | 64 | 1.45% | 69 | 1.56% | −193 | R+ 4.37% | 4,414 |
| Madison | 2,460 | 56.25% | 1,828 | 41.80% | 42 | 0.96% | 43 | 0.99% | −632 | R+ 14.45% | 4,373 |
| Mississippi | 2,395 | 45.93% | 2,756 | 52.85% | 29 | 0.56% | 35 | 0.67% | −361 | D+ 6.92% | 5,215 |
| New Madrid | 3,416 | 47.01% | 3,738 | 51.45% | 45 | 0.62% | 67 | 0.92% | −322 | D+ 4.44% | 7,266 |
| Oregon | 2,521 | 59.56% | 1,568 | 37.04% | 60 | 1.42% | 84 | 1.98% | −953 | R+ 22.52% | 4,233 |
| Pemiscot | 2,750 | 45.38% | 3,245 | 53.55% | 37 | 0.61% | 28 | 0.46% | −495 | D+ 8.17% | 6,060 |
| Perry | 4,667 | 67.61% | 2,085 | 30.20% | 70 | 1.01% | 81 | 1.17% | −2,582 | R+ 37.41% | 6,903 |
| Phelps | 9,444 | 58.49% | 6,262 | 38.78% | 253 | 1.57% | 187 | 1.16% | −3,182 | R+ 19.71% | 16,146 |
| Reynolds | 1,762 | 56.28% | 1,298 | 41.46% | 42 | 1.34% | 29 | 0.92% | −464 | R+ 14.82% | 3,131 |
| Ripley | 3,121 | 61.62% | 1,820 | 35.93% | 58 | 1.15% | 66 | 1.30% | −1,301 | R+ 25.69% | 5,065 |
| Scott | 8,999 | 57.30% | 6,452 | 41.09% | 113 | 0.72% | 130 | 0.83% | −2,547 | R+ 16.21% | 15,704 |
| Shannon | 2,245 | 59.38% | 1,430 | 37.82% | 48 | 1.27% | 58 | 1.53% | −815 | R+ 21.56% | 3,781 |
| St. Francois | 9,327 | 49.50% | 9,075 | 48.17% | 265 | 1.41% | 174 | 0.93% | −252 | R+ 1.33% | 18,841 |
| Stoddard | 7,727 | 62.04% | 4,476 | 35.94% | 114 | 0.92% | 137 | 1.10% | −3,251 | R+ 26.10% | 12,454 |
| Texas | 6,136 | 61.78% | 3,486 | 35.10% | 137 | 1.38% | 173 | 1.74% | −2,650 | R+ 26.68% | 9,932 |
| Washington | 4,020 | 48.64% | 4,047 | 48.97% | 95 | 1.15% | 103 | 1.25% | −27 | D+ 0.33% | 8,265 |
| Wayne | 3,346 | 57.22% | 2,387 | 40.82% | 55 | 0.94% | 60 | 1.03% | −959 | R+ 16.40% | 5,848 |
| Wright | 5,391 | 68.75% | 2,250 | 28.70% | 86 | 1.10% | 114 | 1.45% | −3,141 | R+ 40.05% | 7,841 |
| District Total | 139,318 | 58.85% | 92,043 | 38.88% | 2,660 | 1.12% | 2,689 | 1.14% | 47,275 | R+ 19.97% | 236,720 |
2004
| County | George W. Bush | % | John Kerry | % | Others | % | Margin | % | Total |
|---|---|---|---|---|---|---|---|---|---|
| Bollinger | 4,102 | 69.58% | 1,754 | 29.75% | 39 | 0.63% | −2,348 | R+ 39.83% | 5,895 |
| Butler | 11,696 | 71.14% | 4,666 | 28.38% | 79 | 0.48% | −7,030 | R+ 42.76% | 16,441 |
| Cape Girardeau | 23,814 | 68.90% | 10,568 | 30.57% | 183 | 0.53% | −13,246 | R+ 38.33% | 34,565 |
| Carter | 1,797 | 64.66% | 964 | 34.69% | 18 | 0.64% | −833 | R+ 29.97% | 2,779 |
| Dent | 4,369 | 69.31% | 1,865 | 29.58% | 70 | 1.12% | −2,504 | R+ 39.73% | 6,304 |
| Douglas | 4,498 | 71.09% | 1,741 | 27.52% | 88 | 1.39% | −2,757 | R+ 43.57% | 6,327 |
| Dunklin | 6,720 | 57.55% | 4,901 | 41.97% | 56 | 0.48% | −1,819 | R+ 15.58% | 11,677 |
| Howell | 11,097 | 67.75% | 5,118 | 31.25% | 164 | 1.00% | −5,979 | R+ 36.50% | 16,379 |
| Iron | 2,477 | 52.94% | 2,157 | 46.10% | 45 | 0.96% | −320 | R+ 6.84% | 4,679 |
| Madison | 2,905 | 59.07% | 1,972 | 40.10% | 41 | 0.84% | −933 | R+ 18.97% | 4,918 |
| Mississippi | 2,903 | 54.79% | 2,374 | 44.81% | 21 | 0.40% | −529 | R+ 9.98% | 5,298 |
| New Madrid | 4,154 | 52.54% | 3,716 | 47.00% | 37 | 0.47% | −438 | R+ 5.54% | 7,907 |
| Oregon | 2,769 | 59.26% | 1,823 | 39.01% | 81 | 1.74% | −946 | R+ 20.25% | 4,673 |
| Ozark | 3,083 | 65.50% | 1,561 | 33.16% | 63 | 1.34% | −1,522 | R+ 32.34% | 4,707 |
| Pemiscot | 3,398 | 49.93% | 3,381 | 49.68% | 27 | 0.40% | −17 | R+ 0.25% | 6,806 |
| Perry | 5,583 | 67.70% | 2,621 | 31.78% | 43 | 0.52% | −2,962 | R+ 35.92% | 8,247 |
| Phelps | 11,874 | 63.50% | 6,666 | 35.65% | 160 | 0.75% | −5,208 | R+ 27.85% | 18,700 |
| Reynolds | 1,896 | 56.36% | 1,449 | 43.07% | 19 | 0.57% | −447 | R+ 13.29% | 3,364 |
| Ripley | 3,693 | 65.33% | 1,907 | 33.73% | 53 | 0.94% | −1,786 | R+ 31.60% | 5,653 |
| Scott | 11,330 | 64.94% | 6,057 | 34.71% | 61 | 0.35% | −5,273 | R+ 30.23% | 17,448 |
| Shannon | 2,511 | 60.26% | 1,618 | 38.83% | 38 | 0.92% | −893 | R+ 21.43% | 4,167 |
| St. Francois | 12,087 | 52.71% | 10,748 | 46.87% | 98 | 0.43% | −1,339 | R+ 5.84% | 22,933 |
| Stoddard | 9,242 | 69.74% | 3,946 | 29.78% | 64 | 0.48% | −5,296 | R+ 39.96% | 13,252 |
| Taney* | 3,496 | 67.53% | 1,644 | 31.76% | 37 | 0.71% | −1,852 | R+ 35.77% | 5,177 |
| Texas | 7,234 | 65.66% | 3,664 | 33.25% | 120 | 1.09% | −3,570 | R+ 32.41% | 11,018 |
| Washington | 4,641 | 50.57% | 4,459 | 48.58% | 78 | 0.84% | −182 | R+ 1.99% | 9,178 |
| Wayne | 3,919 | 63.17% | 2,250 | 36.27% | 35 | 0.57% | −1,669 | R+ 26.90% | 6,204 |
| Wright | 6,090 | 72.97% | 2,188 | 26.22% | 68 | 0.82% | −3,902 | R+ 46.75% | 8,346 |
| District Total | 173,378 | 63.50% | 97,778 | 35.81% | 1,886 | 0.69% | 75,600 | R+ 27.69% | 273,042 |
- These numbers reflect only the eastern sections of Taney County that were included in the 8th Congressional District.
2008
| County | John McCain | % | Barack Obama | % | Others | % | Margin | % | Total |
|---|---|---|---|---|---|---|---|---|---|
| Bollinger | 3,972 | 68.67% | 1,690 | 29.22% | 122 | 2.11% | −2,282 | R+ 39.45% | 5,784 |
| Butler | 11,805 | 68.09% | 5,316 | 30.66% | 217 | 1.25% | −6,489 | R+ 37.43% | 17,338 |
| Cape Girardeau | 24,768 | 66.30% | 12,208 | 32.68% | 379 | 1.01% | −12,560 | R+ 33.62% | 37,446 |
| Carter | 1,840 | 63.49% | 984 | 33.95% | 74 | 2.55% | −856 | R+ 29.54% | 2,898 |
| Dent | 4,655 | 67.78% | 2,056 | 29.94% | 157 | 2.29% | −2,599 | R+ 37.84% | 6,868 |
| Douglas | 4,405 | 65.63% | 2,140 | 31.88% | 167 | 2.49% | −2,265 | R+ 33.75% | 6,712 |
| Dunklin | 7,044 | 59.88% | 4,540 | 38.59% | 180 | 1.53% | −2,504 | R+ 21.29% | 11,764 |
| Howell | 10,982 | 64.49% | 5,736 | 33.68% | 311 | 1.83% | −5,246 | R+ 30.81% | 17,029 |
| Iron | 2,090 | 47.35% | 2,213 | 50.14% | 111 | 2.51% | −123 | D+ 2.79% | 4,414 |
| Madison | 2,897 | 57.62% | 2,042 | 40.61% | 89 | 1.77% | −855 | R+ 17.01% | 5,028 |
| Mississippi | 3,034 | 56.65% | 2,247 | 41.95% | 75 | 1.40% | −787 | R+ 14.70% | 5,356 |
| New Madrid | 4,593 | 56.76% | 3,370 | 41.65% | 129 | 1.59% | −1,223 | R+ 15.11% | 8,092 |
| Oregon | 2,652 | 57.77% | 1,811 | 39.45% | 128 | 2.78% | −841 | R+ 18.32% | 4,591 |
| Ozark | 2,918 | 62.27% | 1,661 | 35.45% | 107 | 2.28% | −1,257 | R+ 26.82% | 4,686 |
| Pemiscot | 3,954 | 56.11% | 3,029 | 42.98% | 64 | 0.91% | −925 | R+ 13.13% | 7,047 |
| Perry | 5,527 | 63.92% | 3,005 | 34.75% | 115 | 1.33% | −2,522 | R+ 29.17% | 8,647 |
| Phelps | 11,706 | 60.22% | 7,394 | 38.04% | 338 | 1.74% | −4,312 | R+ 22.18% | 19,524 |
| Reynolds | 1,782 | 54.21% | 1,418 | 43.14% | 87 | 2.65% | −364 | R+ 11.07% | 3,287 |
| Ripley | 3,407 | 63.53% | 1,795 | 33.47% | 161 | 3.00% | −1,612 | R+ 30.06% | 5,363 |
| Scott | 11,563 | 64.15% | 6,258 | 34.72% | 205 | 1.13% | −5,305 | R+ 29.43% | 18,082 |
| Shannon | 2,075 | 54.06% | 1,637 | 42.65% | 126 | 3.29% | −438 | R+ 11.41% | 3,838 |
| St. Francois | 12,660 | 51.57% | 11,540 | 47.01% | 350 | 1.42% | −1,120 | R+ 4.56% | 24,550 |
| Stoddard | 9,172 | 69.16% | 3,899 | 29.40% | 191 | 1.44% | −5,273 | R+ 39.76% | 13,262 |
| Taney* | 2,138 | 67.62% | 979 | 30.96% | 45 | 1.42% | −1,159 | R+ 36.66% | 3,162 |
| Texas | 7,215 | 66.49% | 3,410 | 31.43% | 226 | 2.08% | −3,805 | R+ 35.06% | 10,851 |
| Washington | 4,706 | 48.95% | 4,711 | 49.00% | 197 | 2.05% | −5 | D+ 0.05% | 9,614 |
| Wayne | 3,784 | 61.49% | 2,243 | 36.45% | 127 | 2.06% | −1,541 | R+ 25.04% | 6,154 |
| Wright | 5,784 | 67.94% | 2,557 | 30.03% | 173 | 2.03% | −3,227 | R+ 37.91% | 8,514 |
| District Total | 174,564 | 61.92% | 102,682 | 36.42% | 4,688 | 1.66% | 71,882 | R+ 25.50% | 281,934 |
- These numbers reflect only the eastern sections of Taney County that were included in the 8th Congressional District.
2012
| County | Mitt Romney | % | Barack Obama | % | Others | % | Margin | % | Total |
|---|---|---|---|---|---|---|---|---|---|
| Bollinger | 4,095 | 75.05% | 1,213 | 22.23% | 148 | 2.72% | −2,882 | R+ 52.82% | 5,456 |
| Butler | 12,248 | 72.52% | 4,363 | 25.83% | 278 | 1.65% | −7,885 | R+ 46.69% | 16,889 |
| Cape Girardeau | 25,370 | 70.81% | 9,728 | 27.15% | 731 | 2.04% | −15,642 | R+ 43.66% | 35,829 |
| Carter | 1,978 | 70.67% | 754 | 26.94% | 67 | 2.39% | −1,224 | R+ 43.73% | 2,799 |
| Crawford | 6,434 | 67.17% | 2,951 | 30.81% | 194 | 2.03% | −3,483 | R+ 36.36% | 9,579 |
| Dent | 4,883 | 73.51% | 1,585 | 23.86% | 175 | 2.63% | −3,298 | R+ 49.65% | 6,671 |
| Douglas | 4,649 | 70.90% | 1,710 | 26.08% | 198 | 3.02% | −2,939 | R+ 44.82% | 6,557 |
| Dunklin | 6,850 | 64.31% | 3,636 | 34.14% | 165 | 1.55% | −3,214 | R+ 30.17% | 10,651 |
| Howell | 11,544 | 70.62% | 4,395 | 26.89% | 407 | 2.49% | −7,149 | R+ 43.73% | 16,346 |
| Iron | 2,252 | 55.87% | 1,669 | 41.40% | 110 | 2.73% | −583 | R+ 14.47% | 4,031 |
| Jefferson* | 14,608 | 55.18% | 11,277 | 42.59% | 591 | 2.23% | −3,331 | R+ 12.59% | 26,476 |
| Madison | 3,227 | 65.46% | 1,588 | 32.21% | 115 | 2.33% | −1,639 | R+ 33.25% | 4,930 |
| Mississippi | 2,997 | 60.91% | 1,858 | 37.76% | 65 | 1.33% | −1,139 | R+ 23.15% | 4,920 |
| New Madrid | 4,284 | 59.09% | 2,814 | 38.81% | 152 | 2.10% | −1,470 | R+ 20.28% | 7,250 |
| Oregon | 2,886 | 65.28% | 1,419 | 32.10% | 116 | 2.62% | −1,467 | R+ 33.18% | 4,421 |
| Ozark | 3,080 | 69.17% | 1,261 | 28.32% | 112 | 2.51% | −1,819 | R+ 40.85% | 4,453 |
| Pemiscot | 3,598 | 56.80% | 2,671 | 42.16% | 66 | 1.04% | −927 | R+ 14.64% | 6,335 |
| Perry | 5,669 | 70.98% | 2,184 | 27.34% | 134 | 1.68% | −3,485 | R+ 43.64% | 7,987 |
| Phelps | 11,895 | 65.05% | 5,798 | 31.71% | 593 | 3.24% | −6,097 | R+ 33.34% | 18,286 |
| Reynolds | 1,931 | 60.31% | 1,157 | 36.13% | 114 | 3.56% | −774 | R+ 24.18% | 3,202 |
| Ripley | 3,743 | 71.12% | 1,396 | 26.52% | 124 | 2.36% | −2,347 | R+ 44.60% | 5,263 |
| Scott | 11,623 | 68.37% | 5,122 | 30.13% | 254 | 1.50% | −6,501 | R+ 38.24% | 16,999 |
| Shannon | 2,262 | 61.27% | 1,302 | 35.27% | 128 | 3.46% | −960 | R+ 26.00% | 3,692 |
| St. Francois | 13,248 | 58.67% | 8,829 | 39.10% | 505 | 2.23% | −4,419 | R+ 19.57% | 22,705 |
| Ste. Genevieve | 4,055 | 50.25% | 3,813 | 47.25% | 202 | 2.50% | −242 | R+ 3.00% | 8,070 |
| Stoddard | 9,496 | 73.81% | 3,153 | 24.51% | 217 | 1.68% | −6,343 | R+ 49.30% | 12,866 |
| Texas | 7,618 | 70.77% | 2,871 | 26.67% | 275 | 2.56% | −4,747 | R+ 44.10% | 10,764 |
| Washington | 5,071 | 58.32% | 3,417 | 39.30% | 207 | 2.38% | −1,654 | R+ 19.02% | 8,695 |
| Wayne | 3,790 | 66.26% | 1,813 | 31.70% | 117 | 2.04% | −1,977 | R+ 34.56% | 5,720 |
| Wright | 5,830 | 73.29% | 1,953 | 24.55% | 172 | 2.16% | −3,877 | R+ 48.74% | 7,955 |
| District Total | 201,214 | 65.88% | 97,700 | 31.99% | 6,523 | 2.13% | 103,514 | R+ 33.89% | 305,437 |
- These numbers reflect only the western and southern sections of Jefferson County that are included in the 8th Congressional District.
2008 Democratic Presidential Primary
| County | Hillary Clinton | % | Barack Obama | % | John Edwards | % | Others | % | Margin | % | Total |
|---|---|---|---|---|---|---|---|---|---|---|---|
| Bollinger | 971 | 74.12% | 293 | 22.37% | 38 | 2.90% | 8 | 0.61% | −678 | C+ 51.75% | 1,310 |
| Butler | 2,490 | 69.87% | 960 | 26.94% | 82 | 2.30% | 32 | 0.90% | −1,530 | C+ 42.93% | 3,564 |
| Cape Girardeau | 4,510 | 56.55% | 3,145 | 39.44% | 247 | 3.10% | 73 | 0.92% | −1,365 | C+ 17.11% | 7,975 |
| Carter | 541 | 75.24% | 137 | 19.05% | 32 | 4.45% | 5 | 0.70% | −404 | C+ 56.19% | 719 |
| Dent | 962 | 62.23% | 493 | 31.89% | 74 | 4.79% | 17 | 1.10% | −469 | C+ 30.34% | 1,546 |
| Douglas | 827 | 62.32% | 454 | 34.21% | 39 | 2.94% | 7 | 0.53% | −373 | C+ 28.11% | 1,327 |
| Dunklin | 2,587 | 78.44% | 604 | 18.31% | 69 | 2.09% | 38 | 1.15% | −1,983 | C+ 60.13% | 3,298 |
| Howell | 2,307 | 64.07% | 1,168 | 32.44% | 99 | 2.75% | 27 | 0.75% | −1,139 | C+ 31.63% | 3,601 |
| Iron | 1,180 | 70.53% | 406 | 24.27% | 72 | 4.30% | 15 | 0.90% | −774 | C+ 46.26% | 1,673 |
| Madison | 971 | 68.72% | 344 | 24.35% | 64 | 4.53% | 34 | 2.40% | −627 | C+ 44.37% | 1,413 |
| Mississippi | 1,094 | 65.43% | 502 | 30.02% | 57 | 3.41% | 19 | 1.14% | −592 | C+ 35.41% | 1,672 |
| New Madrid | 1,801 | 71.19% | 610 | 24.11% | 101 | 3.99% | 18 | 0.71% | −1,191 | C+ 47.08% | 2,530 |
| Oregon | 989 | 71.77% | 332 | 24.09% | 42 | 3.05% | 15 | 1.09% | −657 | C+ 47.68% | 1,378 |
| Ozark | 689 | 65.62% | 332 | 31.62% | 18 | 1.71% | 11 | 1.05% | −357 | C+ 34.00% | 1,050 |
| Pemiscot | 1,270 | 70.83% | 466 | 25.99% | 34 | 1.90% | 23 | 1.28% | −804 | C+ 44.84% | 1,793 |
| Perry | 1,180 | 61.24% | 650 | 33.73% | 81 | 4.20% | 16 | 0.83% | −530 | C+ 27.51% | 1,927 |
| Phelps | 2,392 | 53.93% | 1,878 | 42.34% | 122 | 2.75% | 43 | 0.97% | −514 | C+ 11.59% | 4,435 |
| Reynolds | 741 | 66.22% | 277 | 24.75% | 70 | 6.26% | 31 | 2.77% | −464 | C+ 41.47% | 1,119 |
| Ripley | 1,073 | 74.20% | 282 | 19.50% | 72 | 4.98% | 19 | 1.31% | −791 | C+ 54.70% | 1,446 |
| Scott | 2,931 | 63.43% | 1,443 | 31.23% | 191 | 4.13% | 56 | 1.22% | −1,488 | C+ 32.20% | 4,621 |
| Shannon | 914 | 69.72% | 323 | 24.64% | 50 | 3.81% | 24 | 1.83% | −591 | C+ 45.08% | 1,311 |
| St. Francois | 5,418 | 70.25% | 1,993 | 25.84% | 224 | 2.90% | 78 | 1.01% | −3,425 | C+ 44.41% | 7,713 |
| Stoddard | 2,225 | 72.95% | 684 | 22.43% | 112 | 3.67% | 29 | 0.95% | −1,541 | C+ 50.52% | 3,050 |
| Taney* | 1,219 | 62.51% | 674 | 34.56% | 39 | 2.00% | 18 | 0.92% | −545 | C+ 27.95% | 1,950 |
| Texas | 1,858 | 68.03% | 743 | 27.21% | 101 | 3.70% | 29 | 1.06% | −1,115 | C+ 40.82% | 2,731 |
| Washington | 2,345 | 74.63% | 670 | 21.32% | 100 | 3.18% | 27 | 0.86% | −1,675 | C+ 53.31% | 3,142 |
| Wayne | 1,458 | 75.94% | 359 | 18.70% | 71 | 3.70% | 32 | 1.66% | −1,099 | C+ 57.24% | 1,920 |
| Wright | 1,143 | 69.48% | 452 | 27.48% | 36 | 2.19% | 14 | 0.85% | −691 | C+ 42.00% | 1,645 |
| District Total | 48,086 | 66.92% | 20,674 | 28.77% | 2,337 | 3.25% | 762 | 1.06% | 27,412 | C+ 38.15% | 71,859 |
- These numbers reflect only the eastern sections of Taney County that were included in the 8th Congressional District at the time of the Missouri Democratic Presidential Primary on Super Tuesday, February 5, 2008.
2008 Republican Presidential Primary
| County | Mike Huckabee | % | John McCain | % | Mitt Romney | % | Ron Paul | % | Others | % | Margin | % | Total |
|---|---|---|---|---|---|---|---|---|---|---|---|---|---|
| Bollinger | 657 | 39.72% | 518 | 31.32% | 384 | 23.22% | 65 | 3.93% | 30 | 1.81% | −139 | H+ 8.04% | 1,654 |
| Butler | 2,215 | 48.85% | 1,117 | 24.64% | 1,007 | 22.21% | 134 | 2.96% | 61 | 1.35% | −1,098 | H+ 24.21% | 4,534 |
| Cape Girardeau | 3,068 | 27.63% | 3,528 | 31.77% | 3,922 | 35.32% | 361 | 3.25% | 226 | 2.04% | −394 | R+ 3.55% | 11,105 |
| Carter | 373 | 52.39% | 202 | 28.37% | 107 | 15.03% | 24 | 3.37% | 6 | 0.84% | −171 | H+ 24.02% | 712 |
| Dent | 959 | 48.78% | 442 | 22.48% | 411 | 20.91% | 127 | 6.46% | 27 | 1.37% | −517 | H+ 26.30% | 1,966 |
| Douglas | 1,343 | 55.04% | 516 | 21.15% | 270 | 11.07% | 295 | 12.09% | 16 | 0.66% | −827 | H+ 33.89% | 2,440 |
| Dunklin | 1,309 | 58.52% | 480 | 21.46% | 381 | 17.03% | 36 | 1.61% | 31 | 1.39% | −829 | H+ 37.06% | 2,237 |
| Howell | 2,882 | 52.97% | 1,347 | 24.76% | 793 | 14.57% | 356 | 6.54% | 63 | 1.16% | −1,535 | H+ 28.21% | 5,441 |
| Iron | 354 | 43.17% | 269 | 32.80% | 138 | 16.83% | 43 | 5.24% | 16 | 1.95% | −85 | H+ 10.37% | 820 |
| Madison | 560 | 43.96% | 452 | 35.48% | 185 | 14.52% | 51 | 4.00% | 26 | 2.04% | −108 | H+ 8.48% | 1,274 |
| Mississippi | 471 | 42.59% | 373 | 33.73% | 226 | 20.43% | 15 | 1.36% | 21 | 1.90% | −98 | H+ 8.86% | 1,106 |
| New Madrid | 656 | 48.74% | 386 | 28.68% | 250 | 18.57% | 43 | 3.19% | 11 | 0.82% | −270 | H+ 20.06% | 1,346 |
| Oregon | 696 | 58.88% | 242 | 20.47% | 134 | 11.34% | 101 | 8.54% | 9 | 0.76% | −454 | H+ 38.41% | 1,182 |
| Ozark | 766 | 48.09% | 428 | 26.87% | 235 | 14.75% | 149 | 9.35% | 15 | 0.94% | −338 | H+ 21.22% | 1,593 |
| Pemiscot | 565 | 57.59% | 233 | 23.75% | 149 | 15.19% | 20 | 2.04% | 14 | 1.43% | −332 | H+ 33.84% | 981 |
| Perry | 575 | 25.76% | 973 | 43.59% | 542 | 24.28% | 96 | 4.30% | 46 | 2.06% | −398 | M+ 17.83% | 2,232 |
| Phelps | 1,728 | 35.15% | 1,459 | 29.68% | 1,340 | 27.26% | 321 | 6.53% | 68 | 1.38% | −269 | H+ 5.47% | 4,916 |
| Reynolds | 283 | 46.09% | 202 | 32.90% | 93 | 15.15% | 25 | 4.07% | 11 | 1.79% | −81 | H+ 13.19% | 614 |
| Ripley | 750 | 53.84% | 329 | 23.62% | 238 | 17.09% | 52 | 3.73% | 24 | 1.72% | −421 | H+ 30.22% | 1,393 |
| Scott | 1,549 | 36.79% | 1,389 | 32.99% | 1,076 | 25.56% | 113 | 2.68% | 83 | 1.97% | −160 | H+ 3.80% | 4,210 |
| Shannon | 515 | 54.44% | 223 | 23.57% | 83 | 8.77% | 109 | 11.52% | 16 | 1.69% | −292 | H+ 30.87% | 946 |
| St. Francois | 1,631 | 35.90% | 1,727 | 38.01% | 949 | 20.89% | 134 | 2.95% | 102 | 2.25% | −96 | M+ 2.11% | 4,543 |
| Stoddard | 1,571 | 50.56% | 772 | 24.85% | 643 | 20.70% | 91 | 2.93% | 30 | 0.97% | −799 | H+ 25.71% | 3,107 |
| Taney* | 1,821 | 55.89% | 844 | 25.91% | 462 | 14.18% | 92 | 2.82% | 40 | 1.23% | −977 | H+ 29.98% | 3,258 |
| Texas | 1,727 | 50.13% | 954 | 27.69% | 480 | 13.93% | 234 | 6.79% | 50 | 1.45% | −773 | H+ 22.44% | 3,445 |
| Washington | 622 | 38.73% | 616 | 38.36% | 297 | 18.49% | 50 | 3.11% | 21 | 1.31% | −6 | H+ 0.37% | 1,606 |
| Wayne | 740 | 45.20% | 499 | 30.48% | 323 | 19.73% | 46 | 2.81% | 29 | 1.77% | −241 | H+ 14.72% | 1,637 |
| Wright | 1,878 | 59.64% | 746 | 23.69% | 298 | 9.46% | 178 | 5.65% | 49 | 1.56% | −1,132 | H+ 35.95% | 3,149 |
| District Total | 32,264 | 43.93% | 21,266 | 28.95% | 15,416 | 20.99% | 3,361 | 4.58% | 1,141 | 1.55% | 10,998 | H+ 14.98% | 73,447 |
- These numbers reflect only the eastern sections of Taney County that were included in the 8th Congressional District at the time of the Missouri Republican Presidential Primary on Super Tuesday, February 5, 2008.
See also
References
- "My Congressional District".
- "2022 Cook PVI: District Map and List". Cook Political Report. Retrieved January 10, 2023.
- "State of Missouri - Election Night Results".
- "State of Missouri - Election Night Results".
- "State of Missouri - Election Night Results".
- "2016 General Election Official Results". Missouri Secretary of State. November 8, 2016. Retrieved November 30, 2016.
- Johnson, Cheryl L. (February 28, 2019). "Statistics of the Congressional Election of November 6, 2018". Clerk of the U.S. House of Representatives. Retrieved April 27, 2019.
- "All Results State of Missouri - State of Missouri - General Election, November 03, 2020". Missouri Secretary of State. Retrieved December 9, 2020.
- Martis, Kenneth C. (1989). The Historical Atlas of Political Parties in the United States Congress. New York: Macmillan Publishing Company.
- Martis, Kenneth C. (1982). The Historical Atlas of United States Congressional Districts. New York: Macmillan Publishing Company.
- Congressional Biographical Directory of the United States 1774–present