Maine's 1st congressional district
Maine's 1st congressional district is a congressional district in the U.S. state of Maine. The geographically smaller of the state's two congressional districts, the district covers the southern coastal area of the state. The district consists of all of Cumberland, Knox, Lincoln, Sagadahoc, and York counties and most of Kennebec County. Located within the district are the cities of Portland, Brunswick, and Saco. The district is currently represented by Democrat Chellie Pingree.
| Maine's 1st congressional district | |||
|---|---|---|---|
.png.webp) Maine's 1st congressional district – since January 3, 2023. | |||
| Representative |
| ||
| Distribution |
| ||
| Population (2022) | 697,698 | ||
| Median household income | $80,938[1] | ||
| Ethnicity |
| ||
| Cook PVI | D+9[2] | ||
History
Maine was initially a part of the state of Massachusetts. Massachusetts was allocated 20 districts after the 1810 U.S. census. When Maine became a state in 1820, seven of those districts were credited to it. Since then, all but the 1st and 2nd congressional districts have become obsolete.
Maine's 1st congressional district consists of:
Recent election results from presidential races
| Year | Results |
|---|---|
| 1972 | Nixon 61 – 39% |
| 1976 | Ford 49 – 48% |
| 1980 | Reagan 45 – 42% |
| 1984 | Reagan 60 – 40% |
| 1988 | Bush 56 – 43% |
| 1992 | B Clinton 40 – 32% |
| 1996 | B Clinton 52 – 32% |
| 2000 | Gore 51 – 43% |
| 2004 | Kerry 55 – 43% |
| 2008 | Obama 61 – 38% |
| 2012 | Obama 60 – 38% |
| 2016[3] | H Clinton 54 – 39% |
| 2020 | Biden 60 – 37% |
List of members representing the district
| Member (Residence) |
Party | Years ↑ | Cong ress |
Electoral history | District location |
|---|---|---|---|---|---|
| District created March 4, 1821 | |||||
| Joseph Dane (Kennebunk) |
Federalist | March 4, 1821 – March 3, 1823 |
17th | Redistricted from the at-large district and re-elected in 1820. Retired. |
1821–1823 York County: Alfred, Arundel, Berwick, Biddeford, Elliot, Hollis, Kennebunk, Kittery, Lebanon, Limerick, Lyman, Newfield, Saco, Sanford, Shapleigh, South Berwick, Waterborough, Wells, York |
| William Burleigh (South Berwick) |
Democratic-Republican | March 4, 1823 – March 3, 1825 |
18th 19th 20th |
Elected in 1823. Re-elected in 1824. Re-elected in 1826. Died. |
1823–1833 York County: Alfred, Berwick, Biddeford, Buxton, Elliot, Hollis, Kennebunk, Kennebunk Port, Kittery, Lebanon, Limerick, Lyman, Newfield, Parsonsfield, Saco, Sanford, Shapleigh, South Berwick, Waterborough, Wells, York |
| Anti-Jacksonian | March 4, 1825 – July 2, 1827 | ||||
| Vacant | July 2, 1827 – September 10, 1827 |
20th | |||
| Rufus McIntire (Parsonsfield) |
Jacksonian | September 10, 1827 – March 3, 1835 |
20th 21st 22nd 23rd |
Elected to finish Burleigh's term. Re-elected in 1828. Re-elected in 1830. Re-elected in 1833. Retired. | |
| 1833–1843 [data missing] | |||||
.jpg.webp) John Fairfield (Saco) |
Democratic | March 4, 1835 – December 24, 1838 |
24th 25th |
Elected in 1834. Re-elected in 1836. Retired to run for governor and resigned when elected. | |
| Vacant | December 24, 1838 – March 3, 1839 |
25th | |||
 Nathan Clifford (Newfield) |
Democratic | March 4, 1839 – March 3, 1843 |
26th 27th |
Elected in 1838. Re-elected in 1840. Retired. | |
| Joshua Herrick (Kennebunkport) |
Democratic | March 4, 1843 – March 3, 1845 |
28th | Elected in 1843. Lost renomination. |
1843–1853 [data missing] |
| John Fairfield Scamman (Saco) |
Democratic | March 4, 1845 – March 3, 1847 |
29th | Elected in 1844. Retired. | |
| David Hammons (Lovell) |
Democratic | March 4, 1847 – March 3, 1849 |
30th | Elected in 1846. Retired. | |
.jpg.webp) Elbridge Gerry (Waterford) |
Democratic | March 4, 1849 – March 3, 1851 |
31st | Elected in 1848. Retired. | |
| Moses Macdonald (Portland) |
Democratic | March 4, 1851 – March 3, 1855 |
32nd 33rd |
Elected in 1850. Re-elected in 1852. Retired. | |
| 1853–1863 [data missing] | |||||
| John M. Wood (Portland) |
Republican | March 4, 1855 – March 3, 1859 |
34th 35th |
Elected in 1854. Re-elected in 1856. Retired. | |
 Daniel E. Somes (Biddeford) |
Republican | March 4, 1859 – March 3, 1861 |
36th | Elected in 1858. Retired. | |
 John N. Goodwin (South Berwick) |
Republican | March 4, 1861 – March 3, 1863 |
37th | Elected in 1860. Lost re-election. | |
.jpg.webp) Lorenzo De Medici Sweat (Portland) |
Democratic | March 4, 1863 – March 3, 1865 |
38th | Elected in 1862. Lost re-election. |
1863–1873 [data missing] |
 John Lynch (Portland) |
Republican | March 4, 1865 – March 3, 1873 |
39th 40th 41st 42nd |
Elected in 1864. Re-elected in 1866. Re-elected in 1868. Re-elected in 1870. Retired. | |
 John H. Burleigh (South Berwick) |
Republican | March 4, 1873 – March 3, 1877 |
43rd 44th |
Elected in 1872. Re-elected in 1874. Lost renomination. |
1873–1883 [data missing] |
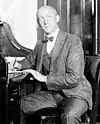
 Thomas Brackett Reed (Portland) |
Republican | March 4, 1877 – March 3, 1883 |
45th 46th 47th |
Elected in 1876. Re-elected in 1878. Re-elected in 1880. Redistricted to the at-large district. | |
| District inactive | March 3, 1883 – March 3, 1885 |
48th | At-large districts used. | ||
Thomas Brackett Reed (Portland) |
Republican | March 4, 1885 – September 4, 1899 |
49th 50th 51st 52nd 53rd 54th 55th 56th |
Redistricted from the at-large district and re-elected in 1884. Re-elected in 1886. Re-elected in 1888. Re-elected in 1890. Re-elected in 1892. Re-elected in 1894. Re-elected in 1896. Re-elected in 1898. Resigned to protest the Spanish–American War. |
1885–1893 [data missing] |
| 1893–1903 [data missing] | |||||
| Vacant | September 4, 1899 – November 6, 1899 |
56th | |||
.jpg.webp) Amos L. Allen (Alfred) |
Republican | November 6, 1899 – February 20, 1911 |
56th 57th 58th 59th 60th 61st |
Elected to finish Reed's term. Re-elected in 1900. Re-elected in 1902. Re-elected in 1904. Re-elected in 1906. Re-elected in 1908. Retired but died before next term. | |
| 1903–1913 [data missing] | |||||
 Asher C. Hinds (Portland) |
Republican | March 4, 1911 – March 3, 1917 |
62nd 63rd 64th |
Elected in 1910. Re-elected in 1912. Re-elected in 1914. Retired. | |
| 1913–1933 [data missing] | |||||
 Louis B. Goodall (Sanford) |
Republican | March 4, 1917 – March 3, 1921 |
65th 66th |
Elected in 1916. Re-elected in 1918. Retired. | |
 Carroll L. Beedy (Portland) |
Republican | March 4, 1921 – January 3, 1935 |
67th 68th 69th 70th 71st 72nd 73rd |
Elected in 1920. Re-elected in 1922. Re-elected in 1924. Re-elected in 1926. Re-elected in 1928. Re-elected in 1930. Re-elected in 1932. Lost re-election. | |
| 1933–1943 [data missing] | |||||
.jpg.webp) Simon M. Hamlin (South Portland) |
Democratic | January 3, 1935 – January 3, 1937 |
74th | Elected in 1934. Lost re-election. | |
.jpg.webp) James C. Oliver (South Portland) |
Republican | January 3, 1937 – January 3, 1943 |
75th 76th 77th |
Elected in 1936. Re-elected in 1938. Re-elected in 1940. Lost renomination. | |
.jpg.webp) Robert Hale (Portland) |
Republican | January 3, 1943 – January 3, 1959 |
78th 79th 80th 81st 82nd 83rd 84th 85th |
Elected in 1942. Re-elected in 1944. Re-elected in 1946. Re-elected in 1948. Re-elected in 1950. Re-elected in 1952. Re-elected in 1954. Re-elected in 1956. Lost re-election. |
1943–1953 [data missing] |
| 1953–1963 [data missing] | |||||
James C. Oliver (South Portland) |
Democratic | January 3, 1959 – January 3, 1961 |
86th | Elected in 1958. Lost re-election. | |
.jpg.webp) Peter Garland (Saco) |
Republican | January 3, 1961 – January 3, 1963 |
87th | Elected in 1960. Lost renomination. | |
.jpg.webp) Stanley R. Tupper (Boothbay Harbor) |
Republican | January 3, 1963 – January 3, 1967 |
88th 89th |
Redistricted from the 2nd district and re-elected in 1962. Re-elected in 1964. Retired. |
1963–1973 [data missing] |
 Peter Kyros (Portland) |
Democratic | January 3, 1967 – January 3, 1975 |
90th 91st 92nd 93rd |
Elected in 1966. Re-elected in 1968. Re-elected in 1970. Re-elected in 1972. Lost re-election. | |
| 1973–1983 [data missing] | |||||
 David F. Emery (Rockland) |
Republican | January 3, 1975 – January 3, 1983 |
94th 95th 96th 97th |
Elected in 1974. Re-elected in 1976. Re-elected in 1978. Re-elected in 1980. Retired to run for U.S. Senator. | |
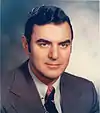
.jpg.webp) John R. McKernan Jr. (Cumberland) |
Republican | January 3, 1983 – January 3, 1987 |
98th 99th |
Elected in 1982. Re-elected in 1984. Retired to run for governor. |
1983–1993 [data missing] |
 Joseph E. Brennan (Portland) |
Democratic | January 3, 1987[lower-alpha 1] – January 3, 1991 |
100th 101st |
Elected in 1986.[lower-alpha 1] Re-elected in 1988. Retired to run for governor. | |
 Thomas Andrews (Portland) |
Democratic | January 3, 1991 – January 3, 1995 |
102nd 103rd |
Elected in 1990. Re-elected in 1992. Retired to run for U.S. Senator. | |
| 1993–2003 [data missing] | |||||
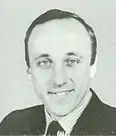
 James B. Longley Jr. (Falmouth) |
Republican | January 3, 1995 – January 3, 1997 |
104th | Elected in 1994. Lost re-election. | |
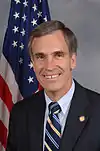 Tom Allen (Portland) |
Democratic | January 3, 1997 – January 3, 2009 |
105th 106th 107th 108th 109th 110th |
Elected in 1996. Re-elected in 1998. Re-elected in 2000. Re-elected in 2002. Re-elected in 2004. Re-elected in 2006. Retired to run for U.S. Senator. | |
2003–2013 | |||||
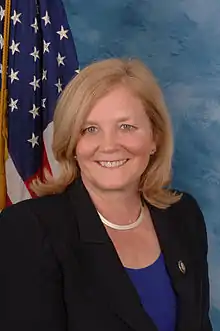 Chellie Pingree (North Haven) |
Democratic | January 3, 2009 – present |
111th 112th 113th 114th 115th 116th 117th 118th. |
Elected in 2008. Re-elected in 2010. Re-elected in 2012. Re-elected in 2014. Re-elected in 2016. Re-elected in 2018. Re-elected in 2020. Re-elected in 2022. | |
2013–2023.tif.png.webp) | |||||
| since 2023 | |||||
Election history
| Party | Candidate | Votes | % | |||
|---|---|---|---|---|---|---|
| Democratic | Joseph E. Brennan | 121,848 | 53.16% | |||
| Republican | H. Rollin Ives | 100,260 | 43.74% | |||
| Labor for Maine | Plato Truman | 7,109 | 3.10% | |||
| Majority | 21,588 | 9.42% | ||||
| Turnout | 229,217 | |||||
| Democratic gain from Republican | ||||||
| Party | Candidate | Votes | % | |
|---|---|---|---|---|
| Democratic | Joseph E. Brennan (Incumbent) | 167,623 | 60.11% | |
| Republican | Edward S. O'Meara | 111,125 | 36.78% | |
| Majority | 79,864 | 26.44% | ||
| Turnout | 278,748 | |||
| Democratic hold | ||||
| Party | Candidate | Votes | % | |
|---|---|---|---|---|
| Democratic | Thomas H. Andrews | 167,623 | 60.11% | |
| Republican | David Emery | 110,836 | 39.74% | |
| write-ins | 413 | 0.15% | ||
| Majority | 56,787 | 20.36% | ||
| Turnout | 278,872 | |||
| Democratic hold | ||||
| Party | Candidate | Votes | % | |
|---|---|---|---|---|
| Democratic | Thomas H. Andrews (Incumbent) | 232,696 | 64.97% | |
| Republican | Linda Bean | 125,236 | 34.97% | |
| write-ins | 216 | 0.06% | ||
| Majority | 107,460 | 30.00% | ||
| Turnout | 358,148 | |||
| Democratic hold | ||||
| Party | Candidate | Votes | % | |||
|---|---|---|---|---|---|---|
| Republican | James B. Longley Jr. | 136,316 | 51.88% | |||
| Democratic | Dennis L. Dutremble | 126,373 | 48.09% | |||
| write-ins | 80 | 0.03% | ||||
| Majority | 9,943 | 3.78% | ||||
| Turnout | 262,769 | |||||
| Republican gain from Democratic | ||||||
| Party | Candidate | Votes | % | |||
|---|---|---|---|---|---|---|
| Democratic | Thomas H. Allen | 173,745 | 55.30% | |||
| Republican | James B. Longley Jr. (Incumbent) | 140,354 | 44.68% | |||
| write-ins | 65 | 0.02% | ||||
| Majority | 33,391 | 10.63% | ||||
| Turnout | 314,164 | |||||
| Democratic gain from Republican | ||||||
| Party | Candidate | Votes | % | |
|---|---|---|---|---|
| Democratic | Thomas H. Allen (Incumbent) | 134,335 | 60.33% | |
| Republican | Ross J. Connelly | 79,160 | 35.55% | |
| Constitution | Eric R. Greiner | 9,182 | 4.12% | |
| Majority | 55,175 | 24.78% | ||
| Turnout | 222,677 | |||
| Democratic hold | ||||
| Party | Candidate | Votes | % | |
|---|---|---|---|---|
| Democratic | Thomas H. Allen (Incumbent) | 202,823 | 59.81% | |
| Republican | Jane A. Amero | 123,915 | 36.54% | |
| Libertarian | J. Frederic Staples | 12,356 | 3.64% | |
| Majority | 78,908 | 23.27% | ||
| Turnout | 339,094 | |||
| Democratic hold | ||||
| Party | Candidate | Votes | % | |
|---|---|---|---|---|
| Democratic | Tom Allen (Incumbent) | 172,646 | 63.81% | |
| Republican | Steven Joyce | 97,931 | 36.19% | |
| Total votes | 270,577 | 100.00% | ||
| Democratic hold | ||||
| Party | Candidate | Votes | % | |
|---|---|---|---|---|
| Democratic | Tom Allen (Incumbent) | 219,077 | 59.74% | |
| Republican | Charles E. Summers | 147,663 | 40.26% | |
| Total votes | 366,740 | 100.00% | ||
| Democratic hold | ||||
| Party | Candidate | Votes | % | |
|---|---|---|---|---|
| Democratic | Tom Allen (Incumbent) | 170,949 | 60.84% | |
| Republican | Darlene J. Curley | 88,009 | 31.32% | |
| Independent | Dexter Kamilewicz | 22,029 | 7.84% | |
| Total votes | 280,987 | 100.00% | ||
| Democratic hold | ||||
| Party | Candidate | Votes | % | |
|---|---|---|---|---|
| Democratic | Chellie Pingree | 205,629 | 54.90% | |
| Republican | Charles E. Summers | 168,930 | 45.10% | |
| Total votes | 374,559 | 100.00% | ||
| Democratic hold | ||||
| Party | Candidate | Votes | % | |
|---|---|---|---|---|
| Democratic | Chellie Pingree (Incumbent) | 169,114 | 56.82% | |
| Republican | Dean Scontras | 128,501 | 43.17% | |
| No party | Others | 42 | 0.01% | |
| Total votes | 297,657 | 100.00% | ||
| Democratic hold | ||||
| Party | Candidate | Votes | % | |
|---|---|---|---|---|
| Democratic | Chellie Pingree (Incumbent) | 236,363 | 64.8 | |
| Republican | Jonathan T. E. Courtney | 128,440 | 35.1% | |
| Total votes | 364,803 | 100.0% | ||
| Democratic hold | ||||
| Party | Candidate | Votes | % | |
|---|---|---|---|---|
| Democratic | Chellie Pingree (Incumbent) | 186,674 | 60.43% | |
| Republican | Isaac J. Misiuk | 94,751 | 30.67% | |
| Independent | Richard P. Murphy | 27,410 | 8.87% | |
| Others | 63 | 0.02% | ||
| Total votes | 308,898 | 100% | ||
| Democratic hold | ||||
| Party | Candidate | Votes | % | |
|---|---|---|---|---|
| Democratic | Chellie Pingree (Incumbent) | 227,546 | 57.99% | |
| Republican | Mark Holbrook | 164,569 | 41.94% | |
| Libertarian | James J. Bouchard (Declared Write-In) | 276 | 0.07% | |
| Blank ballots | 14,551 | N/A | ||
| Total votes | 406,942 | 100% | ||
| Democratic hold | ||||
The 2018 election was the first to use ranked-choice voting as opposed to plurality voting since the district's creation. However, since the leading candidate had a majority of first-choice votes, no distribution of preferences was conducted.
| Party | Candidate | Votes | % | |
|---|---|---|---|---|
| Democratic | Chellie Pingree (Incumbent) | 201,195 | 58.8% | |
| Republican | Mark Holbrook | 111,188 | 32.5% | |
| Independent | Marty Grohman | 29,670 | 8.7% | |
| Total votes | 342,053 | 100% | ||
| Democratic hold | ||||
| Party | Candidate | Votes | % | |
|---|---|---|---|---|
| Democratic | Chellie Pingree (Incumbent) | 271,004 | 62.2% | |
| Republican | Jay Allen | 165,008 | 37.8% | |
| Write-in | 15 | 0.0% | ||
| Total votes | 436,027 | 100% | ||
| Democratic hold | ||||
| Party | Candidate | Votes | % | |
|---|---|---|---|---|
| Democratic | Chellie Pingree (incumbent) | 218,630 | 62.8 | |
| Republican | Ed Thelander | 128,996 | 37.1 | |
| Write-in | 362 | 0.1 | ||
| Total votes | 347,988 | 100 | ||
| Democratic hold | ||||
Notes
- The service of member-elect Joseph E. Brennan began January 3, 1987[4] even though he was sworn in January 9, 1987[5] to finish his term as the outgoing Governor of Maine.
References
- "My Congressional District".
- "2022 Cook PVI: District Map and List". Cook Political Report. Retrieved January 10, 2023.
- 2016 Election Results The Press Herald
- "Bioguide Search".
- Congressional record, 1987
- "Bureau of Corporations, Elections & Commissions, Elections Division". Main Bureau of Corporations, Elections & Commission, Elections. Archived from the original on August 1, 2012. Retrieved March 30, 2012.
- "Maine General Election 2014". Maine Secretary of State. November 4, 2014. Retrieved December 19, 2014.
- "Tabulations for Elections held in 2016". Maine Secretary of State. Retrieved December 12, 2016.
- "Maine's 1st Congressional District election, 2018 Maine's 1st Congressional District election". Ballotpedia. Retrieved November 21, 2018.
Bibliography
- Martis, Kenneth C. (1989). The Historical Atlas of Political Parties in the United States Congress. New York: Macmillan Publishing Company.
- Martis, Kenneth C. (1982). The Historical Atlas of United States Congressional Districts. New York: Macmillan Publishing Company.
- Congressional Biographical Directory of the United States 1774–present
External links
Augusta (capital) | |
| Topics |
|
| Society | |
| Regions |
|
| Counties | |
| Cities | |
| Largest towns | |