Maryland's 5th congressional district
Maryland's 5th congressional district comprises all of Charles, St. Mary's, and Calvert counties, as well as portions of Prince George's and Anne Arundel counties. The district is currently represented by Democrat Steny Hoyer, who from 2007 to 2011 and from 2019 to 2023 was House Majority Leader.
| Maryland's 5th congressional district | |||
|---|---|---|---|
Interactive map of district boundaries since January 3, 2023 | |||
| Representative |
| ||
| Area | 1,504.25 sq mi (3,896.0 km2) | ||
| Distribution |
| ||
| Population (2022) | 789,972 | ||
| Median household income | $121,284[1] | ||
| Ethnicity |
| ||
| Occupation |
| ||
| Cook PVI | D+15[2] | ||
.svg.png.webp)
When it was defined in 1788, the 5th Congressional District centered on Salisbury, Maryland. It consisted of the current Maryland counties of Caroline, Dorchester, Wicomico, Somerset, and Worcester. In 1792 the boundaries of Maryland's congressional districts were redrawn, and the 5th District was made to include Baltimore and Baltimore County.
Recent statewide election results
| Year | Results |
|---|---|
| 2000 | Gore 57% – 41% |
| 2004 | Kerry 57% – 42% |
| 2008 | Obama 65% – 33% |
| 2012 | Obama 66% – 32% |
| 2016 | Clinton 63% – 32% |
| 2020 | Biden 69% – 30% |
Recent elections
2000s
| Party | Candidate | Votes | % | |
|---|---|---|---|---|
| Democratic | Steny Hoyer (inc.) | 166,231 | 65.09 | |
| Republican | Thomas E. Hutchins | 89,109 | 34.89 | |
| Write-in | 125 | 0.05 | ||
| Total votes | 255,375 | 100.00 | ||
| Democratic hold | ||||
| Party | Candidate | Votes | % | |
|---|---|---|---|---|
| Democratic | Steny Hoyer (inc.) | 137,903 | 69.36 | |
| Republican | Joseph T. Crawford | 60,758 | 30.56 | |
| Green | Bob S. Auerbach (write-in) | 158 | 0.08 | |
| Total votes | 198,819 | 100.00 | ||
| Democratic hold | ||||
| Party | Candidate | Votes | % | ±% | |
|---|---|---|---|---|---|
| Democratic | Steny Hoyer (inc.) | 204,867 | 68.72% | -0.64 | |
| Republican | Brad Jewitt | 87,189 | 29.25% | -1.31 | |
| Green | Bob S. Auerbach | 4,224 | 1.42% | +1.34 | |
| Constitution | Steve Krukar | 1,849 | 0.62% | +0.62 | |
| Total votes | 298,129 | 100.00 | |||
| Democratic hold | |||||
| Party | Candidate | Votes | % | ±% | |
|---|---|---|---|---|---|
| Democratic | Steny Hoyer (inc.) | 168,114 | 82.68% | +13.96 | |
| Green | Steve Warner | 33,464 | 16.46% | +15.04 | |
| Constitution | Peter Kuhnert | 635 | 0.31% | -0.31 | |
| Write-in | 1,110 | 0.55% | +0.55 | ||
| Total votes | 203,323 | 100.00 | |||
| Democratic hold | |||||
| Party | Candidate | Votes | % | ±% | |
|---|---|---|---|---|---|
| Democratic | Steny Hoyer (inc.) | 253,854 | 73.65% | -9.03 | |
| Republican | Collins Bailey | 82,631 | 23.97% | +23.97 | |
| Libertarian | Darlene H. Nicolas | 7,829 | 2.27% | +2.27 | |
| Write-in | 377 | 0.11 | -0.44 | ||
| Total votes | 344,691 | 100.00 | |||
| Democratic hold | Swing | ||||
2010s
| Party | Candidate | Votes | % | ±% | |
|---|---|---|---|---|---|
| Democratic | Steny Hoyer (inc.) | 155,110 | 64.26% | -9.39 | |
| Republican | Charles Lollar | 83,575 | 34.62% | +10.65 | |
| Libertarian | H Gavin Shickle | 2,578 | 1.07% | -1.20 | |
| Write-in | 120 | 0.05% | -0.06 | ||
| Total votes | 241,383 | 100.00 | |||
| Democratic hold | |||||
| Party | Candidate | Votes | % | |
|---|---|---|---|---|
| Democratic | Steny H. Hoyer (inc.) | 238,618 | 69.4 | |
| Republican | Tony O'Donnell | 95,271 | 27.7 | |
| Green | Bob Auerbach | 5,040 | 1.5 | |
| Libertarian | Arvin Vohra | 4,503 | 1.3 | |
| Write-in | 388 | 0.1 | ||
| Total votes | 343,820 | 100 | ||
| Democratic hold | ||||
| Party | Candidate | Votes | % | |
|---|---|---|---|---|
| Democratic | Steny H. Hoyer (inc.) | 144,725 | 64 | |
| Republican | Chris Chaffee | 80,752 | 35.7 | |
| N/A | Others | 563 | .3 | |
| Total votes | 226,040 | 100 | ||
| Democratic hold | ||||
| Party | Candidate | Votes | % | |
|---|---|---|---|---|
| Democratic | Steny H. Hoyer (inc.) | 242,989 | 67.4 | |
| Republican | Mark Arness | 105,931 | 29.4 | |
| Libertarian | Jason Summers | 11,078 | 3.1 | |
| Write-in | 636 | 0.2 | ||
| Total votes | 360,634 | 100 | ||
| Democratic hold | ||||
| Party | Candidate | Votes | % | |
|---|---|---|---|---|
| Democratic | Steny Hoyer (incumbent) | 213,796 | 70.3 | |
| Republican | William Devine III | 82,361 | 27.1 | |
| Green | Patrick Elder | 4,082 | 1.3 | |
| Libertarian | Jacob Pulcher | 3,592 | 1.2 | |
| Write-in | 279 | 0.1 | ||
| Republican | Johnny Rice (write-in) | 99 | 0.0 | |
| Total votes | 304,479 | 100 | ||
| Democratic hold | ||||
2020s
| Party | Candidate | Votes | % | |
|---|---|---|---|---|
| Democratic | Steny Hoyer (incumbent) | 274,210 | 68.8 | |
| Republican | Chris Palombi | 123,525 | 31.0 | |
| Write-in | 1,104 | 0.3 | ||
| Total votes | 398,839 | 100 | ||
| Democratic hold | ||||
| Party | Candidate | Votes | % | |
|---|---|---|---|---|
| Democratic | Steny Hoyer (incumbent) | 182,478 | 65.9 | |
| Republican | Chris Palombi | 94,000 | 33.9 | |
| Write-in | 442 | 0.2 | ||
| Total votes | 276,920 | 100 | ||
| Democratic hold | ||||
List of members representing the district
1789–1803: one seat
| Name | Years | Cong ress |
Party | Electoral history |
|---|---|---|---|---|
| District created March 4, 1789 | ||||
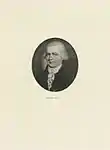 George Gale (Somerset County) |
March 4, 1789 – March 3, 1791 |
1st | Pro-Administration | Elected in 1789. Lost re-election. |
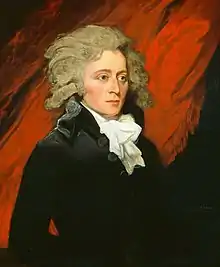 William Vans Murray (Cambridge) |
March 4, 1791 – March 3, 1793 |
2nd | Pro-Administration | Elected in 1790. Redistricted to the 8th district. |
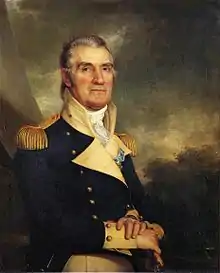 Samuel Smith (Baltimore) |
March 4, 1793 – March 3, 1803 |
3rd 4th 5th 6th 7th |
Democratic-Republican | Elected in 1792. Re-elected in 1794. Re-elected in 1796. Re-elected in 1798. Re-elected in 1801. Retired to run for U.S. Senate. |
1803–1833: two seats
From 1803 to 1833, two seats were apportioned, elected at-large on a general ticket.
| Con- gress |
Years | Seat A | Seat B | |||||
|---|---|---|---|---|---|---|---|---|
| Member | Party | Electoral history | Member | Party | Electoral history | |||
| 8th | March 4, 1803 – March 3, 1805 |
Nicholas R. Moore (Ruxton) |
Democratic-Republican | Elected in 1803. Re-elected in 1804. Re-elected in 1806. Re-elected in 1808. Lost re-election. |
William McCreery (Reistertown) |
Democratic-Republican | Elected in 1803. Re-elected in 1804. Re-elected in 1806. Retired. | |
| 9th | March 4, 1805 – March 3, 1807 | |||||||
| 10th | March 4, 1807 – March 3, 1809 | |||||||
| 11th | March 4, 1809 – March 3, 1811 |
Alexander McKim (Baltimore) |
Democratic-Republican | Elected in 1808. Re-elected in 1810. Re-elected in 1812. Retired. | ||||
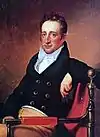
| 12th | March 4, 1811 – March 3, 1813 |
Peter Little (Baltimore) |
Democratic-Republican | Elected in 1810. Lost re-election. | ||||
| 13th | March 4, 1813 – March 3, 1815 |
Nicholas R. Moore (Ruxton) |
Democratic-Republican | Elected in 1812. Re-elected in 1814. Resigned. | ||||
| 14th | March 4, 1815 – ????, 1815 |
.jpg.webp) William Pinkney (Baltimore) |
Democratic-Republican | Elected in 1814. Resigned to become U.S. Minister Plenipotentiary to Russia. | ||||
| ???, 1815 – February 4, 1816 |
Vacant | |||||||
| February 4, 1816 – April 18, 1816 |
Samuel Smith (Baltimore) |
Democratic-Republican | Elected January 27, 1816 to finish Moore's term and seated February 4, 1816. Re-elected later in 1816. Re-elected in 1818. Re-elected in 1820. Re-elected in 1822, but resigned when elected U.S. Senator. | |||||
| April 18, 1816 – December 2, 1816 |
Vacant | |||||||
| December 2, 1816 – March 3, 1817 |
Peter Little (Freedom) |
Democratic-Republican[lower-alpha 1] | Elected September 3, 1816 to finish Pinkney's term and seated December 2, 1816. Re-elected later in 1816. Re-elected in 1818. Re-elected in 1820. Re-elected in 1822. Re-elected in 1824. Re-elected in 1826. Lost re-election. | |||||
| 15th | March 4, 1817 – March 3, 1819 | |||||||
| 16th | March 4, 1819 – March 3, 1821 | |||||||
| 17th | March 4, 1821 – December 17, 1822 | |||||||
| December 17, 1822 – January 4, 1823 |
Vacant | |||||||
| January 4, 1823 – March 3, 1823 |
 Isaac McKim (Baltimore) |
Democratic-Republican[lower-alpha 1] | Elected to finish Smith's term and seated January 8, 1823. Also elected to finish Smith's term in the next Congress. Lost re-election. | |||||
| 18th | March 4, 1823 – March 3, 1825 | |||||||
| 19th | March 4, 1825 – March 3, 1827 |
John Barney (Baltimore) |
Anti-Jacksonian | Elected in 1824. Re-elected in 1826. Lost re-election. |
Anti-Jacksonian | |||
| 20th | March 4, 1827 – March 3, 1829 | |||||||
| 21st | March 4, 1829 – March 3, 1831 |
Elias Brown (Freedom) |
Jacksonian | Elected in 1829. Lost re-election. |
 Benjamin C. Howard (Baltimore) |
Jacksonian | Elected in 1829. Re-elected in 1831. [data missing] | |
| 22nd | March 4, 1831 – March 3, 1833 |
John T. H. Worthington (Golden) |
Jacksonian | Elected in 1831. [data missing] | ||||
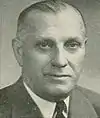
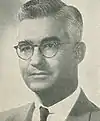
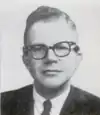
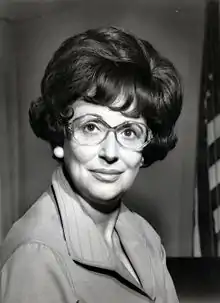
1833–present: one seat
.jpg.webp)

.jpg.webp)

.jpg.webp)

.jpg.webp)
.jpg.webp)
.jpg.webp)


.jpg.webp)


.tif.png.webp)
Notes
- Supported the Jackson faction in the 1824 United States presidential election
Sources
- "My Congressional District".
- "2022 Cook PVI: District Map and List". The Cook Political Report. July 12, 2022. Retrieved October 8, 2022.
- "Unofficial 2012 Presidential General Election results for Representative in Congress". Maryland State Board of Elections. Retrieved November 12, 2012.
- "Official 2020 Presidential General Election results for Representative in Congress". Maryland State Board of Elections. Retrieved December 14, 2020.
- Archives of Maryland Historical List United States Representatives Maryland State Archives
- Martis, Kenneth C. (1989). The Historical Atlas of Political Parties in the United States Congress. New York: Macmillan Publishing Company.
- Martis, Kenneth C. (1982). The Historical Atlas of United States Congressional Districts. New York: Macmillan Publishing Company.
- Congressional Biographical Directory of the United States 1774–present
This article is issued from Wikipedia. The text is licensed under Creative Commons - Attribution - Sharealike. Additional terms may apply for the media files.