Maryland's 6th congressional district
Maryland's 6th congressional district elects a representative to the United States House of Representatives from the northwest part of the state. The district comprises all of Garrett, Allegany, Frederick, and Washington counties as well as a portion of Montgomery County. David Trone (D) is its current representative.[3]
| Maryland's 6th congressional district | |||
|---|---|---|---|
Interactive map of district boundaries since January 3, 2023 | |||
| Representative |
| ||
| Area | 3,062.27 sq mi (7,931.2 km2) | ||
| Distribution |
| ||
| Population (2022) | 792,577 | ||
| Median household income | $96,041[1] | ||
| Ethnicity |
| ||
| Cook PVI | D+2[2] | ||
The previous boundaries of the district were the subject of a Supreme Court lawsuit over partisan gerrymandering. The court ruled that taking into account partisan advantage when redistributing is "not judiciable" in federal courts, leaving it to the states.[4] In 2012, the district was found to be the ninth least compact congressional district in the United States.[5]
John Delaney, who represented the district after unseating 11-term incumbent republican Roscoe Bartlett, gave up the seat in 2018 to focus on his bid for president and was succeeded by fellow Democrat David Trone, who won re-election in 2020 as well. However, after redistricting in 2022, the district became much more competitive, giving up a portion of heavily Democratic Montgomery County in exchange for a more Republican-leaning portion of Frederick County. The district leans just slightly Democratic, with the heavily conservative, white, and rural regions of Western Maryland being balanced out by politically competitive Frederick County and heavily Democratic and culturally diverse suburbs in Montgomery County such as Gaithersburg and Germantown.[6] Nevertheless, Trone was re-elected by nearly 10 points over Maryland House of Delegates member Neil Parrott.
History
The Maryland 6th District was one of the original districts that had a congressman starting in 1789. At that time, the district essentially had what remained its modern boundaries, consisting of the Maryland panhandle and areas eastward, all the way to the modern western boundary of the District of Columbia. However, after the 1790 census Maryland's representation increased to 8 congressmen. (Women would not be elected to Congress until 1916.) The new sixth district was in the north-east corner of the state east of Baltimore, covering essentially the modern counties of Harford, Cecil and Kent.[7]
For most of the time from 1873 to 2013, the 6th was a mostly rural district anchored in western Maryland. It was in Republican hands for all but one term from 1943 to 1971, before conservative Democrat Goodloe Byron won it in 1971. He died in 1978 and was succeeded by his widow, Beverly, who held it for seven terms before being ousted by a more liberal challenger in the 1992 Democratic primary. Republican Roscoe Bartlett won the general election, and was reelected without serious challenge nine more times.
However, redistricting after the 2010 census significantly altered the 6th. It lost much of heavily Republican Carroll County, as well as the more rural and conservative portions of Frederick County, to the heavily Democratic 8th District. It also lost its shares of Baltimore and Harford counties, as well as another portion of Carroll, to the already heavily Republican 1st District. Taking their place was a heavily Democratic spur of western Montgomery County, which was only connected to the rest of the district by a tendril in Frederick County.
The new map turned the 6th from a heavily Republican district into a Democratic-leaning district. While John McCain carried the 6th with 57 percent of the vote in 2008,[8] Barack Obama would have carried the new 6th with 56 percent.[9] This was mainly because the Montgomery County portion had almost three times as many people as the rest of the district combined.
In his bid for an 11th term, Bartlett was defeated by Democrat John Delaney, who lives in the Montgomery County portion of the district, by over 21 points. Proving just how Democratic this district was, in 2014, Delaney narrowly won a second term against Republican Dan Bongino. Delaney only won one county in the district. However, that one county was Montgomery, where Bongino lost by over 20,500 votes.[10]
In 2013, Republican voters filed a federal lawsuit, alleging that the Democratic legislature and Governor Martin O'Malley had engaged in partisan gerrymandering, redrawing the 6th district after the 2010 census in a way that intentionally and unconstitutionally diluted Republican voters by including parts of the heavily Democratic Washington suburbs. A federal district judge initially dismissed the lawsuit, as did the Fourth Circuit Court of Appeals, for failure to state a claim. The Republicans appealed to the Supreme Court, which ruled unanimously in 2015 that the lower courts had improperly dismissed the case. The case went back to the lower courts where a three judge panel ruled that the Republicans could not prove that John Delaney's election in 2012 was a result of the redistricting. Republican voters again appealed to the Supreme Court, which agreed to hear the case, Benisek v. Lamone, in December 2017.[11][12] In June 2019, the Supreme Court ruled that questions of partisan gerrymandering represented a nonjusticiable political question and remanded the case back to the district court with instructions to dismiss the case.
Recent statewide election results
| Year | Office | Results |
|---|---|---|
| 2000 | U.S. President | Bush 61% – 36% |
| 2004 | U.S. President | Bush 65% – 34% |
| 2008 | U.S. President | McCain 58% – 40% |
| 2012 | U.S. President | Obama 55% – 42% |
| 2016 | U.S. President | Clinton 55% – 40% |
| 2020 | U.S. President | Biden 61% – 38% |
List of members representing the district
| Member (Residence) |
Party | Years | Con- gress |
Electoral history | Location |
|---|---|---|---|---|---|
| District created March 4, 1789 | |||||
_(cropped).jpg.webp) Daniel Carroll (Rock Creek) |
Pro-Administration | March 4, 1789 – March 3, 1791 |
1st | Elected in 1789. Lost re-election. |
|
| Upton Sheredine (Liberty) |
Anti-Administration | March 4, 1791 – March 3, 1793 |
2nd | Elected in 1790. [data missing] | |
| Gabriel Christie (Havre de Grace) |
Anti-Administration | March 4, 1793 – March 3, 1795 |
3rd 4th |
Elected in 1792. Re-elected in 1794. Lost re-election. | |
| Democratic-Republican | March 4, 1795 – March 3, 1797 | ||||
| William Matthews (Cecil County) |
Federalist | March 4, 1797 – March 3, 1799 |
5th | Elected in 1796. Retired. | |
| Gabriel Christie (Havre de Grace) |
Democratic-Republican | March 4, 1799 – March 3, 1801 |
6th | Elected in 1798. Retired. | |
 John Archer (Medical Hall) |
Democratic-Republican | March 4, 1801 – March 3, 1807 |
7th 8th 9th |
Re-elected in 1801. Re-elected in 1803. Re-elected in 1804. Lost re-election. | |
| John Montgomery (Bel Air) |
Democratic-Republican | March 4, 1807 – April 29, 1811 |
10th 11th 12th |
Elected in 1806. Re-elected in 1808. Re-elected in 1810. Resigned after appointment as Attorney General of Maryland. | |
| Vacant | April 29, 1811 – October 26, 1811 |
12th | |||
 Stevenson Archer (Bel Air) |
Democratic-Republican | October 26, 1811 – March 3, 1817 |
12th 13th 14th |
Elected to finish Montgomery's term. Re-elected in 1812. Re-elected in 1814. Lost re-election. | |
 Philip Reed (Chestertown) |
Democratic-Republican | March 4, 1817– March 3, 1819 |
15th | Elected in 1816. Lost re-election. | |
Stevenson Archer (Bel Air) |
Democratic-Republican | March 4, 1819– March 3, 1821 |
16th | Elected in 1818. Retired. | |
| Jeremiah Cosden (Elkton) |
Democratic-Republican | March 4, 1821 – March 19, 1822 |
17th | Elected in 1820. Election contested. | |
Philip Reed (Chestertown) |
Democratic-Republican | March 19, 1822 – March 3, 1823 |
Contested 1820 election. Lost re-election. | ||
| George E. Mitchell (Elkton) |
Democratic-Republican[lower-alpha 1] | March 4, 1823 – March 3, 1825 |
18th 19th |
Elected in 1822. Re-elected in 1824. Retired. | |
| Jacksonian | March 4, 1825 – March 3, 1827 | ||||
| Levin Gale (Elkton) |
Jacksonian | March 4, 1827 – March 3, 1829 |
20th | Elected in 1826. Retired. | |
| George E. Mitchell (Elkton) |
Jacksonian | December 7, 1829 – June 28, 1832 |
21st 22nd |
Elected in 1829. Re-elected in 1831. Died. | |
| Vacant | June 28, 1832 – October 1, 1832 |
22nd | |||
| Charles S. Sewall (Elkton) |
Jacksonian | October 1, 1832 – March 3, 1833 |
Elected to finish Mitchell's term. [data missing] | ||
| William C. Johnson (Jefferson) |
Anti-Jacksonian | March 4, 1833 – March 3, 1835 |
23rd | Elected in 1833. Retired. | |
 Francis Thomas (Frederick) |
Jacksonian | March 4, 1835 – March 3, 1837 |
24th 25th 26th |
Redistricted from the 7th district and re-elected in 1835. Re-elected in 1837. Re-elected in 1839. Retired to run for Governor of Maryland. | |
| Democratic | March 4, 1837 – March 3, 1841 | ||||
| John T. Mason Jr. (Hagerstown) |
Democratic | March 4, 1841 – March 3, 1843 |
27th | Elected in 1841. [data missing] | |
| Thomas A. Spence (Snow Hill) |
Whig | March 4, 1843 – March 3, 1845 |
28th | Elected late in 1844. Retired. | |
| Edward H. C. Long (Princess Anne) |
Whig | March 4, 1845 – March 3, 1847 |
29th | Elected in 1845. Retired. | |
 John W. Crisfield (Princess Anne) |
Whig | March 4, 1847 – March 3, 1849 |
30th | Elected in 1847. [data missing] | |
 John B. Kerr (Easton) |
Whig | March 4, 1849 – March 3, 1851 |
31st | Elected in 1849. Retired. | |
| Joseph S. Cottman (Upper Trappe) |
Independent Whig | March 4, 1851 – March 3, 1853 |
32nd | Elected in 1851. Lost re-election. | |
| Augustus R. Sollers (Prince Frederick) |
Whig | March 4, 1853 – March 3, 1855 |
33rd | Elected in 1853. [data missing] | |
 Thomas F. Bowie (Upper Marlboro) |
Democratic | March 4, 1855 – March 3, 1859 |
34th 35th |
Elected in 1855. Re-elected in 1857. Lost re-election. | |
 George W. Hughes (West River) |
Democratic | March 4, 1859 – March 3, 1861 |
36th | Elected in 1859. [data missing] | |
 Charles B. Calvert (Bladensburg) |
Unionist | March 4, 1861 – March 3, 1863 |
37th | Elected in 1861. Retired. | |
| Seat eliminated after the 1860 census. | |||||
| Seat re-created after the 1870 census. | |||||
 Lloyd Lowndes Jr. (Cumberland) |
Republican | March 4, 1873 – March 3, 1875 |
43rd | Elected in 1872. Lost re-election. |
|
 William Walsh (Cumberland) |
Democratic | March 4, 1875 – March 3, 1879 |
44th 45th |
Elected in 1874. Re-elected in 1876. Retired. | |
.jpg.webp) Milton G. Urner (Frederick) |
Republican | March 4, 1879 – March 3, 1883 |
46th 47th |
Elected in 1878. Re-elected in 1880. Retired. | |
 Louis E. McComas (Hagerstown) |
Republican | March 4, 1883 – March 3, 1891 |
48th 49th 50th 51st |
Elected in 1882. Re-elected in 1884. Re-elected in 1886. Re-elected in 1888. Lost re-election. | |
 William M. McKaig (Cumberland) |
Democratic | March 4, 1891 – March 3, 1895 |
52nd 53rd |
Elected in 1890. Re-elected in 1892. Retired. | |
 George Louis Wellington (Cumberland) |
Republican | March 4, 1895 – March 3, 1897 |
54th | Elected in 1894. Retired after election as a U.S. senator. | |
 John McDonald (Rockville) |
Republican | March 4, 1897 – March 3, 1899 |
55th | Elected in 1896. [data missing] | |
 George A. Pearre (Cumberland) |
Republican | March 4, 1899 – March 3, 1911 |
56th 57th 58th 59th 60th 61st |
Elected in 1898. Re-elected in 1900. Re-elected in 1902. Re-elected in 1904. Re-elected in 1906. Re-elected in 1908. Retired. | |
 David J. Lewis (Cumberland) |
Democratic | March 4, 1911 – March 3, 1917 |
62nd 63rd 64th |
Elected in 1910. Re-elected in 1912. Re-elected in 1914. Retired. | |
 Frederick N. Zihlman (Cumberland) |
Republican | March 4, 1917 – March 3, 1931 |
65th 66th 67th 68th 69th 70th 71st |
Elected in 1916. Re-elected in 1918. Re-elected in 1920. Re-elected in 1922. Re-elected in 1924. Re-elected in 1926. Re-elected in 1928. Lost re-election. | |
David J. Lewis (Cumberland) |
Democratic | March 4, 1931 – January 3, 1939 |
72nd 73rd 74th 75th |
Elected in 1930. Re-elected in 1932. Re-elected in 1934. Re-elected in 1936. Retired. | |
.jpg.webp) William D. Byron (Williamsport) |
Democratic | January 3, 1939 – February 27, 1941 |
76th 77th |
Elected in 1938. Re-elected in 1940. Died. | |
| Vacant | February 27, 1941 – May 27, 1941 |
77th | |||
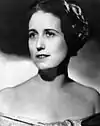 Katharine Byron (Williamsport) |
Democratic | May 27, 1941 – January 3, 1943 |
Elected to finish her husband's term (see Widow's succession). Retired. | ||
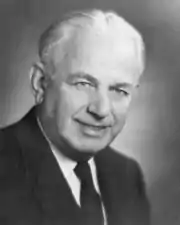 James G. Beall (Frostburg) |
Republican | January 3, 1943 – January 3, 1953 |
78th 79th 80th 81st 82nd |
Elected in 1942. Re-elected in 1944. Re-elected in 1946. Re-elected in 1948. Re-elected in 1950. Retired after election as a U.S. senator. | |
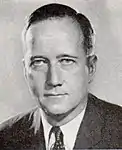
.jpg.webp) DeWitt S. Hyde (Bethesda) |
Republican | January 3, 1953 – January 3, 1959 |
83rd 84th 85th |
Elected in 1952. Re-elected in 1954. Re-elected in 1956. Lost re-election. | |
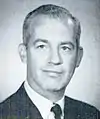
.jpg.webp) John R. Foley (Kensington) |
Democratic | January 3, 1959 – January 3, 1961 |
86th | Elected in 1958. Lost re-election. | |
 Charles M. Mathias Jr. (Frederick) |
Republican | January 3, 1961 – January 3, 1969 |
87th 88th 89th 90th |
Elected in 1960. Re-elected in 1962. Re-elected in 1964. Re-elected in 1966. Retired to run for U.S. Senator. | |
 John G. Beall Jr. (Frostburg) |
Republican | January 3, 1969 – January 3, 1971 |
91st | Elected in 1968. Retired to run for U.S. Senator. | |
 Goodloe E. Byron (Frederick) |
Democratic | January 3, 1971 – October 11, 1978 |
92nd 93rd 94th 95th |
Elected in 1970. Re-elected in 1972. Re-elected in 1974. Re-elected in 1976. Died. | |
 Beverly Byron (Frederick) |
Democratic | January 3, 1979 – January 3, 1993 |
96th 97th 98th 99th 100th 101st 102nd |
Elected in 1978. Re-elected in 1980. Re-elected in 1982. Re-elected in 1984. Re-elected in 1986. Re-elected in 1988. Re-elected in 1990. Lost renomination. | |
 Roscoe Bartlett (Frederick) |
Republican | January 3, 1993 – January 3, 2013 |
103rd 104th 105th 106th 107th 108th 109th 110th 111th 112th |
Elected in 1992. Re-elected in 1994. Re-elected in 1996. Re-elected in 1998. Re-elected in 2000. Re-elected in 2002. Re-elected in 2004. Re-elected in 2006. Re-elected in 2008. Re-elected in 2010. Lost re-election after redistricting. |
1993–2003 [data missing] |
2003–2013 | |||||
 John Delaney (Potomac) |
Democratic | January 3, 2013 – January 3, 2019 |
113th 114th 115th |
Elected in 2012. Re-elected in 2014. Re-elected in 2016. Retired to run for U.S. President. |
2013–2023.tif.png.webp) |
 David Trone (Potomac) |
Democratic | January 3, 2019 – present |
116th 117th 118th |
Elected in 2018. Re-elected in 2020. Re-elected in 2022. Retiring at end of term to run for U.S. senator. | |
2023–present.svg.png.webp) | |||||
Recent election results
1990s
| Party | Candidate | Votes | % | |
|---|---|---|---|---|
| Democratic | Beverly B. Byron (Incumbent) | 106,502 | 65.35 | |
| Republican | Christopher P. Fiotes, Jr. | 56,479 | 34.65 | |
| Total votes | 162,981 | 100.00 | ||
| Democratic hold | ||||
| Party | Candidate | Votes | % | |||
|---|---|---|---|---|---|---|
| Republican | Roscoe Bartlett | 125,564 | 54.17 | |||
| Democratic | Thomas H. Hattery | 106,224 | 45.83 | |||
| Total votes | 231,788 | 100.00 | ||||
| Republican gain from Democratic | ||||||
| Party | Candidate | Votes | % | |
|---|---|---|---|---|
| Republican | Roscoe Bartlett (Incumbent) | 122,809 | 65.95 | |
| Democratic | Paul Muldowney | 63,411 | 34.05 | |
| Total votes | 186,220 | 100.00 | ||
| Republican hold | ||||
| Party | Candidate | Votes | % | |
|---|---|---|---|---|
| Republican | Roscoe Bartlett (Incumbent) | 132,853 | 56.83 | |
| Democratic | Stephen Crawford | 100,910 | 43.16 | |
| Write-ins | 25 | 0.01 | ||
| Total votes | 233,788 | 100.00 | ||
| Republican hold | ||||
| Party | Candidate | Votes | % | |
|---|---|---|---|---|
| Republican | Roscoe Bartlett (Incumbent) | 127,802 | 63.42 | |
| Democratic | Timothy D. McCown | 73,728 | 36.58 | |
| Total votes | 201,530 | 100.00 | ||
| Republican hold | ||||
2000s
| Party | Candidate | Votes | % | |
|---|---|---|---|---|
| Republican | Roscoe Bartlett (Incumbent) | 168,624 | 60.65 | |
| Democratic | Donald M. DeArmon | 109,136 | 39.25 | |
| Write-ins | 285 | 0.10 | ||
| Total votes | 278,045 | 100.00 | ||
| Republican hold | ||||
| Party | Candidate | Votes | % | |
|---|---|---|---|---|
| Republican | Roscoe Bartlett (Incumbent) | 147,825 | 66.17 | |
| Democratic | Donald M. DeArmon | 75,575 | 33.83 | |
| Total votes | 223,400 | 100.00 | ||
| Republican hold | ||||
| Party | Candidate | Votes | % | |
|---|---|---|---|---|
| Republican | Roscoe Bartlett (Incumbent) | 206,076 | 67.45 | |
| Democratic | Kenneth T. Bosley | 90,108 | 29.49 | |
| Green | Gregory T. Hemingway | 9,324 | 3.05 | |
| Total votes | 305,508 | 100.00 | ||
| Republican hold | ||||
| Party | Candidate | Votes | % | |
|---|---|---|---|---|
| Republican | Roscoe Bartlett (Incumbent) | 141,200 | 58.97 | |
| Democratic | Andrew J. Duck | 92,030 | 38.43 | |
| Green | Robert E. Kozak | 6,095 | 2.55 | |
| Write-ins | 128 | 0.05 | ||
| Total votes | 239,453 | 100.00 | ||
| Republican hold | ||||
| Party | Candidate | Votes | % | |
|---|---|---|---|---|
| Republican | Roscoe Bartlett (Incumbent) | 190,926 | 57.76 | |
| Democratic | Jennifer Dougherty | 128,207 | 38.79 | |
| Libertarian | Gary W. Hoover, Sr. | 11,060 | 3.35 | |
| Write-ins | 342 | 0.10 | ||
| Total votes | 330,535 | 100.00 | ||
| Republican hold | ||||
2010s
| Party | Candidate | Votes | % | |
|---|---|---|---|---|
| Republican | Roscoe Bartlett (Incumbent) | 148,820 | 61.45 | |
| Democratic | Andrew J. Duck | 80,455 | 33.22 | |
| Libertarian | Dan Massey | 6,816 | 2.81 | |
| Constitution | Michael Reed | 5,907 | 2.44 | |
| Write-ins | 191 | 0.08 | ||
| Total votes | 242,189 | 100.00 | ||
| Republican hold | ||||
| Party | Candidate | Votes | % | |||
|---|---|---|---|---|---|---|
| Democratic | John Delaney | 181,921 | 58.8 | |||
| Republican | Roscoe G. Bartlett (Incumbent) | 117,313 | 37.9 | |||
| Libertarian | Nickolaus Mueller | 9,916 | 3.2 | |||
| N/A | Others (write-in) | 399 | 0.1 | |||
| Total votes | 309,549 | 100 | ||||
| Democratic gain from Republican | ||||||
| Party | Candidate | Votes | % | |
|---|---|---|---|---|
| Democratic | John Delaney (Incumbent) | 94,704 | 49.7 | |
| Republican | Dan Bongino | 91,930 | 48.2 | |
| Green | George Gluck | 3,762 | 2 | |
| N/A | Others (write-in) | 140 | 0.1 | |
| Total votes | 190,536 | 100 | ||
| Democratic hold | ||||
| Party | Candidate | Votes | % | |
|---|---|---|---|---|
| Democratic | John Delaney (Incumbent) | 185,770 | 56.0% | |
| Republican | Amie Hoeber | 133,081 | 40.1% | |
| Libertarian | David L. Howser | 6,889 | 2.1% | |
| Green | George Gluck | 5,824 | 1.8% | |
| Write-in | Ted Athey | 103 | 0.0% | |
| No party | Write-ins | 306 | 0.1 | |
| Total votes | 331,973 | 100 | ||
| Democratic hold | ||||
| Party | Candidate | Votes | % | |
|---|---|---|---|---|
| Democratic | David Trone | 163,346 | 59.0 | |
| Republican | Amie Hoeber | 105,209 | 38.0 | |
| Libertarian | Kevin Caldwell | 4,972 | 1.8 | |
| Green | George Gluck | 3,275 | 1.2 | |
| Independent | Other write-ins | 282 | 0.1 | |
| Total votes | 277,084 | 100 | ||
| Democratic hold | ||||
2020s
| Party | Candidate | Votes | % | |
|---|---|---|---|---|
| Democratic | David Trone (Incumbent) | 215,540 | 58.8 | |
| Republican | Neil Parrott | 143,599 | 39.2 | |
| Green | George Gluck | 6,893 | 1.9 | |
| No party | Write-ins | 402 | 0.1 | |
| Total votes | 366,434 | 100.0 | ||
| Democratic hold | ||||
| Party | Candidate | Votes | % | |
|---|---|---|---|---|
| Democratic | David Trone (incumbent) | 140,295 | 54.7 | |
| Republican | Neil Parrott | 115,771 | 45.2 | |
| Write-in | 332 | 0.1 | ||
| Total votes | 256,398 | 100.0 | ||
| Democratic hold | ||||
See also
- Maryland's congressional districts
- List of United States congressional districts
- 2024 Maryland's 6th congressional district election
Notes
- Supported the Adams-Clay faction in the 1824 United States presidential election
References
- Center for New Media & Promotion (CNMP), US Census Bureau. "My Congressional District". www.census.gov.
- "2022 Cook PVI: District Map and List". The Cook Political Report. July 12, 2022. Retrieved October 8, 2022.
- Varney, James (October 31, 2018). "Amie Hoeber and David Trone, Maryland's 6th Congressional District candidates, don't live there". The Washington Times. Associated Press. Retrieved April 25, 2021.
- Liptak, Adam. "Supreme Court Says Constitution Does Not Bar Partisan Gerrymandering". The New York Times. Retrieved June 27, 2019.
- Lazarick, Len (October 3, 2012). "Maryland has least compact congressional districts in nation". MarylandReporter.com. Retrieved October 7, 2012.
- Leckrone, Bennett (March 30, 2022). "The Major Shakeups for Incumbents in Legislative Leaders' Redrawn Congressional Map". Maryland Matters. Retrieved February 1, 2023.
- The Historical cal Parties in Congress, p. 74
- "Swing State Project: Presidential Results by Congressional District, 2000–2008". October 16, 2015. Archived from the original on October 16, 2015.
- "Daily Kos Elections 2008 & 2012 presidential election results for congressional districts used in 2012 & 2014 elections". Google Docs.
- "Maryland House results". Politics. CNN. November 4, 2014. Retrieved November 4, 2017.
- Supreme Court will take up a second gerrymandering case this term (Washington Post)
- "Benisek v. Lamone". Brennancenter.org. Retrieved January 24, 2018.
- "Info" (PDF). clerk.house.gov. 1990. Retrieved June 4, 2020.
- "92 PRESIDENTIAL and CONGRESSIONAL ELECTION STATISTICS". Office of the Clerk. Retrieved January 24, 2018.
- "94 congressional election statistics". Office of the Clerk. Retrieved January 24, 2018.
- "96 PRESIDENTIAL and CONGRESSIONAL ELECTION STATISTICS". Office of the Clerk. Retrieved January 24, 2018.
- "1998 Election Statistics – Legislative Activities". Office of the Clerk. Retrieved January 24, 2018.
- "2000 election statistics". Office of the Clerk. Retrieved January 24, 2018.
- "2002 election statistics". Office of the Clerk. Retrieved January 24, 2018.
- "2004 election statistics". Office of the Clerk. Retrieved January 24, 2018.
- "2006 Election Statistics". Office of the Clerk. Retrieved January 24, 2018.
- "2008 Election Statistics". Office of the Clerk. Retrieved January 24, 2018.
- "Info" (PDF). clerk.house.gov. 2010. Retrieved June 4, 2020.
- "Unofficial 2012 Presidential General Election results for Representative in Congress". Maryland State Board of Elections. Retrieved November 12, 2012.
- "Official 2018 Gubernatorial General Election results for Representative in Congress: Congressional District 6". Maryland State Board of Elections. December 11, 2018. Retrieved May 17, 2020.
- "Official 2020 Presidential General Election results for Representative in Congress". Maryland State Board of Elections. Retrieved December 14, 2020.
Bibliography
- Martis, Kenneth C. (1989). The Historical Atlas of Political Parties in the United States Congress. New York: Macmillan Publishing Company.
- Martis, Kenneth C. (1982). The Historical Atlas of United States Congressional Districts. New York: Macmillan Publishing Company.
- Congressional Biographical Directory of the United States 1774–present