List of cities proper by population density
This is a list of cities worldwide by population density. The population, population density and land area for the cities listed are based on the entire city proper, the defined boundary or border of a city or the city limits of the city. The population density of the cities listed is based on the average number of people living per square kilometer or per square mile. This list does not refer to the population, population density or land area of the greater metropolitan area or urban area, nor particular districts in any of the cities listed.
| Ekistics |
|---|
.jpg.webp) |
|
|
Cities by population density
_(Manila)(2018-02-07).jpg.webp)


- Note: links for each country go to the relevant list of cities, when available.
| City | Population | Area | Density | Country | Year | ||
|---|---|---|---|---|---|---|---|
| km2 | mi2 | /km2 | /mi2 | ||||
| Manila | 1,846,600 | 43 | 17 | 43,064 | 111,537 | 2020[1] 2018[2] | |
| Mandaluyong | 425,758 | 11 | 4 | 38,495 | 99,703 | 2020[1][3] | |
| Caloocan | 1,661,584 | 53 | 21 | 31,233 | 80,893 | 2020[1][3] | |
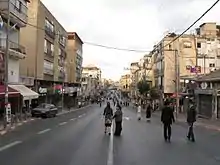
| Bnei Brak | 218,691 | 7 | 3 | 30,854 | 79,911 | 2023 [4][5] | |
| Kolkata | 6,200,000 | 206 | 80 | 30,097 | 77,952 | 2023[6] 2023[7] | |
| Kathmandu | 1,442,000 | 49 | 19 | 29,161 | 75,526 | 2020[8] | |
| Dhaka | 8,906,136 | 306 | 118 | 29,069 | 75,289 | ||
| Makati | 629,616 | 22 | 8 | 28,975 | 75,044 | 2020[1][3] | |
| Port-au-Prince | 987,310 | 36 | 14 | 27,395 | 70,953 | 2015[9] | |
| Levallois-Perret | 64,379 | 2 | 1 | 26,713 | 69,187 | 2020[10] | |
| Montrouge | 54,260 | 2 | 1 | 26,213 | 67,891 | 2020[11] | |
| Bogotá | 8,034,649 | 307 | 119 | 26,141 | 67,705 | 2020s[12][13] | |
| Vincennes | 49,891 | 2 | 1 | 26,121 | 67,653 | 2020[14] | |
| Le Pré-Saint-Gervais | 17,950 | 1 | 0 | 25,643 | 66,415 | 2020[15] | |
| Pasig | 803,159 | 31 | 12 | 25,530 | 66,122 | 2020[1][3] | |
| Saint-Mandé | 22,619 | 1 | 0 | 24,586 | 63,677 | 2020[16] | |
| La Plata | 654,324 | 27 | 10 | 24,234 | 62,767 | 2010 | |
| Saint-Josse-ten-Noode | 27,548 | 1 | 0 | 24,165 | 62,587 | [17][18] | |
| Guttenberg | 12,017 | 1 | 0 | 24,034 | 62,248 | 2020[19][20] | |
| Malabon | 380,522 | 16 | 6 | 23,842 | 61,751 | 2020[1][3] | |
| Pasay | 440,656 | 19 | 7 | 23,640 | 61,229 | 2020[1][3] | |
| Neapoli, Thessaloniki | 27,084 | 1 | 0 | 23,149 | 59,955 | [21] | |
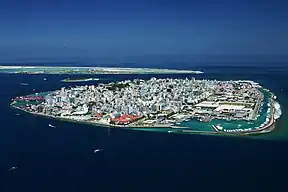
| Malé | 133,412 | 6 | 2 | 23,002 | 59,575 | [22][23][24] | |
| Damascus | 1,711,000 | 77 | 30 | 22,221 | 57,552 | [25] | |
| San Juan, Metro Manila | 126,347 | 6 | 2 | 21,524 | 55,748 | 2020[1][3] | |
| Navotas | 247,543 | 12 | 4 | 21,507 | 55,703 | 2020[1][3] | |
| Asmara | 963,000 | 45 | 17 | 21,400 | 55,426 | 2012[26] | |
| Mislata | 43,756 | 2 | 1 | 21,241 | 55,014 | [27] | |
| Macau | 643,100 | 30 | 12 | 21,224 | 54,971 | 2015[28][29] | |
| Kallithea | 100,050 | 5 | 2 | 21,063 | 54,554 | [30] | |
| Nea Smyrni | 73,090 | 4 | 1 | 20,764 | 53,779 | [30] | |
| Paris | 2,187,526 | 105 | 41 | 20,755 | 53,754 | 2020[31] | |
| Union City | 68,589 | 3 | 1 | 20,690 | 53,588 | 2020[19][20] | |
| Mumbai | 12,442,373 | 603 | 233 | 20,634 | 53,442 | 2013[32] 2019[33] | |
| Colombo | 752,993 | 37 | 14 | 20,351 | 52,710 | ||
| L'Hospitalet de Llobregat | 252,171 | 12 | 5 | 20,336 | 52,671 | 2016[34] | |
| West New York | 52,912 | 3 | 1 | 20,288 | 52,547 | 2020[19][20] | |
| Marikina | 456,059 | 23 | 9 | 20,144 | 52,173 | 2020[1][3] | |
| Saint-Gilles | 50,002 | 3 | 1 | 19,842 | 51,391 | [17][18] | |
| Clichy | 61,070 | 3 | 1 | 19,828 | 51,354 | 2020[35] | |
| Kotsiubynske | 17,249 | 1 | 0 | 19,826 | 51,351 | ||
| Courbevoie | 81,719 | 4 | 2 | 19,597 | 50,756 | 2020[36] | |
| Boulogne-Billancourt | 120,071 | 6 | 2 | 19,460 | 50,403 | 2020[37] | |
| Las Piñas | 606,293 | 32 | 12 | 18,935 | 49,041 | 2020[1][3] | |
| Koekelberg | 21,990 | 1 | 0 | 18,795 | 48,679 | ||
| Bandung | 3,075,478 | 167 | 64 | 18,416 | 47,698 | ||
| General Mariano Alvarez | 172,433 | 9 | 4 | 18,344 | 47,511 | 2020[1] 2013[38] | |
| Monaco | 36,950 | 2 | 1 | 18,292 | 47,377 | [39][40] | |
| Les Lilas | 23,045 | 1 | 0 | 18,290 | 47,370 | 2020[41] | |
| Hoboken | 60,419 | 3 | 1 | 18,226 | 47,205 | 2020[19] | |
| Giv'atayim | 62,242 | 3 | 1 | 19,210 | 49,755 | 2024[42] | |
| Quezon City | 2,960,048 | 166 | 64 | 17,882 | 46,315 | 2020[1][3] | |
| Vanves | 27,729 | 2 | 1 | 17,775 | 46,037 | 2020[43] | |
| Asnières-sur-Seine | 85,191 | 5 | 2 | 17,674 | 45,777 | 2020[44] | |
| Ciudad Nezahualcóyotl | 1,110,565 | 63 | 24 | 17,503 | 45,334 | 2010[45] | |
| Sliema | 22,591 | 1 | 1 | 17,378 | 45,008 | 2019 | |
| Howrah | 1,077,075 | 63 | 24 | 17,096 | 44,280 | [32][46] | |
| Santa Coloma de Gramenet | 118,821 | 7 | 3 | 16,974 | 43,964 | 2019[47] | |
| Modi'in Illit | 86,158 | 5 | 2 | 17,838 | 46,201 | 2024 | |
| Chittagong | 2,582,401 | 155 | 60 | 16,661 | 43,151 | 2018[48] | |
| Sint-Jans-Molenbeek | 97,462 | 6 | 2 | 16,547 | 42,857 | ||
| Seoul | 9,962,393 | 605 | 234 | 16,461 | 42,634 | 2019[49] 2013[50] | |
| Charenton-le-Pont | 30,374 | 2 | 1 | 16,418 | 42,524 | 2020[51] | |
| La Garenne-Colombes | 29,169 | 2 | 1 | 16,387 | 42,443 | 2020[52] | |
| Schaerbeek | 133,309 | 8 | 3 | 16,377 | 42,417 | ||
| Neuilly-sur-Seine | 60,361 | 4 | 1 | 16,183 | 41,913 | 2020[53] | |
| Barcelona | 1,636,732 | 101 | 39 | 16,149 | 41,827 | 2021[54] | |
| Issy-les-Moulineaux | 68,451 | 4 | 2 | 16,106 | 41,715 | 2020[55] | |
| Jakarta | 10,560,000 | 662 | 255 | 15,964 | 41,346 | 2019[56] 2020[57] | |
| Bat-Yam | 129,584 | 8 | 3 | 15,842 | 41,030 | 2019 | |
| Gentilly | 18,605 | 1 | 0 | 15,767 | 40,836 | 2020[58] | |
| Cairo | 9,539,673 | 606 | 234 | 15,742 | 40,772 | 2019[59] 2017[60] | |
| Buenos Aires | 3,120,612 | 203 | 78 | 15,372 | 39,815 | 2022 | |
| Rosario, Cavite | 110,807 | 8 | 3 | 14,561 | 37,712 | 2020[1] 2013[38] | |
| Mandaue | 364,116 | 25 | 10 | 14,461 | 37,453 | 2020[1] 2013[38] | |
| Warabi | 73,777 | 5 | 2 | 14,438 | 37,394 | 2023[61] | |
| Bacoor | 664,625 | 46 | 18 | 14,395 | 37,284 | 2020[1] 2013[38] | |
| El'ad | 50,289 | 4 | 1 | 14,368 | 37,214 | 2024 | |
| Beitar Illit | 67,618 | 5 | 2 | 14,296 | 37,026 | 2024 | |
| Senglea | 2,820 | 0 | 0 | 14,100 | 36,519 | 2013 | |
| Cimahi | 568,400 | 40 | 16 | 14,080 | 36,467 | 2020 | |
| San Pedro, Laguna | 326,001 | 24 | 9 | 13,555 | 35,108 | 2020[1] 2013[38] | |
| Kiryat Motzkin | 49,400 | 4 | 1 | 13,103 | 33,938 | 2024 | |
| Freetown | 1,055,964 | 81 | 31 | 12,960 | 33,566 | 2015 | |
| Geneva | 201,818 | 16 | 6 | 12,677 | 32,833 | 2020 | |
| Portici | 53,801 | 5 | 2 | 11,903 | 30,828 | 2019 | |
See also
- List of largest cities
- List of world cities by population density
- List of city districts by population density
- List of countries and dependencies by population density
- List of European Union cities proper by population density
- List of United States cities by population density
References
- Census of Population (2020). Table B - Population and Annual Growth Rates by Province, City, and Municipality - By Region. Philippine Statistics Authority. Retrieved 8 July 2021.
- "About Manila". The Official Website of the City of Manila, Philippines. Archived from the original on 24 December 2018. Retrieved 26 October 2019.
- "An Update on the Earthquake Hazards and Risk Assessment of Greater Metropolitan Manila Area" (PDF). Philippine Institute of Volcanology and Seismology. 14 November 2013. Archived from the original (PDF) on 24 June 2016.
- "List of localities, in Alphabetical order" (PDF). Israel Central Bureau of Statistics. Archived from the original (PDF) on 17 May 2018. Retrieved 25 December 2018.
- "Home Page" (in Hebrew). Bnei Brak Municipality. Retrieved 25 December 2018.
- "West Bengal". Office of the Registrar General & Census Commissioner, India. Retrieved 26 October 2023.
- "Basic Statistics of Kolkata". Kolkata Municipal Corporation. Retrieved 22 August 2023.
- "Kathmandu Population 2020". Retrieved 13 July 2022.
- "Mars 2015 Population Totale, Population de 18 Ans et Plus Menages et Densites Estimes En 2015" (PDF). Institut Haïtien de Statistique et d’Informatique (IHSI). Archived from the original (PDF) on 6 November 2015. Retrieved 19 February 2015.
- "Commune de Levallois-Perret (92044)" (in French). INSEE. Retrieved 16 August 2020.
- "Montrouge (92049 – Commune)" (in French). INSEE. Retrieved 16 August 2020.
- "Hay más de 7 millones de habitantes en Bogotá, según cifras del censo". El Tiempo. 4 July 2019. Archived from the original on 6 July 2019. Retrieved 6 July 2019.
- "Information" (PDF). www.dane.gov.co. 2019. Archived (PDF) from the original on 29 December 2019. Retrieved 26 March 2020.
- "Vincennes (94080 – Commune)" (in French). INSEE. Retrieved 16 August 2020.
- "Commune du Pré-Saint-Gervais (93061)" (in French). INSEE. Retrieved 16 August 2020.
- "Commune de Saint-Mandé (94067)" (in French). INSEE. Retrieved 16 August 2020.
- Direction Générale Institutions et Population, Belgique; Chiffre global de la population par commune, Situation au 1/07/2009 (pdf-file) Archived 19 April 2009 at the Wayback Machine Population as of 1 July 2009. Retrieved on 21 August 2009.
- GeoHive; Belgium - Brussels Hoofdstedelijk Gewest, Administrative units Archived 1 June 2016 at the Wayback Machine Retrieved on 21 August 2009.
- "Explore Census Data". data.census.gov. Retrieved 24 June 2021.
- 2010 Census Gazetteer Files: New Jersey County Subdivisions, United States Census Bureau. Accessed 11 April 2016.
- , page 51361. Population at the 24 May 2011 Census. Retrieved on 29 June 2020.
- "TABLE PP 9: TOTAL MALDIVIAN POPULATION BY SEX AND LOCALITY (ATOLLS), 2014". Statistics Maldives. National Bureau of Statistics. Retrieved 23 May 2015.
- Malé Land Area Isles: The Provincial Information. Retrieved 17 July 2009
- "Combination". Combination. 2018. doi:10.5040/9781350981690.
- Central Places and Un-Central Landscapes. 1 April 2019. doi:10.3390/books978-3-03897-679-0. ISBN 978-3-03897-679-0.
- "CIA – The World Factbook". Retrieved 2 September 2012.
- Población de España – datos y mapas; Todos los Municipios de España (xls, zipped file) Archived 7 April 2010 at the Wayback Machine Population and area 1 January 2009. Retrieved on 21 April 2010.
- "Demographic Statistics for the 3rd Quarter 2015". Statistics and Census Service of the Government of Macau SAR. 10 November 2015. Retrieved 10 November 2015.
- Current statistics: March 2014- Direcçāo dos Serviços de Cartografia e Cadastro (Cartography and Cadastre Bureau)
- "Ανακοίνωση προσωρινών αποτελεσμάτων Απογραφής Πληθυσμού 2011" (PDF). Archived from the original (PDF) on 11 October 2011. Retrieved 22 August 2011. Population and area at the 2011 Census. Retrieved on 22 July 2011.
- "Paris (75056 – Commune)" (in French). INSEE. Retrieved 16 August 2020.
- "Cities having population 1 lakh and above, Census 2011" (PDF). The Registrar General & Census Commissioner, India. Retrieved 18 August 2013.
- "About MMR". mmrda.maharashtra.gov.in. Mumbai Metropolitan Region Development Authority. Retrieved 2 April 2019.
- "Hospitalet de Llobregat, l' (081017)". Statistical Institute of Catalonia. Retrieved 5 March 2016.
- "Commune de Clichy (92024)" (in French). INSEE. Retrieved 16 August 2020.
- "Commune de Courbevoie (92026)" (in French). INSEE. Retrieved 16 August 2020.
- "Commune de Boulogne-Billancourt (92012)" (in French). INSEE. Retrieved 16 August 2020.
- "Table A. Population, Land Area, Population Density, and Percent Change in Population Density of the Philippines by Region, Province/Highly Urbanized City, and City/Municipality: 2010, 2015, and 2020". Philippine Statistics Authority. Archived from the original (XLSX) on 31 March 2022. Retrieved 10 August 2022.
- "Population et emploi / IMSEE - Monaco IMSEE". www.imsee.mc. Retrieved 24 June 2021.
- étrangères, Ministère de l'Europe et des Affaires. "Présentation de Monaco". France Diplomatie - Ministère de l'Europe et des Affaires étrangères (in French). Retrieved 24 June 2021.
- "Commune de Les Lilas (93045)" (in French). INSEE. Retrieved 16 August 2020.
- "Giv'atayim 2016" (PDF) (in Hebrew). Israel Central Bureau of Statistics. Retrieved 14 February 2019.
- "Vanves (92075)" (in French). INSEE. Retrieved 16 August 2020.
- "Asnières-sur-Seine (92004)" (in French). INSEE. Retrieved 16 August 2020.
- "Datos generales". Unidad de Microrregiones Dirección General Adjunta de Planeación Microrregional (in Spanish). Archived from the original on 13 April 2015.
- "Area, Population and density of population in the district of Howrah". Howrah District Government. Archived from the original on 26 February 2013. Retrieved 22 August 2013.
- "El municipi en xifres: Santa Coloma de Gramenet". Statistical Institute of Catalonia. Retrieved 30 December 2019.
- "Bangladesh: Districts and Cities – Population Statistics in Maps and Charts". City Population. Retrieved 23 December 2018.
- "Seoul Population 2019". World Population Review. Retrieved 3 November 2019.
- Park, Sohyun (10–14 June 2013). "Healthy Urban Planning in Seoul, Korea" (PDF). World Health Organization. Retrieved 20 November 2019.
- "Charenton-le-Pont (94018)" (in French). INSEE. Retrieved 16 August 2020.
- "La Garenne-Colombes (92035)" (in French). INSEE. Retrieved 16 August 2020.
- "Neuilly-sur-Seine (92051)" (in French). INSEE. Retrieved 16 August 2020.
- "Idescat. The municipality in figures. Barcelona (Barcelonès)" (in Spanish). IDESCAT. Retrieved 15 August 2022.
- "Issy-les-Moulineaux (92040)" (in French). INSEE. Retrieved 16 August 2020.
- "Indonesia Data Portal". Indonesia Data Portal. Retrieved 3 November 2019.
- "Jakarta Land Area". City Population. Retrieved 20 October 2020.
- "Gentilly (94037)" (in French). INSEE. Retrieved 16 August 2020.
- "Egypt Data Portal". Egypt Data Portal. Retrieved 3 November 2019.
- "Cairo Land Area". City Population. Retrieved 20 October 2017.
- "埼玉県推計人口(月報データ)". Saitama Prefecture. 1 January 2023. Retrieved 19 April 2023..
This article is issued from Wikipedia. The text is licensed under Creative Commons - Attribution - Sharealike. Additional terms may apply for the media files.