New York's 14th congressional district
New York's 14th congressional district is a congressional district for the United States House of Representatives located in New York City, represented by Democrat Alexandria Ocasio-Cortez.
| New York's 14th congressional district | |||
|---|---|---|---|
Interactive map of district boundaries | |||
| Representative |
| ||
| Distribution |
| ||
| Population (2022) | 730,392 | ||
| Median household income | $61,052[1] | ||
| Ethnicity |
| ||
| Cook PVI | D+28[2] | ||
.svg.png.webp)
.svg.png.webp)
The district includes the eastern part of The Bronx and part of north-central Queens. The Queens portion includes the neighborhoods of Astoria, College Point, Corona, East Elmhurst, Elmhurst, Jackson Heights, and Woodside. The Bronx portion of the district includes the neighborhoods of City Island, Country Club, Van Nest, Morris Park, Parkchester, Pelham Bay, Schuylerville, and Throggs Neck. The Bronx section of the district takes in part of the majority-Latino sections of the Bronx, with large Puerto Rican, Mexican, and Dominican populations, while the Queens section of the district includes ethnically diverse neighborhoods with large Chinese, Ecuadorian, Indian, Bangladeshi, and Greek communities. The district has the highest percentages of Ecuadorian Americans, at 9.0%, and Bangladeshi Americans, at 2.3%, out of New York's congressional districts.[3] Roughly half of the population of the district is of Hispanic or Latino heritage, making it one of the more Latino districts in New York. Before redistricting for the 2012 election, much of the area was in New York's 7th congressional district.
Recent statewide election results
| Year | Office | Result |
|---|---|---|
| 2000 | President | Gore (D) 70–23% |
| 2004 | President | Kerry (D) 74–25% |
| 2008 | President | Obama (D) 78–21% |
| 2012 | President | Obama (D) 80–18% |
| 2016 | President | Clinton (D) 77–19% |
| 2020 | President | Biden (D) 73–25% |
History
- 1803–1813: [data missing]
- 1813–1823: Montgomery County
- 1823–1913: [data missing]
- 1913–1945: Parts of Manhattan
- 1945–1983: Parts of Brooklyn
- 1983–1993: All of Staten Island, Parts of Brooklyn
- 1993–2003: Parts of Brooklyn, Manhattan, Queens
- 2003–2013: Parts of Manhattan, Queens
- 2013–present: Parts of Queens, The Bronx
During the 1970s, this area was the 18th district; in the 1980s it was the 15th district. The district was a Brooklyn-based seat until 1982 when it became the Staten Island district. In 1992 it became the East Side of Manhattan district, which for most of its existence had been the 17th district. In 2012, the district shifted to the former territory of the 7th district in Queens and the Bronx. From 2003 to 2013, the district encompassed much of what is now New York's 12th congressional district, including Central Park and the East Side of Manhattan; all of Roosevelt Island; and the neighborhoods of Astoria, Long Island City, and Sunnyside in Queens.
List of members representing the district
| Member | Party | Years | Cong ress |
Electoral history | Location |
|---|---|---|---|---|---|
| District established March 4, 1803 | |||||
 Erastus Root (Delhi) |
Democratic-Republican | March 4, 1803 – March 3, 1805 |
8th | Elected in 1802. Retired. |
1803–1809 Delaware and Otsego. |
| John Russell (Cooperstown) |
Democratic-Republican | March 4, 1805 – March 3, 1809 |
9th 10th |
Elected in 1804. Re-elected in 1806. Retired. | |
| Vincent Mathews (Elmira) |
Federalist | March 4, 1809 – March 3, 1811 |
11th | Elected in 1808. Retired. |
1809–1813 Tioga, Steuben, Cayuga and Seneca. |
| Daniel Avery (Aurora) |
Democratic-Republican | March 4, 1811 – March 3, 1813 |
12th | Re-elected in 1810. Redistricted to the 20th district. | |
| Jacob Markell (Manheim) |
Federalist | March 4, 1813 – March 3, 1815 |
13th | Elected in 1812. Retired. |
1813–1819 Montgomery |
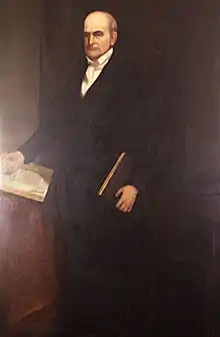 Daniel Cady (Johnstown) |
Federalist | March 4, 1815 – March 3, 1817 |
14th | Elected in 1814. Retired. | |
| John Herkimer (Danube) |
Democratic-Republican | March 4, 1817 – March 3, 1819 |
15th | Elected in 1816. Redistricted to the 15th district. | |
| John Fay (Northampton) |
Democratic-Republican | March 4, 1819 – March 3, 1821 |
16th | Elected in 1818. Retired. |
1819–1823 Montgomery County and the Town of Danube in Herkimer County. |
| Vacant | March 4, 1821 – December 3, 1821 |
17th | Elections were held in April 1821. It is unclear when results were announced or credentials issued. | ||
 Alfred Conkling (Canajoharie) |
Democratic-Republican | December 3, 1821 – March 3, 1823 |
Elected in 1821. Retired. | ||
| Henry R. Storrs (Whitestown) |
Democratic-Republican | March 4, 1823 – March 3, 1825 |
18th 19th 20th 21st |
Elected in 1822. Re-elected in 1824. Re-elected in 1826. Re-elected in 1828. Retired. |
1823–1833 Oneida |
| Anti-Jacksonian | March 4, 1825 – March 3, 1831 | ||||
 Samuel Beardsley (Utica) |
Jacksonian | March 4, 1831 – March 3, 1833 |
22nd | Elected in 1830. Redistricted to the 17th district. | |
 Ransom H. Gillet (Ogdensburg) |
Jacksonian | March 4, 1833 – March 3, 1837 |
23rd 24th |
Elected in 1832. Re-elected in 1834. Retired. |
1833–1843 [data missing] |
| James B. Spencer (Fort Covington) |
Democratic | March 4, 1837 – March 3, 1839 |
25th | Elected in 1836. Retired. | |
| John Fine (Ogdensburg) |
Democratic | March 4, 1839 – March 3, 1841 |
26th | Elected in 1838. Retired. | |
 Henry Bell Van Rensselaer (Ogdensburg) |
Whig | March 4, 1841 – March 3, 1843 |
27th | Elected in 1840. Retired. | |
 Charles Rogers (Sandy Hill) |
Whig | March 4, 1843 – March 3, 1845 |
28th | Elected in 1842. Retired. |
1843–1853 [data missing] |
| Erastus D. Culver (Greenwich) |
Whig | March 4, 1845 – March 3, 1847 |
29th | Elected in 1844. Retired. | |
 Orlando Kellogg (Elizabethtown) |
Whig | March 4, 1847 – March 3, 1849 |
30th | Elected in 1846. Retired. | |
| George R. Andrews (Ticonderoga) |
Whig | March 4, 1849 – March 3, 1851 |
31st | Elected in 1848. Retired. | |
| John H. Boyd (Whitehall) |
Whig | March 4, 1851 – March 3, 1853 |
32nd | Elected in 1850. Retired. | |
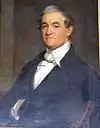
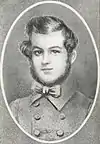
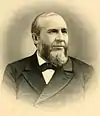
.jpg.webp) Rufus W. Peckham (Albany) |
Democratic | March 4, 1853 – March 3, 1855 |
33rd | Elected in 1852. Retired. |
1853–1863 [data missing] |
| Samuel Dickson (New Scotland) |
Opposition | March 4, 1855 – March 3, 1857 |
34th | Elected in 1854. Retired. | |
 Erastus Corning (Albany) |
Democratic | March 4, 1857 – March 3, 1859 |
35th | Elected in 1856. Retired. | |
 John H. Reynolds (Albany) |
Anti-Lecompton Democrat | March 4, 1859 – March 3, 1861 |
36th | Elected in 1858. Retired. | |
Erastus Corning (Albany) |
Democratic | March 4, 1861 – October 5, 1863 |
37th 38th |
Elected in 1860. Re-elected in 1862. Resigned. | |
| 1863–1873 [data missing] | |||||
| Vacant | October 5, 1863 – December 7, 1863 |
38th | |||
 John V. L. Pruyn (Albany) |
Democratic | December 7, 1863 – March 3, 1865 |
Elected to finish Corning's term. Retired. | ||
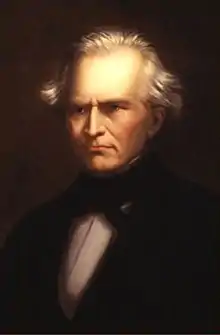
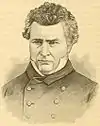
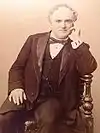
.jpg.webp) Charles Goodyear (Schoharie) |
Democratic | March 4, 1865 – March 3, 1867 |
39th | Elected in 1864. Retired. | |
John V. L. Pruyn (Albany) |
Democratic | March 4, 1867 – March 3, 1869 |
40th | Elected in 1866. Retired. | |
 Stephen L. Mayham (Schoharie) |
Democratic | March 4, 1869 – March 3, 1871 |
41st | Elected in 1868. Retired. | |
 Eli Perry (Albany) |
Democratic | March 4, 1871 – March 3, 1873 |
42nd | Elected in 1870. Redistricted to the 15th district. | |
 David M. De Witt (Kingston) |
Democratic | March 4, 1873 – March 3, 1875 |
43rd | Elected in 1872. Retired. |
1873–1883 [data missing] |
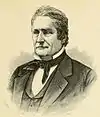
 George M. Beebe (Monticello) |
Democratic | March 4, 1875 – March 3, 1879 |
44th 45th |
Elected in 1874. Re-elected in 1876. Lost re-election. | |
 John W. Ferdon (Piermont) |
Republican | March 4, 1879 – March 3, 1881 |
46th | Elected in 1878. Retired. | |
 Lewis Beach (Cornwall) |
Democratic | March 4, 1881 – March 3, 1885 |
47th 48th |
Elected in 1880. Re-elected in 1882. Redistricted to the 15th district. | |
| 1883–1893 [data missing] | |||||
 William G. Stahlnecker (Yonkers) |
Democratic | March 4, 1885 – March 3, 1893 |
49th 50th 51st 52nd |
Elected in 1884. Re-elected in 1886. Re-elected in 1888. Re-elected in 1890. Retired. | |
 John R. Fellows (New York) |
Democratic | March 4, 1893 – December 31, 1893 |
53rd | Redistricted from the 6th district and re-elected in 1892. Resigned to become New York County District Attorney. |
1893–1903 [data missing] |
| Vacant | December 31, 1893 – January 30, 1894 |
||||
 Lemuel E. Quigg (New York) |
Republican | January 30, 1894 – March 3, 1899 |
53rd 54th 55th |
Elected to finish Fellows's term. Re-elected in 1894. Re-elected in 1896. Lost re-election. | |
 William A. Chanler (New York) |
Democratic | March 4, 1899 – March 3, 1901 |
56th | Elected in 1898. Retired. | |
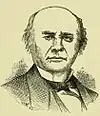
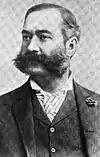
.jpg.webp) William H. Douglas (New York) |
Republican | March 4, 1901 – March 3, 1903 |
57th | Elected in 1900. Redistricted to the 15th district. | |
 Ira E. Rider (New York) |
Democratic | March 4, 1903 – March 3, 1905 |
58th | Elected in 1902. Retired. |
1903–1913 [data missing] |
 Charles A. Towne (New York) |
Democratic | March 4, 1905 – March 3, 1907 |
59th | Elected in 1904. Retired. | |
 William Willett Jr. (Queens) |
Democratic | March 4, 1907 – March 3, 1911 |
60th 61st |
Re-elected in 1906. Re-elected in 1908. Retired. | |
 John J. Kindred (Queens) |
Democratic | March 4, 1911 – March 3, 1913 |
62nd | Elected in 1910. Retired. | |
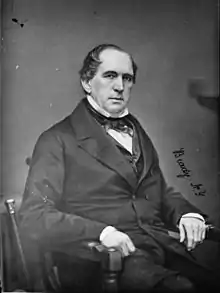
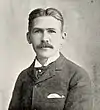
.jpg.webp) Jefferson M. Levy (New York) |
Democratic | March 4, 1913 – March 3, 1915 |
63rd | Redistricted from the 13th district and re-elected in 1912. [data missing] |
1913–1933 [data missing] |
 Michael F. Farley (New York) |
Democratic | March 4, 1915 – March 3, 1917 |
64th | Elected in 1914. Lost re-election. | |
 Fiorello H. LaGuardia (New York) |
Republican | March 4, 1917 – December 31, 1919 |
65th 66th |
Elected in 1916. Re-elected in 1918. Resigned. | |
| Vacant | December 31, 1919 – November 2, 1920 |
66th | |||
 Nathan D. Perlman (New York) |
Republican | November 2, 1920 – March 3, 1927 |
66th 67th 68th 69th |
Elected to finish LaGuardia's term. Also elected the same day in 1920 to the next term. Re-elected in 1922. Re-elected in 1924. Lost re-election. | |
 William I. Sirovich (New York) |
Democratic | March 4, 1927 – December 17, 1939 |
70th 71st 72nd 73rd 74th 75th 76th |
Elected in 1926. Re-elected in 1928. Re-elected in 1930. Re-elected in 1932. Re-elected in 1934. Re-elected in 1936. Re-elected in 1938. Died. | |
| 1933–1943 [data missing] | |||||
| Vacant | December 17, 1939 – February 6, 1940 |
76th | |||
 Morris Michael Edelstein (New York) |
Democratic | February 6, 1940 – June 4, 1941 |
76th 77th |
Elected to finish Sirovich's term. Re-elected later in 1940. Died. | |
| Vacant | June 4, 1941 – July 29, 1941 |
77th | |||
 Arthur George Klein (New York) |
Democratic | July 29, 1941 – January 3, 1945 |
77th 78th |
Elected to finish Edelstein's term. Re-elected in 1942. Retired to run for New York State Supreme Court. | |
| 1943–1953 [data missing] | |||||
 Leo F. Rayfiel (Brooklyn) |
Democratic | January 3, 1945 – September 13, 1947 |
79th 80th |
Elected in 1944. Re-elected in 1946. Resigned. | |
| Vacant | September 13, 1947 – November 4, 1947 |
80th | |||
 Abraham J. Multer (New York) |
Democratic | November 4, 1947 – January 3, 1953 |
80th 81st 82nd |
Elected to finish Rayfiel's term. Re-elected in 1948. Re-elected in 1950. Redistricted to the 13th district. | |
 John J. Rooney (Brooklyn) |
Democratic | January 3, 1953 – December 31, 1974 |
83rd 84th 85th 86th 87th 88th 89th 90th 91st 92nd 93rd |
Redistricted from the 12th district and re-elected in 1952. Re-elected in 1954. Re-elected in 1956. Re-elected in 1958. Re-elected in 1960. Re-elected in 1962. Re-elected in 1964. Re-elected in 1966. Re-elected in 1968. Re-elected in 1970. Re-elected in 1972. Retired and resigned. |
1953–1963 [data missing] |
| 1963–1973 [data missing] | |||||
| 1973–1983 [data missing] | |||||
| Vacant | December 31, 1974 – January 3, 1975 |
93rd | |||
 Frederick W. Richmond (Brooklyn) |
Democratic | January 3, 1975 – August 25, 1982 |
94th 95th 96th 97th |
Elected in 1974. Re-elected in 1976. Re-elected in 1978. Re-elected in 1980. Resigned. | |
| Vacant | August 25, 1982 – January 3, 1983 |
97th | |||
 Guy V. Molinari (Staten Island) |
Republican | January 3, 1983 – December 31, 1989 |
98th 99th 100th 101st |
Redistricted from the 17th district and re-elected in 1982. Re-elected in 1984. Re-elected in 1986. Re-elected in 1988. Resigned to become Borough President of Staten Island. |
1983–1993 [data missing] |
| Vacant | December 31, 1989 – March 20, 1990 |
101st | |||
 Susan Molinari (Staten Island) |
Republican | March 20, 1990 – January 3, 1993 |
101st 102nd |
Elected to finish her father's term. Re-elected later in 1990. Redistricted to the 13th district. | |
 Carolyn Maloney (New York) |
Democratic | January 3, 1993 – January 3, 2013 |
103rd 104th 105th 106th 107th 108th 109th 110th 111th 112th |
Elected in 1992. Re-elected in 1994. Re-elected in 1996. Re-elected in 1998. Re-elected in 2000. Re-elected in 2002. Re-elected in 2004. Re-elected in 2006. Re-elected in 2008. Re-elected in 2010. Redistricted to the 12th district. |
1993–2003 [data missing] |
2003–2013 Central Park and the East Side of Manhattan; all of Roosevelt Island; and the neighborhoods of Astoria, Long Island City, and Sunnyside in Queens | |||||
 Joe Crowley (Queens) |
Democratic | January 3, 2013 – January 3, 2019 |
113th 114th 115th |
Redistricted from the 7th district and re-elected in 2012. Re-elected in 2014. Re-elected in 2016. Lost re-nomination and re-election. |
2013–2023.tif.png.webp) The eastern part of the Bronx and part of north-central Queens |
 Alexandria Ocasio-Cortez (Queens) |
Democratic | January 3, 2019 – present |
116th 117th 118th |
Elected in 2018. Re-elected in 2020. Re-elected in 2022. | |
2023–2025_(since_2023).svg.png.webp) The eastern part of the Bronx and part of north-central Queens | |||||
Electoral history
Note that in New York State electoral politics there are numerous minor parties at various points on the political spectrum. Certain parties will invariably endorse either the Republican or Democratic candidate for every office, hence the state electoral results contain both the party votes, and the final candidate votes (Listed as "Recap").
| Party | Candidate | Votes | % | ±% | |
|---|---|---|---|---|---|
| Democratic | Eli Perry | 17,716 | 54.1% | ||
| Republican | Minard Harder | 14,726 | 44.9% | ||
| Labor Reform Party | John Hastings | 336 | 1.0% | ||
| Majority | 2,990 | 9.2% | |||
| Turnout | 32,778 | 100% | |||
[data missing]
| Party | Candidate | Votes | % | |
|---|---|---|---|---|
| Republican | Lemuel Quigg (incumbent) | 27,875 | 54.9% | |
| Democratic | John Quincy Adams | 18,533 | 36.5% | |
| National Democratic | Charles V. Fornes | 2,414 | 4.8% | |
| Socialist Labor | Richard Morton | 1,235 | 2.4% | |
| Prohibition | Benjamin T Rogers | 137 | 0.3% | |
| None | Blank and scattering | 548 | 1.1% | |
| Total votes | 50,762 | 100% | ||
| Party | Candidate | Votes | % | |
|---|---|---|---|---|
| Democratic | William Astor Chanler | 31,604 | 54.3% | |
| Republican | Lemuel Quigg (incumbent) | 25,209 | 43.3% | |
| Socialist Labor | Emil Neppel | 1,307 | 1.1% | |
| Prohibition | Albert T. Wadhams | 104 | 0.1% | |
| Total votes | 58,224 | 100% | ||
| Party | Candidate | Votes | % | |
|---|---|---|---|---|
| Republican | William H. Douglas | 36,904 | 52.0% | |
| Democratic | John S. Hill | 32,167 | 45.3% | |
| Social Democratic | Emil Neppel | 931 | 1.3% | |
| Socialist Labor | Peter Carroll | 645 | 0.9% | |
| Prohibition | James H. Yarnall | 130 | 0.2% | |
| Total votes | 70,777 | 100% | ||
| Party | Candidate | Votes | % | |
|---|---|---|---|---|
| Democratic | Ira E. Rider | 20,402 | 63.7% | |
| Republican | Andrew J. Anderson | 8,492 | 26.5% | |
| Social Democratic | William Ehret | 2,348 | 7.3% | |
| Socialist Labor | Arthur Chambers | 647 | 2.0% | |
| Liberty Bell Democratic | John J. M. Issing | 79 | 0.2% | |
| Prohibition | John C. Wallace | 79 | 0.2% | |
| Total votes | 32,047 | 100% | ||
| Party | Candidate | Votes | % | |
|---|---|---|---|---|
| Democratic | Charles A. Towne | 21,627 | 57.1% | |
| Republican | Lucien Knapp | 12,664 | 33.4% | |
| Social Democratic | William Ehret | 2,973 | 7.8% | |
| Socialist Labor | Lewis Newman | 380 | 1.0% | |
| Populist | Peter A. Leininger | 217 | 0.6% | |
| Prohibition | Albert Wadhams | 47 | 0.1% | |
| Total votes | 37,908 | 100% | ||
| Party | Candidate | Votes | % | |
|---|---|---|---|---|
| Democratic | William Willett Jr. | 17,675 | 46.3% | |
| Republican | Frank E. Losee | 10,006 | 26.2% | |
| Independence | Charles E. Shober | 8,110 | 21.3% | |
| Socialist | Richard Morton | 2,328 | 6.1% | |
| Prohibition | Albert Wadhams | 40 | 0.1% | |
| Total votes | 38,159 | 100% | ||
| Party | Candidate | Votes | % | |
|---|---|---|---|---|
| Democratic | William Willett Jr. (incumbent) | 21,643 | 52.2% | |
| Republican | Emanuel Castka | 14,189 | 34.2% | |
| Socialist | Phillip H. Schmitt | 3,055 | 7.4% | |
| Independence | Herbert Wade | 2,485 | 6.0% | |
| Prohibition | Joseph. H Ralph | 69 | 0.2% | |
| Total votes | 41,451 | 100% | ||
| Party | Candidate | Votes | % | |
|---|---|---|---|---|
| Democratic | John J. Kindred | 20,875 | 54.3% | |
| Republican | Victor Hugo Duras | |||
| Independence | Victor Hugo Duras | |||
| Total | Victor Hugo Duras | 14,018 | 36.5% | |
| Socialist | William Ehret | 3,481 | 9.1% | |
| Prohibition | Joseph H. Ralph | 54 | 0.1% | |
| Total votes | 38,428 | 100% | ||
| Party | Candidate | Votes | % | |
|---|---|---|---|---|
| Democratic | Jefferson M. Levy | 8,950 | 49.4% | |
| Progressive | Abraham H. Goodman | 4,457 | 24.6% | |
| Republican | E. Crosby Kindleberger | 3,468 | 19.1% | |
| Socialist | Marie MacDonald | 958 | 5.3% | |
| Independence | James W. Conners | 202 | 1.1% | |
| Jefferson | Henry B. Martin | 73 | 0.4% | |
| Prohibition | Charles H. Simmons | 14 | 0.1% | |
| Total votes | 18,122 | 100% | ||
| Party | Candidate | Votes | % | |
|---|---|---|---|---|
| Democratic | Michael F. Farley | |||
| Independence | Michael F. Farley | |||
| Total | Michael F. Farley | 7,310 | 46.5% | |
| Republican | Fiorello H. La Guardia | 5,331 | 33.9% | |
| Socialist | Henry L. Slobodin | 1,534 | 9.8% | |
| Progressive | John B. Golden | 1,456 | 9.3% | |
| Prohibition | James F. Gillespie | 82 | 0.5% | |
| Total votes | 15,713 | 100% | ||
| Party | Candidate | Votes | % | |
|---|---|---|---|---|
| Republican | Fiorello H. La Guardia | |||
| National | Fiorello H. La Guardia | |||
| Progressive | Fiorello H. La Guardia | |||
| American | Fiorello H. La Guardia | |||
| Total | Fiorello H. La Guardia | 7,272 | 39.0% | |
| Democratic | Michael F. Farley | |||
| Independence | Michael F. Farley | |||
| Total | Michael F. Farley | 6,915 | 37.0% | |
| Socialist | William I. Sockheim | 2,536 | 13.6% | |
| None | Blank, scattering, defective and void | 1,867 | 10.0% | |
| Prohibition | Samuel Fishman | 80 | 0.4% | |
| Total votes | 18,670 | 100% | ||
| Party | Candidate | Votes | % | |
|---|---|---|---|---|
| Republican | Fiorello H. La Guardia | |||
| Democratic | Fiorello H. La Guardia | |||
| Total | Fiorello H. La Guardia (incumbent) | 14,523 | 65.0% | |
| Socialist | Scott Nearing | 6,214 | 27.8% | |
| None | Blank, scattering, defective and void | 1,531 | 6.8% | |
| Prohibition | Alfred H. Saunders | 89 | 0.4% | |
| Total votes | 22,357 | 100% | ||
| Party | Candidate | Votes | % | |
|---|---|---|---|---|
| Republican | Nathan D. Perlman | 18,042 | 45.2% | |
| Socialist | Algernon Lee | 8,515 | 21.3% | |
| None | Blank, scattering, defective and void | 3,370 | 8.4% | |
| Total votes | 39,927 | 100% | ||
| Party | Candidate | Votes | % | |
|---|---|---|---|---|
| Republican | Nathan D. Perlman (incumbent) | 8,782 | 37.4% | |
| Democratic | David H. Knott | 8,173 | 34.8% | |
| Socialist | Jacob Panken | 6,459 | 27.5% | |
| Prohibition | Kenneth S. Guthrie | 94 | 0.4% | |
| Total votes | 23,508 | 100% | ||
| Party | Candidate | Votes | % | |
|---|---|---|---|---|
| Republican | Nathan D. Perlman (incumbent) | 12,046 | 43.5% | |
| Democratic | William Irving Sirovich | 11,920 | 43.0% | |
| Socialist | William Karlin | 3,165 | 11.4% | |
| Workers | Ludwig Lore | 216 | 0.8% | |
| Total votes | 27,707 | 100% | ||
| Party | Candidate | Votes | % | |
|---|---|---|---|---|
| Democratic | William Irving Sirovich | 11,809 | 47.4% | |
| Republican | Nathan D. Perlman (incumbent) | 10,688 | 42.9% | |
| Socialist | S.E. Beardsley | 1,277 | 5.1% | |
| None | Blank, void, and scattering | 1,060 | 4.3% | |
| Workers | Alexander Trachtenberg | 112 | 0.4% | |
| Total votes | 24,930 | 100% | ||
| Party | Candidate | Votes | % | |
|---|---|---|---|---|
| Democratic | William Irving Sirovich (incumbent) | 16,602 | 52.1% | |
| Republican | Sol Ullman | 11,974 | 37.5% | |
| Socialist | August Claessens | 1,648 | 5.2% | |
| None | Blank | 1,359 | 4.3% | |
| Workers | Alexander Trachtenberg | 307 | 1.0% | |
| Total votes | 31,890 | 100% | ||
| Party | Candidate | Votes | % | |
|---|---|---|---|---|
| Democratic | William Irving Sirovich (incumbent) | 12,431 | 47.3% | |
| Socialist | Jacob Panken | 6,793 | 25.9% | |
| Republican | Edward E. Spafford | 6,658 | 25.3% | |
| None | Alexander Trachtenberg | 385 | 1.5% | |
| Total votes | 26,267 | 100% | ||
| Party | Candidate | Votes | % | |
|---|---|---|---|---|
| Democratic | William Irving Sirovich (incumbent) | 20,668 | 60.7 | |
| Republican | Henry A. Lowenberg | 9,651 | 28.3 | |
| Socialist | August Claessens | 2,735 | 8.0 | |
| Communist | Abraham Markoff | 1,011 | 3.0 | |
| Total votes | 34,065 | 100 | ||
| Party | Candidate | Votes | % | |
|---|---|---|---|---|
| Democratic | William Irving Sirovich (incumbent) | 15,437 | 48.1 | |
| Republican | Frederick J. Groehl | 9,744 | 30.4 | |
| None | Blank and scattering | 2,868 | 8.9 | |
| Socialist | Rachel Panken | 2,259 | 7.0 | |
| Communist | Peter Cacchione | 1,612 | 5.0 | |
| Law Preservation | Lyman A. Garber | 160 | 0.5 | |
| Total votes | 32,080 | 100 | ||
[data missing]
| Party | Candidate | Votes | % | ±% | |
|---|---|---|---|---|---|
| Democratic | Carolyn B. Maloney (incumbent) | 130,175 | 72.4% | ||
| Republican | Jeffrey E. Livingston | 42,641 | 23.7% | ||
| Green | Thomas K. Leighton | 3,512 | 2.0% | ||
| Conservative | Joseph A. Lavezzo | 2,188 | 1.2% | ||
| Right to Life | Delco L. Cornett | 1,221 | 0.7% | ||
| Majority | 87,534 | 48.7% | |||
| Turnout | 179,737 | 100% | |||
| Party | Candidate | Votes | % | ±% | |
|---|---|---|---|---|---|
| Democratic | Carolyn B. Maloney (incumbent) | 111,072 | 77.4% | +5.0 | |
| Republican | Stephanie E. Kupferman | 32,458 | 22.6% | −1.1 | |
| Majority | 78,614 | 54.8% | +6.1 | ||
| Turnout | 143,530 | 100% | −20.1 | ||
| Party | Candidate | Votes | % | ±% | |
|---|---|---|---|---|---|
| Democratic | Carolyn B. Maloney (incumbent) | 148,080 | 73.9% | −3.5 | |
| Republican | C. Adrienne Rhodes | 45,453 | 22.7% | +0.1 | |
| Green | Sandra Stevens | 4,869 | 2.4% | +2.4 | |
| Independence | Frederick D. Newman | 1,946 | 1.0% | +1.0 | |
| Majority | 102,627 | 51.2% | −3.6 | ||
| Turnout | 200,348 | 100% | +39.6 | ||
| Party | Candidate | Votes | % | ±% | |
|---|---|---|---|---|---|
| Democratic | Carolyn B. Maloney (incumbent) | 95,931 | 75.3% | +1.4 | |
| Republican | Anton Srdanovic | 31,548 | 24.7% | +2.0 | |
| Majority | 64,383 | 50.5% | −0.7 | ||
| Turnout | 127,479 | 100% | −36.4 | ||
| Party | Candidate | Votes | % | ±% | |
|---|---|---|---|---|---|
| Democratic | Carolyn B. Maloney (incumbent) | 186,688 | 81.1% | +5.8 | |
| Republican | Anton Srdanovic | 43,623 | 18.9% | −5.8 | |
| Majority | 143,065 | 62.1% | +11.6 | ||
| Turnout | 230,311 | 100% | +80.7 | ||
| Party | Candidate | Votes | % | ±% | |
|---|---|---|---|---|---|
| Democratic | Carolyn B. Maloney (incumbent) | 119,582 | 84.5% | +3.4 | |
| Republican | Danniel Maio | 21,969 | 15.5% | −3.4 | |
| Majority | 97,613 | 69.0% | +6.9 | ||
| Turnout | 141,551 | 100% | −38.5 | ||
| Party | Candidate | Votes | % | ±% | |
|---|---|---|---|---|---|
| Democratic | Carolyn B. Maloney (incumbent) | 183,239 | 79.9% | −4.6 | |
| Republican | Robert G. Heim | 43,385 | 18.9% | +3.4 | |
| Libertarian | Isaiah Matos | 2,659 | 1.2% | +1.2 | |
| Majority | 139,854 | 61.0% | −8.0 | ||
| Turnout | 229,283 | 100% | +62.0 | ||
| Party | Candidate | Votes | % | ±% | |
|---|---|---|---|---|---|
| Democratic | Carolyn B. Maloney (incumbent) | 107,327 | 75.1% | −4.8 | |
| Republican | David Ryan Brumberg | 32,065 | 22.4% | +3.5 | |
| Conservative | Timothy J. Healy | 1,891 | 1.3% | +1.3 | |
| Independence | Dino L. LaVerghetta | 1,617 | 1.1% | +1.1 | |
| Majority | 75,262 | 52.7% | −8.3 | ||
| Turnout | 142,900 | 100% | −37.7 | ||
| Party | Candidate | Votes | % | |
|---|---|---|---|---|
| Democratic | Joe Crowley | 116,117 | ||
| Working Families | Joe Crowley | 4,644 | ||
| Total | Joe Crowley (incumbent) | 120,761 | 83.2% | |
| Republican | William Gibbons | 19,191 | ||
| Conservative | William Gibbons | 2,564 | ||
| Total | William Gibbons | 21,755 | 15.0% | |
| Green | Anthony Gronowicz | 2,570 | 1.8% | |
| None | Blank/Void/Scattered | 25,915 | ||
| Total votes | 145,086 | 100.00% | ||
| Democratic hold | ||||
| Party | Candidate | Votes | % | |
|---|---|---|---|---|
| Democratic | Joe Crowley | 45,370 | 67.34% | |
| Working Families | Joe Crowley | 4,982 | 7.39% | |
| Total | Joe Crowley (incumbent) | 50,352 | 74.74% | |
| Conservative | Elizabeth Perri | 6,735 | 10.00% | |
| None | Blank/Void/Write-In | 10,285 | 15.27% | |
| Total votes | 67,372 | 100% | ||
| Democratic hold | ||||
| Party | Candidate | Votes | % | |
|---|---|---|---|---|
| Democratic | Joe Crowley | 138,367 | 70.13% | |
| Working Families | Joe Crowley | 7,317 | 3.71% | |
| Women's Equality | Joe Crowley | 1,903 | 0.96% | |
| Total | Joe Crowley (incumbent) | 147,587 | 74.80% | |
| Republican | Frank J. Spotorno | 26,891 | 13.63% | |
| Conservative | Frank J. Spotorno | 3,654 | 1.85% | |
| Total | Frank J. Spotorno | 30,545 | 15.48% | |
| None | Blank/Void/Scattering | 19,169 | 9.72% | |
| Total votes | 197,301 | 100.00% | ||
| Democratic hold | ||||
| Party | Candidate | Votes | % | |
|---|---|---|---|---|
| Democratic | Alexandria Ocasio-Cortez | 100,044 | 78% | |
| Republican | Anthony Pappas | 17,762 | 13.8% | |
| Working Families | Joe Crowley (incumbent) | 8,505 | 6.6% | |
| Conservative | Elizabeth Perri | 2,028 | 1.6% | |
| Reform | James Dillon | N/A | N/A | |
| Total votes | 128,339 | 100.00% | ||
| Democratic hold | ||||
| Party | Candidate | Votes | % | |
|---|---|---|---|---|
| Democratic | Alexandria Ocasio-Cortez (incumbent) | 152,661 | 71.6% | |
| Republican | John Cummings | 58,440 | 27.4% | |
| SAM | Michelle Caruso-Cabrera | 2,000 | 0.9% | |
| Total votes | 213,323 | 100% | ||
| Democratic hold | ||||
| Party | Candidate | Votes | % | |
|---|---|---|---|---|
| Democratic | Alexandria Ocasio-Cortez | 70,855 | 60.42% | |
| Working Families | Alexandria Ocasio-Cortez | 7,933 | 6.76% | |
| Total | Alexandria Ocasio-Cortez (incumbent) | 78,788 | 67.18% | |
| Republican | Tina Forte | 30,661 | 26.14% | |
| Conservative | Desi Cuellar | 2,128 | 1.81% | |
| Total votes | 117,274 | 100% | ||
See also
References
- Center for New Media & Promotion (CNMP), US Census Bureau. "My Congressional District". www.census.gov.
- "2022 Cook PVI: District Map and List". Cook Political Report. Retrieved January 10, 2023.
- "The Demographic Statistical Atlas of the United States - Statistical Atlas". statisticalatlas.com. Retrieved January 14, 2024.
- November Election, 1870. Complete Statement of the Official Canvass, in Detail of the Election Held November 8, 1870, Giving the Vote of Each Election District, with Proceedings of County And State... Vol. II. County of New York. 1871. p. 2034. Retrieved March 29, 2009.
{{cite book}}: CS1 maint: others (link) - The New York Red Book, 1897. Williams Press. 1897. p. 770. Retrieved March 29, 2009.
- The New York Red Book, 1899. Williams Press etc. 1899. p. 744. Retrieved June 28, 2020.
- The New York Red Book, 1901. Williams Press etc. 1899. p. 593. Retrieved June 28, 2020.
- The New York Red Book, 1903. Williams Press etc. 1903. p. 619. Retrieved June 28, 2020.
- The New York Red Book, 1905. 1905. p. 601. Retrieved June 28, 2020.
- The New York Red Book, 1907. 1907. p. 617. Retrieved June 28, 2020.
- The New York Red Book, 1909. 1909. p. 638. Retrieved June 28, 2020.
- The New York Red Book, 1911. 1911. p. 640. Retrieved June 28, 2020.
- The New York Red Book, 1913. 1913. p. 673. Retrieved June 28, 2020.
- The New York Red Book, 1915. 1915. p. 707. Retrieved June 28, 2020.
- The New York Red Book, 1917. 1917. p. 495. Retrieved June 28, 2020.
- The New York Red Book, 1919. 1919. p. 467. Retrieved June 28, 2020.
- "Statistics of the Congressional and Presidential Election of November 2, 1920". Retrieved June 28, 2020.
- "Statistics of the Congressional and Presidential Election of November 7, 1922". Retrieved June 29, 2020.
- "Statistics of the Congressional and Presidential Election of November 4, 1924". Retrieved June 29, 2020.
- "Statistics of the Congressional and Presidential Election of November 2, 1926". Retrieved June 29, 2020.
- "Statistics of the Congressional and Presidential Election of November 6, 1928". Retrieved June 29, 2020.
- "Statistics of the Congressional and Presidential Election of November 4, 1930". Retrieved June 29, 2020.
- "Statistics of the Congressional and Presidential Election of November 8, 1932". Retrieved June 29, 2020.
- "Statistics of the Congressional and Presidential Election of November 6, 1934". Retrieved June 29, 2020.
- 2012 United States House of Representatives elections in New York: "NYS Board of Elections Rep. in Congress Election Returns Nov 6, 2012" (PDF, 192 kB). New York Board of Elections. March 20, 2013. Retrieved November 3, 2018.
- "NYS Board of Elections". NYS Board of Elections. November 4, 2014. Retrieved January 23, 2017.
- From 2016 United States House of Representatives elections in New York: "New York State Official Election Night Results" (PDF, 475 kB). New York Board of Elections. December 22, 2016. Retrieved December 28, 2016.
- Foderaro, Lisa (July 11, 2018). "Ocasio-Cortez Highlights How Third-Party Quirks Can Muddle Elections". New York Times. Retrieved July 14, 2018.
- "Democrat Alexandria Ocasio-Cortez wins reelection to U.S. House in New York's 14th Congressional District". AP NEWS. November 4, 2020. Retrieved November 28, 2020.
- "New York Election Results: 14th Congressional District". The New York Times. November 3, 2020. ISSN 0362-4331. Retrieved November 28, 2020.
Bibliography
- Martis, Kenneth C. (1989). The Historical Atlas of Political Parties in the United States Congress. New York: Macmillan Publishing Company.
- Martis, Kenneth C. (1982). The Historical Atlas of United States Congressional Districts. New York: Macmillan Publishing Company.
- Congressional Biographical Directory of the United States 1774–present
- 2004 House election data Clerk of the House of Representatives
- 2002 House election data "
- 2000 House election data "
- 1998 House election data "
- 1996 House election data "