North Dakota's at-large congressional district
North Dakota's at-large congressional district is the sole congressional district for the state of North Dakota. Based on size, it is the eighth largest congressional district in the nation.
| North Dakota's at-large congressional district | |||
|---|---|---|---|
 | |||
| Representative |
| ||
| Area | 68,976 sq mi (178,650 km2) | ||
| Distribution |
| ||
| Population (2022) | 779,261[1] | ||
| Median household income | $71,970[2] | ||
| Ethnicity |
| ||
| Cook PVI | R+20[3] | ||
The district is currently represented by Kelly Armstrong.
History
The district was first created when North Dakota achieved statehood on November 2, 1889, electing a single member. Following the 1900 United States census the state was allocated two seats, both of whom were elected from an at large district. Following the 1910 United States census a third seat was gained, with the legislature drawing three separate districts. The third district was eliminated after the 1930 United States census. After the third seat was lost, North Dakota returned to electing two members at-large (statewide).
Following the 1960 United States census two separate districts were created. In 1970, the second district was eliminated following the 1970 United States census and a single at-large district was created. Since 1972, North Dakota has retained a single congressional district.
List of members representing the district
1889–1913: one seat, then two
From 1889 to 1903, there was one seat, elected at-large statewide. In 1903 a second at-large seat was added, lasting until 1913.
| Dates | Cong ress |
Member at-large | Member at-large | |||||
|---|---|---|---|---|---|---|---|---|
| Member | Party | Electoral history | Member | Party | Electoral history | |||
| March 4, 1889 – November 1, 1889 |
51st | First member seated on November 2, 1889 | Second seat added in 1903 | |||||
| November 2, 1889 – March 3, 1891 |
 Henry C. Hansbrough (Devils Lake) |
Republican | Elected in 1889. Lost renomination. | |||||
| March 4, 1891 – March 3, 1899 |
52nd 53rd 54th 55th |
 Martin N. Johnson (Petersburg) |
Republican | Elected in 1890. Re-elected in 1892. Re-elected in 1894. Re-elected in 1896. Retired to run for U.S. Senator. | ||||
| March 4, 1899 – March 3, 1901 |
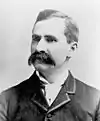
56th | 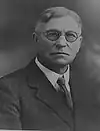 Burleigh F. Spalding (Fargo) |
Republican | Elected in 1898. Retired. | ||||
| March 4, 1901 – March 3, 1903 |
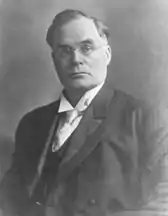
57th | 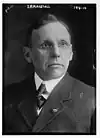 Thomas F. Marshall (Oakes) |
Republican | Elected in 1900. Re-elected in 1902. Re-elected in 1904. Re-elected in 1906. Retired to run for U.S. Senator. | ||||
| March 4, 1903 – March 3, 1905 |
58th | Burleigh F. Spalding (Fargo) |
Republican | Elected in 1902. Lost renomination. | ||||
| March 4, 1905 – March 3, 1909 |
59th 60th |
 Asle Gronna (Lakota) |
Republican | Elected in 1904. Re-elected in 1906. Re-elected in 1908. Resigned after elected U.S. Senator. | ||||
| March 4, 1909 – February 11, 1911 |
61st | 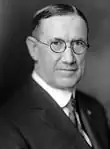 Louis B. Hanna (Fargo) |
Republican | Elected in 1908. Re-elected in 1910. Resigned when elected Governor of North Dakota. | ||||
| February 11, 1911 – March 3, 1911 |
Vacant | |||||||
| March 4, 1911 – January 7, 1913 |
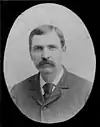
62nd | 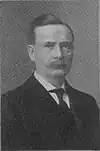 Henry T. Helgesen (Milton) |
Republican | Elected in 1910. Redistricted to the 1st district. | ||||
| January 7, 1913 – March 3, 1913 |
Vacant | |||||||
1913–1933: districts only
After the 1910 census, three seats were apportioned among districts: the 1st district, 2nd district, and 3rd district.
1933–1963: two seats
In 1933, following the 1930 census, the delegation was reduced to two seats and the districts were eliminated in favor of a pair of at-large districts, lasting until 1963.
| Dates | Cong ress |
Member at-large | Member at-large | |||||
|---|---|---|---|---|---|---|---|---|
| Member | Party | Electoral history | Member | Party | Electoral history | |||
| March 4, 1933 – January 3, 1935 |
73rd |  James H. Sinclair (Kenmare) |
Republican | Redistricted from the 3rd district and re-elected in 1932. Lost renomination. |
 William Lemke (Fargo) |
Republican-NPL | Elected in 1932. Re-elected in 1934. Re-elected in 1936. Re-elected in 1938. Re-elected in 1940. Re-elected in 1942. Retired to run for U.S. Senator. | |
| January 3, 1935 – January 3, 1941 |
74th 75th 76th |
 Usher L. Burdick (Williston) |
Republican-NPL | Elected in 1934. Re-elected in 1936. Re-elected in 1938. Retired to run for U.S. Senator. | ||||
| January 3, 1941 – January 3, 1943 |
77th | Charles R. Robertson (Bismark) |
Republican | Elected in 1940. Lost renomination. | ||||
| January 3, 1943 – January 3, 1945 |
78th | William Lemke (Fargo) |
Republican-NPL | Elected in 1942. Re-elected in 1944. Re-elected in 1946. Re-elected in 1948. Died. | ||||
| January 3, 1945 – January 3, 1949 |
79th 80th |
Charles R. Robertson (Bismark) |
Republican | Elected in 1944. Re-elected in 1946. Lost renomination. | ||||
| January 3, 1949 – May 30, 1950 |
81st | Usher L. Burdick (Williston) |
Republican-NPL | Elected in 1948. Re-elected in 1950. Re-elected in 1952. Re-elected in 1954. Re-elected in 1956. Retired. | ||||
| May 31, 1950 – January 3, 1951 |
Vacant | |||||||
| January 3, 1951 – January 3, 1953 |
82nd | Fred G. Aandahl (Litchville) |
Republican | Elected in 1950. Retired to run for U.S. Senator. | ||||
| January 3, 1953 – January 3, 1959 |
83rd 84th 85th |
 Otto Krueger (Fessenden) |
Republican | Elected in 1952. Re-elected in 1954. Re-elected in 1956. Retired. | ||||
| January 3, 1959 – August 8, 1960 |
86th |  Quentin Burdick (Fargo) |
Democratic–NPL | Elected in 1958. Resigned when elected U.S. Senator. |
 Don L. Short (Medora) |
Republican | Elected in 1958. Re-elected in 1960. Redistricted to the 2nd district. | |
| August 9, 1960 – January 3, 1961 |
Vacant | |||||||
| January 3, 1961 – January 3, 1963 |
87th |  Hjalmar Nygaard (Enderlin) |
Republican | Elected in 1960. Redistricted to the 1st district. | ||||
1963–1973: districts again
In 1963, following the 1960 census, the delegation was again split between geographic districts, the 1st district and 2nd district.
1973–present: one seat
In 1973, following the 1970 census, the delegation was reduced to one seat, represented statewide by an at-large district.
| Member | Party | Years | Cong ress |
Electoral history |
|---|---|---|---|---|
 Mark Andrews (Mapleton) |
Republican | January 3, 1973 – January 3, 1981 |
93rd 94th 95th 96th |
Redistricted from the 1st district and re-elected in 1972. Re-elected in 1974. Re-elected in 1976. Re-elected in 1978. Retired to run for U.S. Senator. |
 Byron Dorgan (Bismark) |
Democratic–NPL | January 3, 1981 – December 14, 1992 |
97th 98th 99th 100th 101st 102nd |
Elected in 1980. Re-elected in 1982. Re-elected in 1984. Re-elected in 1986. Re-elected in 1988. Re-elected in 1990. Retired to run for U.S. Senator, and resigned when appointed. |
| Vacant | December 15, 1992 – January 3, 1993 |
102nd | ||
 Earl Pomeroy (Valley City) |
Democratic–NPL | January 3, 1993 – January 3, 2011 |
103rd 104th 105th 106th 107th 108th 109th 110th 111th |
Elected in 1992. Re-elected in 1994. Re-elected in 1996. Re-elected in 1998. Re-elected in 2000. Re-elected in 2002. Re-elected in 2004. Re-elected in 2006. Re-elected in 2008. Lost re-election. |
 Rick Berg (Fargo) |
Republican | January 3, 2011 – January 3, 2013 |
112th | Elected in 2010. Retired to run for U.S. Senator. |
.jpg.webp) Kevin Cramer (Bismarck) |
Republican | January 3, 2013 – January 3, 2019 |
113th 114th 115th |
Elected in 2012. Re-elected in 2014. Re-elected in 2016. Retired to run for U.S. Senator. |
 Kelly Armstrong (Dickinson) |
Republican | January 3, 2019 – present |
116th 117th 118th |
Elected in 2018. Re-elected in 2020. Re-elected in 2022. Retiring at end of term to run for governor of North Dakota. |
Recent statewide results
| Year | Results | Party |
|---|---|---|
| 2000 | George W. Bush 61% – Al Gore 33% | Republican |
| 2004 | George W. Bush 63% – John Kerry 36% | Republican |
| 2008 | John McCain 53% – Barack Obama 45% | Republican |
| 2012 | Mitt Romney 59% – Barack Obama 39% | Republican |
| 2016 | Donald Trump 64% – Hillary Clinton 28% | Republican |
| 2020 | Donald Trump 66% – Joe Biden 32% | Republican |
Electoral history
| Year (& Congress) | Candidate | Party | Votes | % |
|---|---|---|---|---|
| October 1, 1889 (51st Congress) |
Republican | 26,077 | 68.4% | |
| D. W. Maratta | Democratic | 12,066 | 31.6% | |
| 1890 (52nd Congress) |
Republican | 21,365 | 59.0% | |
| John D. Benton | Democratic | 14,830 | 41.0% | |
| 1892 (53rd Congress) |
Republican | 17,695 | 48.9% | |
| James F. O'Brien | Democratic | 11,021 | 30.5% | |
| Hans A. Foss | Independent | 7,434 | 20.6% | |
| 1894 (54th Congress) |
Republican | 21,615 | 55.4% | |
| Walter Muir | Populist | 15,660 | 40.2% | |
| Budd Reeve | Independent | 1,283 | 3.3% | |
| Lathrop S. Ellis | Prohibition | 439 | 1.1% | |
| 1896 (55th Congress) |
Republican | 25,233 | 54.0% | |
| John Burke | Fusion | 21,172 | 45.3% | |
| A. V. Garver | Prohibition | 349 | 0.7% | |
| 1898 (56th Congress) |
Republican | 27,766 | 60.9% | |
| H. M. Creel | Fusion | 17,844 | 39.1% | |
| 1900 (57th Congress) |
Republican | 34,887 | 61.0% | |
| M. A. Hildreth | Democratic | 21,175 | 37.0% | |
| Charles H. Mott | Prohibition | 585 | 1.0% | |
| J. C. Charest | Social Democratic | 412 | 0.7% | |
| Martin S. Blair | Populist | 122 | 0.2% | |
| 1902 (58th Congress) |
Republican | 32,986 | 67.6% | |
| Republican | 32,854 | |||
| Lars A. Ueland | Democratic | 14,765 | 29.9% | |
| Verner E. Lovell | Democratic | 14,392 | ||
| Royal F. King | Socialist | 1,195 | 2.5% | |
| 1904 (59th Congress) |
Republican | 49,111 | 72.7% | |
| Republican | 47,648 | |||
| N. P. Rasmussen | Democratic | 15,622 | 23.3% | |
| A. G. Burr | Democratic | 15,398 | ||
| L. F. Dow | Socialist | 1,734 | 2.6% | |
| E. D. Herring | Socialist | 1,697 | ||
| B. H. Tibbets | Prohibition | 971 | 1.5% | |
| N. A. Colby | Prohibition | 967% | ||
| 1906 (60th Congress) |
Republican | 38,923 | 62.9% | |
| Republican | 36,772 | |||
| A. G. Burr | Democratic | 21,350 | 35.2% | |
| John D. Benton | Democratic | 21,050 | ||
| Kittel Halvorson | Socialist | 1,151 | 1.9% | |
| W. J. Bailey | Socialist | 1,129 | ||
| 1908 (61st Congress) |
Republican | 57,357 | 65.7% | |
| Republican | 55,610 | |||
| Tobias D. Casey | Democratic | 29,426 | 33.7% | |
| O. G. Major | Democratic | 28,448 | ||
| Francis Cooper | Independent | 591 | 0.3% | |
| E. D. Herring | Independent | 533 | 0.3% | |
| 1910 (62nd Congress) |
Republican | 51,556 | 63.9% | |
| Republican | 50,600 | |||
| Tobias D. Casey | Democratic | 25,880 | 32.0% | |
| M. A. Hildreth | Democratic | 25,322 | ||
| Arthur Hagendorf | Socialist | 3,225 | 4.0% | |
| N. H. Bjornstad | Socialist | 3,179 | ||
| 1912–1930 | Districts used | |||
| Year (& Congress) | Candidate | Party | Votes | % |
| 1932 (73rd Congress) |
Republican | 144,339 | 65.7% | |
| Republican–NPL | 135,339 | |||
| William D. Lynch | Democratic | 72,659 | 33.9% | |
| R. B. Murphy | Democratic | 71,695 | ||
| Pat J. Barrett | Independent | 690 | 0.3% | |
| Ella Reeve Bloor | Independent | 678% | ||
| 1934 (74th Congress) |
Republican–NPL | 144,605 | 49.9% | |
| Republican–NPL | 114,841 | |||
| William D. Lynch | Democratic | 85,771 | 31.8% | |
| G. F. Lamb | Democratic | 79,338 | ||
| James H. Sinclair | Progressive Republican | 46,304 | 17.8% | |
| Jasper Haaland | Communist | 1,299 | 0.5% | |
| Effie Kjorstad | Communist | 1,090 | ||
| 1936 (75th Congress) |
Republican–NPL | 131,117 | 54.1% | |
| Republican–NPL | 115,913 | |||
| Henry Holt | Democratic | 100,609 | 41.7% | |
| J. J. Nygaard | Democratic | 89,722 | ||
| I. J. Moe | Independent | 3,310 | 1.4% | |
| P. H. Miller | Independent | 3,273 | 1.4% | |
| E. A. Johannson | Independent | 2,697 | 1.2% | |
| Jasper Haaland | Communist | 540 | 0.2% | |
| W. D. Webster | Communist | 461 | ||
| 1938 (76th Congress) |
Republican–NPL | 153,106 | 72.3% | |
| Republican–NPL | 149,047 | |||
| Howard I. Henry | Democratic | 55,125 | 23.9% | |
| Alfred S. Dale | Democratic | 44,691 | ||
| J. B. Field | Independent | 8,109 | 3.9% | |
| 1940 (77th Congress) |
Republican–NPL | 148,227 | 60.3% | |
| Republican | 111,125 | |||
| R. J. Downey | Democratic | 63,662 | 29.4% | |
| Adolph Michelson | Democratic | 63,027 | ||
| Thomas Hall | Independent | 23,399 | 10.3% | |
| John Omland | Independent | 20,845 | ||
| 1942 (78th Congress) |
Republican–NPL | 85,936 | 46.3% | |
| Republican–NPL | 65,905 | |||
| Charles R. Robertson | Independent | 48,472 | 29.5% | |
| Halvor L. Halvorson | Democratic | 47,972 | 24.2% | |
| E. A. Johansson | Democratic | 31,547 | ||
| 1944 (79th Congress) |
Republican–NPL | 101,007 | 50.7% | |
| Republican | 91,425 | |||
| Halvor L. Halvorson | Democratic | 56,699 | 26.9% | |
| J. R. Kennedy | Democratic | 45,308 | ||
| Usher L. Burdick | Independent R | 39,888 | 21.0% | |
| George McClellan | Independent R | 3,135 | 1.4% | |
| A. C. Townley | Independent R | 2,307 | ||
| 1946 (80th Congress) |
Republican–NPL | 103,205 | 74.3% | |
| Republican | 102,087 | |||
| James M. Hanley | Democratic | 41,189 | 25.7% | |
| Edwin Cooper | Democratic | 29,865 | ||
| 1948 (81st Congress) |
Republican–NPL | 132,343 | 69.0% | |
| Republican–NPL | 128,454 | |||
| Alfred Dale | Democratic | 56,702 | 30.0% | |
| John M. Weiler | Progressive | 1,758 | 0.9% | |
| 1950 (82nd Congress) |
Republican | 119,047 | 70.7% | |
| Republican–NPL | 110,534 | |||
| Ervin Schumacher | Democratic | 62,322 | 29.3% | |
| E. A. Johansson | Democratic | 32,946 | ||
| 1952 (83rd Congress) |
Republican–NPL | 181,218 | 77.2% | |
| Republican | 156,829 | |||
| Edward Nesemeier | Democratic | 49,829 | 22.8% | |
| Scattered votes | 49 | 0.0% | ||
| 1954 (84th Congress) |
Republican–NPL | 124,845 | 67.1% | |
| Republican | 106,341 | |||
| P. W. Lanier | Democratic | 64,089 | 32.9% | |
| Raymond G. Vendsel | Democratic | 49,183 | ||
| 1956 (85th Congress) |
Republican–NPL | 143,514 | 62.3% | |
| Republican | 136,003 | |||
| Agnes Geelan | Democratic–NPL | 85,743 | 37.7% | |
| S. B. Hocking | Democratic–NPL | 83,284 | ||
| 1958 (86th Congress) |
Democratic–NPL | 99,562 | 48.4% | |
| Republican | 97,862 | 51.6% | ||
| Orris G. Nordhougen | Republican | 92,124 | ||
| S. B. Hocking | Democratic–NPL | 78,889 | ||
| 1960 (87th Congress) |
Republican | 135,579 | 53.3% | |
| Republican | 127,118 | |||
| Raymond Vendsel | Democratic–NPL | 120,773 | 46.7% | |
| Anson J. Anderson | Democratic–NPL | 109,207 | ||
| 1962–1970 | Districts used | |||
| Year (& Congress) | Candidate | Party | Votes | % |
| 1972 (93rd Congress) |
Republican | 195,360 | 72.7% | |
| Richard Ista | Democratic–NPL | 72,850 | 27.1% | |
| Kenneth C. Gardener Sr. | Independent | 511 | 0.2% | |
| 1974 (94th Congress) |
Republican | 130,184 | 55.7% | |
| Byron Dorgan | Democratic–NPL | 103,504 | 44.3% | |
| 1976 (95th Congress) |
Republican | 181,018 | 62.4% | |
| Lloyd B. Omdahl | Democratic–NPL | 104,263 | 36.0% | |
| Russell Kleppe | American | 4,600 | 1.6% | |
| 1978 (96th Congress) |
Republican | 147,712 | 67.0% | |
| Bruce F. Hagen | Democratic–NPL | 68,016 | 30.9% | |
| Harley J. McLain | Independent | 3,197 | 1.5% | |
| Don J. Klingensmith | Prohibition | 1,389 | 0.6% | |
| 1980 (97th Congress) |
Democratic–NPL | 166,437 | 56.8% | |
| Jim Smykowski | Republican | 124,707 | 42.6% | |
| John Lengenfelder | Independent[4] | 1,004 | 0.3% | |
| Torfin A. Teigen | Independent | 928 | 0.3% | |
| 1982 (98th Congress) |
Democratic–NPL | 186,534 | 71.6% | |
| Kent Jones | Republican | 72,241 | 27.7% | |
| Don J. Klingensmith | Prohibition | 1,724 | 0.7% | |
| 1984 (99th Congress) |
Democratic–NPL | 242,968 | 78.7% | |
| Lois Ivers Altenburg | Republican | 65,761 | 21.3% | |
| 1986 (100th Congress) |
Democratic–NPL | 216,258 | 75.5% | |
| Syver Vinje | Republican | 66,989 | 23.4% | |
| Gerald W. Kopp | Independent | 3,114 | 1.1% | |
| 1988 (101st Congress) |
Democratic–NPL | 212,583 | 70.9% | |
| Steve Sydness | Republican | 84,475 | 28.2% | |
| Kris Brekke | Libertarian | 2,924 | 1.0% | |
| 1990 (102nd Congress) |
Democratic–NPL | 152,530 | 65.2% | |
| Ed Schafer | Republican | 81,443 | 34.8% | |
| Other | 6 | 0.0% | ||
| 1992 (103rd Congress) |
Democratic–NPL | 169,273 | 56.8% | |
| John T. Korsmo | Republican | 117,442 | 39.4% | |
| Other | 11,183 | 3.8% | ||
| 1994 (104th Congress) |
Democratic–NPL | 123,134 | 52.3% | |
| Gary Porter | Republican | 105,988 | 45.0% | |
| James Germalic | Independent | 6,267 | 2.7% | |
| 1996 (105th Congress) |
Democratic–NPL | 144,833 | 55.1% | |
| Kevin Cramer | Republican | 113,684 | 43.2% | |
| Kenneth R. Loughead | Independent | 4,493 | 1.7% | |
| 1998 (106th Congress) |
Democratic–NPL | 119,668 | 56.2% | |
| Kevin Cramer | Republican | 87,511 | 41.1% | |
| Kenneth R. Loughead | Independent | 5,709 | 2.7% | |
| 2000 (107th Congress) |
Democratic–NPL | 151,173 | 52.9% | |
| John Dorso | Republican | 127,251 | 44.5% | |
| Jan Shelver | Independent | 4,731 | 1.7% | |
| Kenneth R. Loughead | Independent | 2,481 | 0.9% | |
| Write-in | 22 | 0.0% | ||
| 2002 (108th Congress) |
Democratic–NPL | 121,073 | 52.4% | |
| Rick Clayburgh | Republican | 109,957 | 47.6% | |
| 2004 (109th Congress) |
Democratic–NPL | 185,130 | 59.6% | |
| Duane Sand | Republican | 125,684 | 40.4% | |
| 2006 (110th Congress) |
Democratic–NPL | 142,934 | 65.7% | |
| Matt Mechtel | Republican | 74,687 | 34.3% | |
| 2008 (111th Congress) |
Democratic–NPL | 194,175 | 62.1% | |
| Duane Sand | Republican | 118,519 | 37.9% | |
| 2010 (112th Congress) |
Republican | 129,802 | 54.7% | |
| Earl Pomeroy | Democratic–NPL | 106,542 | 44.9% | |
| Write-in | 793 | 0.4% | ||
| 2012 (113th Congress) |
Republican | 172,905 | 55.0% | |
| Pam Gulleson | Democratic–NPL | 131,396 | 41.8% | |
| Eric Olson | Libertarian | 10,125 | 3.2% | |
| 2014 (114th Congress) |
Republican | 138,100 | 55.5% | |
| George B. Sinner | Democratic–NPL | 95,678 | 38.5% | |
| Robert J. "Jack" Seaman | Libertarian | 14,531 | 5.8% | |
| 2016 (115th Congress) |
Republican | 233,980 | 69.1% | |
| Chase Iron Eyes | Democratic–NPL | 80,377 | 23.8% | |
| Robert J. "Jack" Seaman | Libertarian | 23,528 | 7% | |
| 2018 (116th Congress) |
Republican | 193,568 | 60.2% | |
| Mac Schneider | Democratic–NPL | 114,377 | 35.6% | |
| Charles Tuttle | Independent | 13,066 | 4.1% | |
| Write-in | 521 | 0.16% | ||
| 2020 (117th Congress) |
Republican | 245,229 | 68.96% | |
| Zach Raknerud | Democratic–NPL | 97,970 | 27.55% | |
| Steven Peterson | Libertarian | 12,024 | 3.38% | |
| Write-in | 375 | 0.11% | ||
| 2022 (118th Congress) |
Republican | 148,399 | 62.20% | |
| Cara Mund | Independent | 89,644 | 37.76% | |
| Write-in | 543 | 0.23% | ||
| Year (& Congress) | Candidate | Party | Votes | % |
2006
| Party | Candidate | Votes | % | ±% | |
|---|---|---|---|---|---|
| Democratic–NPL | Earl Pomeroy (Incumbent) | 142,934 | 65.68% | +6.11% | |
| Republican | Matt Mechtel | 74,687 | 34.32% | −6.11% | |
| Democratic–NPL hold | Swing | ||||
| Turnout | 217,621 | ||||
2008
| Party | Candidate | Votes | % | ±% | |
|---|---|---|---|---|---|
| Democratic–NPL | Earl Pomeroy (Incumbent) | 194,577 | 61.97% | -3.71% | |
| Republican | Duane Sand | 119,388 | 38.03% | +3.71% | |
| Democratic–NPL hold | Swing | ||||
| Turnout | 313,965 | ||||
2010
| Party | Candidate | Votes | % | ±% | |
|---|---|---|---|---|---|
| Republican | Rick Berg | 129,802 | 54.74% | +16.71% | |
| Democratic–NPL | Earl Pomeroy (Incumbent) | 106,542 | 44.93% | −17.04% | |
| Independent | Write-In Votes | 793 | 0.33% | ||
| Republican gain from Democratic–NPL | Swing | ||||
| Turnout | 237,137 | ||||
2012
| Party | Candidate | Votes | % | ±% | |
|---|---|---|---|---|---|
| Republican | Kevin Cramer | 173,585 | 54.89% | +0.15% | |
| Democratic–NPL | Pam Gulleson | 131,870 | 41.70% | −3.23% | |
| Libertarian | Eric Olson | 10,261 | 3.24% | +3.24% | |
| Independent | Write-In Votes | 508 | 0.16% | ||
| Republican hold | Swing | ||||
| Turnout | 316,224 | ||||
2014
| Party | Candidate | Votes | % | ±% | |
|---|---|---|---|---|---|
| Republican | Kevin Cramer (Incumbent) | 138,100 | 55.54% | +0.65% | |
| Democratic–NPL | George B. Sinner | 95,678 | 38.48% | −3.22% | |
| Libertarian | Robert J. "Jack" Seaman | 14,531 | 5.84% | +2.6% | |
| Independent | Write-In Votes | 361 | 0.15% | ||
| Republican hold | Swing | ||||
| Turnout | 248,670 | ||||
2016
| Party | Candidate | Votes | % | ±% | |
|---|---|---|---|---|---|
| Republican | Kevin Cramer (Incumbent) | 233,980 | 69.13% | +13.59% | |
| Democratic–NPL | Chase Iron Eyes | 80,377 | 23.75% | −14.73% | |
| Libertarian | Robert J. "Jack" Seaman | 23,528 | 6.95% | +1.11% | |
| Independent | Write-In Votes | 574 | 0.17% | ||
| Republican hold | Swing | ||||
| Turnout | 338,459 | ||||
2018
| Party | Candidate | Votes | % | ±% | |
|---|---|---|---|---|---|
| Republican | Kelly Armstrong | 193,568 | 60.20% | -8.93% | |
| Democratic–NPL | Mac Schneider | 114,377 | 35.57% | +11.82% | |
| Independent | Charles Tuttle | 13,066 | 4.06% | ||
| n/a | Write-ins | 521 | 0.16% | ||
| Total votes | 321,532 | 100.00% | |||
| Republican hold | |||||
2020
| Party | Candidate | Votes | % | ±% | |
|---|---|---|---|---|---|
| Republican | Kelly Armstrong (incumbent) | 245,229 | 68.96% | +8.76% | |
| Democratic–NPL | Zach Raknerud | 97,970 | 27.55% | -8.02% | |
| Libertarian | Steven Peterson | 12,024 | 3.38% | New | |
| n/a | Write-ins | 375 | 0.11% | -0.15% | |
| Total votes | 355,595 | 100.0% | |||
| Republican hold | |||||
2022
| Party | Candidate | Votes | % | ±% | |
|---|---|---|---|---|---|
| Republican | Kelly Armstrong (incumbent) | 148,399 | 62.20% | –6.76 | |
| Independent | Cara Mund | 89,644 | 37.57% | N/A | |
| Write-in | 543 | 0.23% | +0.12 | ||
| Total votes | 238,586 | 100.00% | |||
| Republican hold | |||||
References
- "My Congressional District".
- "My Congressional District".
- "2022 Cook PVI: District Map and List". The Cook Political Report. July 12, 2022. Retrieved January 7, 2023.
- John Lengenfelder described himself as "Academic Christian Freedom, Prolife-Family" when filing for election.
- Johnson, Cheryl L. (February 28, 2019). "Statistics of the Congressional Election of November 6, 2018". Clerk of the U.S. House of Representatives. Retrieved April 27, 2019.
- Election statistics compiled by the Clerk to the House of Representatives; Michael J. Dubin, "United States Congressional Elections 1788-1997" (McFarland, 1998).
- Martis, Kenneth C. (1989). The Historical Atlas of Political Parties in the United States Congress. New York: Macmillan Publishing Company.
- Martis, Kenneth C. (1982). The Historical Atlas of United States Congressional Districts. New York: Macmillan Publishing Company.
- Congressional Biographical Directory of the United States 1774–present