List of countries by greenhouse gas emissions per capita
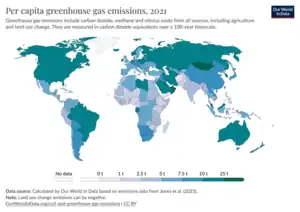
This is a list of sovereign states and territories by per capita greenhouse gas emissions due to certain forms of human activity, based on the EDGAR database created by European Commission. The following table lists the 1970, 1990, 2005, 2017 and 2022 annual per capita GHG[n 1] emissions estimates (in metric tons of CO2 equivalent per year). The data include carbon dioxide (CO2), methane (CH4) and nitrous oxide (N2O) from all sources, including agriculture and land use change. They are measured in carbon dioxide-equivalents over a 100-year timescale.[n 2]
%253B_variwide_diagram.png.webp)

The Intergovernmental Panel on Climate Change (IPCC) 6th assessment report finds that the “Agriculture, Forestry and Other Land Use (AFOLU)” sector on average, accounted for 13-21% of global total anthropogenic GHG emissions in the period 2010-2019.[4] Land use change drivers net AFOLU CO2 emission fluxes, with deforestation being responsible for 45% of total AFOLU emissions. In addition to being a net carbon sink and source of GHG emissions, land plays an important role in climate through albedo effects, evapotranspiration, and aerosol loading through emissions of volatile organic compounds.[4] The IPCC report finds that the LULUCF sector offers significant near-term mitigation potential while providing food, wood and other renewable resources as well as biodiversity conservation. Mitigation measures in forests and other natural ecosystems provide the largest share of the LULUCF mitigation potential between 2020 and 2050. Among various LULUCF activities, reducing deforestation has the largest potential to reduce anthropogenic GHG emissions, followed by carbon sequestration in agriculture and ecosystem restoration including afforestation and reforestation.[4] Land use change emissions can be negative.[n 3][6]
According to Science for Policy report in 2023 by the Joint Research Centre (JRC - the European Commission’s science and knowledge service) and International Energy Agency (IEA), global per-capita emissions in 2022 increased by 0.4% to reach 6.76 tCO2eq/cap, a value still 0.8% lower than in 2019, but have increased by about 8.3% from 6.24 tCO2eq/cap to 6.76 tCO2eq/cap between 1990 and 2022.[7]
The main advantage of measuring total national emissions per capita is that it does take population size into account. China has the largest CO2 and GHG emissions in the world, but also the largest population. For a fair comparison, emissions should be analyzed in terms of the amount of CO2 and GHG per capita.[8]
In 2022, China's GHG per capita emissions levels (10.95) are almost 60 percent those of the United States (17.90) and less than a sixth of those of Qatar (67.38 - the country with the highest emissions of GHG per capita in 2022).[9][7]
Measures of territorial-based emissions, also known as production-based emissions, do not account for emissions embedded in global trade, where emissions may be imported or exported in the form of traded goods, as it only reports emissions emitted within geographical boundaries. Accordingly, a proportion of the CO2 produced and reported in Asia and Africa is for the production of goods consumed in Europe and North America.[10]
According to the review of the scientific literature conducted by the Intergovernmental Panel on Climate Change (IPCC), carbon dioxide is the most important anthropogenic greenhouse gas by warming contribution.[11] Greenhouse gases (GHG) – primarily carbon dioxide but also others, including methane and chlorofluorocarbons – trap heat in the atmosphere, leading to global warming. Higher temperatures then act on the climate, with varying effects. For example, dry regions might become drier while, at the poles, the ice caps are melting, causing higher sea levels. In 2016, the global average temperature was already 1.1 °C above pre-industrial levels.[12]
GHG emissions
Per capita GHG emissions by country/territory
The data in the following table is extracted from EDGAR - Emissions Database for Global Atmospheric Research.[7]
| Country/territory | Per capita GHG emissions (tCO2eq/cap/year) | % of global average | Change (1990=100%) | ||||
|---|---|---|---|---|---|---|---|
| 1970 | 1990 | 2005 | 2017 | 2022 | 2022 | 2022 | |
| 0.7649 | 3.4494 | 4.6250 | 4.4383 | 4.6419 | 66.55% | 134.57% | |
| 1.5582 | 1.1246 | 0.7256 | 0.8943 | 0.7320 | 10.49% | 65.09% | |
| 2.9718 | 2.8721 | 3.7608 | 2.7494 | 1.9001 | 27.24% | 66.16% | |
| 0.6647 | 1.0615 | 1.4256 | 2.3137 | 1.8733 | 26.86% | 176.48% | |
| 3.8414 | 3.5253 | 2.6209 | 3.1675 | 2.7090 | 38.84% | 76.84% | |
| 104.9792 | 19.4718 | 47.4995 | 25.9846 | 13.0574 | 187.19% | 67.06% | |
| 124.7347 | 45.5802 | 37.0405 | 28.8280 | 29.3321 | 420.51% | 64.35% | |
| 9.3109 | 8.0254 | 8.8089 | 8.5647 | 8.2695 | 118.55% | 103.04% | |
| 6.0791 | 6.8887 | 2.4921 | 2.9429 | 3.1895 | 45.73% | 46.30% | |
| 2.5408 | 3.6972 | 2.9719 | 3.2910 | 3.3629 | 48.21% | 90.96% | |
| 24.5283 | 26.8298 | 28.4892 | 24.5828 | 21.9788 | 315.09% | 81.92% | |
| 9.6439 | 10.5526 | 11.7376 | 9.8306 | 8.7001 | 124.73% | 82.44% | |
| 8.9336 | 9.6382 | 5.4410 | 5.8799 | 6.7184 | 96.32% | 69.71% | |
| 0.6612 | 0.5649 | 0.5027 | 0.6649 | 0.5901 | 8.46% | 104.47% | |
| 17.6706 | 14.2711 | 13.8273 | 10.8661 | 9.7372 | 139.60% | 68.23% | |
| 0.8650 | 0.8439 | 1.0974 | 1.4858 | 1.6184 | 23.20% | 191.77% | |
| 1.2092 | 1.2806 | 1.5424 | 1.6306 | 1.6512 | 23.67% | 128.94% | |
| 2.0138 | 1.3176 | 1.2519 | 1.6287 | 1.6226 | 23.26% | 123.15% | |
| 10.7745 | 11.8745 | 8.6878 | 9.2194 | 9.9961 | 143.31% | 84.18% | |
| 85.6662 | 60.9441 | 49.1842 | 42.2064 | 39.2904 | 563.28% | 64.47% | |
| 9.3651 | 5.0322 | 3.4778 | 4.2369 | 4.5448 | 65.16% | 90.32% | |
| 4.3692 | 7.3464 | 6.1478 | 9.0032 | 8.4143 | 120.63% | 114.54% | |
| 9.1624 | 13.4610 | 8.4583 | 10.7095 | 10.6498 | 152.68% | 79.12% | |
| 2.3998 | 2.6417 | 2.1218 | 2.4680 | 2.3590 | 33.82% | 89.30% | |
| 3.1404 | 4.4821 | 3.2140 | 4.8578 | 5.8975 | 84.55% | 131.58% | |
| 6.0884 | 4.5620 | 3.9963 | 5.1223 | 4.9244 | 70.60% | 107.94% | |
| 3.8317 | 4.6577 | 5.7109 | 6.2021 | 6.0493 | 86.72% | 129.88% | |
| 2.2795 | 3.2988 | 3.2382 | 2.9967 | 3.2221 | 46.19% | 97.68% | |
| 24.7537 | 31.6193 | 31.3981 | 31.8497 | 32.6639 | 468.28% | 103.30% | |
| 2.4478 | 2.1605 | 2.8212 | 3.6890 | 3.6001 | 51.61% | 166.64% | |
| 4.9686 | 6.7738 | 5.4616 | 5.2938 | 5.0509 | 72.41% | 74.57% | |
| 0.9900 | 2.6613 | 2.4925 | 2.6455 | 2.6205 | 37.57% | 98.47% | |
| 21.6364 | 21.0223 | 23.0802 | 21.1034 | 19.7900 | 283.72% | 94.14% | |
| 8.2995 | 8.2164 | 7.6023 | 5.8065 | 5.1842 | 74.32% | 63.10% | |
| 5.3883 | 4.5871 | 5.9173 | 7.1143 | 7.3135 | 104.85% | 159.44% | |
| 2.5978 | 3.4744 | 6.3800 | 9.7268 | 10.9541 | 157.04% | 315.28% | |
| 1.2741 | 0.9194 | 1.1062 | 1.2947 | 1.3156 | 18.86% | 143.10% | |
| 1.2176 | 2.6689 | 1.8638 | 1.6933 | 1.5826 | 22.69% | 59.30% | |
| 0.6502 | 0.8255 | 0.5657 | 0.6919 | 0.6473 | 9.28% | 78.41% | |
| 1.8610 | 4.6982 | 5.5734 | 4.3262 | 4.3386 | 62.20% | 92.35% | |
| 1.2963 | 2.7866 | 5.0923 | 7.5248 | 6.9550 | 99.71% | 249.59% | |
| 3.9487 | 4.0589 | 3.8068 | 3.9454 | 4.2330 | 60.69% | 104.29% | |
| 1.0427 | 0.8335 | 0.8758 | 0.9548 | 1.0167 | 14.58% | 121.98% | |
| 0.9219 | 0.6713 | 1.8100 | 2.0283 | 2.2394 | 32.10% | 333.61% | |
| 3.2410 | 3.2315 | 2.9288 | 3.2729 | 3.2875 | 47.13% | 101.73% | |
| 5.3887 | 6.0051 | 4.0794 | 4.1406 | 3.8575 | 55.30% | 64.24% | |
| 3.2873 | 4.9026 | 3.3316 | 4.7272 | 5.3052 | 76.06% | 108.21% | |
| 4.7946 | 7.2374 | 8.9317 | 7.7969 | 8.6846 | 124.50% | 120.00% | |
| 22.0902 | 19.0696 | 14.7346 | 12.5717 | 11.7095 | 167.87% | 61.40% | |
| 16.8270 | 15.6125 | 12.0448 | 10.8865 | 9.4925 | 136.09% | 60.80% | |
| 6.2532 | 3.2060 | 2.5130 | 2.1185 | 2.1715 | 31.13% | 67.73% | |
| 0.5578 | 1.2292 | 1.8127 | 1.9009 | 1.9650 | 28.17% | 159.87% | |
| 16.3104 | 13.5102 | 12.4052 | 8.6925 | 7.8376 | 112.36% | 58.01% | |
| 2.2721 | 2.5150 | 3.3456 | 3.7410 | 3.6964 | 52.99% | 146.97% | |
| 3.9244 | 5.6300 | 5.6578 | 6.4114 | 6.3798 | 91.46% | 113.32% | |
| 2.3396 | 3.7687 | 4.1212 | 4.2246 | 4.3227 | 61.97% | 114.70% | |
| 1.7759 | 2.6653 | 3.6320 | 3.8814 | 3.5500 | 50.89% | 133.19% | |
| 2.3034 | 1.5522 | 1.4521 | 1.2879 | 1.2241 | 17.55% | 78.87% | |
| 1.4039 | 1.1075 | 1.0425 | 0.8117 | 0.7834 | 11.23% | 70.74% | |
| 5.6756 | 7.6392 | 10.3449 | 7.7118 | 7.0780 | 101.47% | 92.65% | |
| 14.8696 | 27.5315 | 16.7695 | 19.3335 | 10.6801 | 153.11% | 38.79% | |
| 1.9050 | 1.3773 | 1.2409 | 1.4879 | 1.6302 | 23.37% | 118.37% | |
| 14.4428 | 17.1245 | 16.6292 | 12.1147 | 9.7570 | 139.88% | 56.98% | |
| 2.7714 | 3.0130 | 4.0117 | 3.1684 | 3.1863 | 45.68% | 105.75% | |
| 1.8981 | 3.5436 | 4.2584 | 6.3754 | 8.3478 | 119.68% | 235.57% | |
| 12.5433 | 9.3957 | 8.9243 | 7.2271 | 6.5026 | 93.22% | 69.21% | |
| 1.1848 | 1.0171 | 1.0302 | 1.0278 | 1.0006 | 14.34% | 98.38% | |
| 11.5538 | 21.4146 | 18.7718 | 9.8226 | 8.3229 | 119.32% | 38.87% | |
| 15.8214 | 13.7490 | 11.3097 | 7.1129 | 6.2677 | 89.86% | 45.59% | |
| 6.2205 | 7.7858 | 2.5098 | 4.3578 | 4.6558 | 66.75% | 59.80% | |
| 0.8812 | 0.7738 | 0.8964 | 1.4052 | 1.6555 | 23.73% | 213.95% | |
| 2.8905 | 5.4795 | 13.3521 | 19.6035 | 19.6847 | 282.21% | 359.24% | |
| 1.2257 | 1.3079 | 1.4237 | 1.9822 | 2.0228 | 29.00% | 154.66% | |
| 1.4378 | 2.4861 | 2.2556 | 2.6496 | 2.8126 | 40.32% | 113.14% | |
| 1.6359 | 1.0611 | 1.0594 | 1.0095 | 0.9656 | 13.84% | 90.99% | |
| 1.1864 | 1.6433 | 1.5804 | 1.5761 | 1.5474 | 22.18% | 94.17% | |
| 0.3753 | 0.4271 | 22.5438 | 13.0761 | 7.7116 | 110.55% | 1,805.62% | |
| 5.2395 | 9.7101 | 11.4126 | 8.0485 | 6.8844 | 98.70% | 70.90% | |
| 0.6722 | 1.0501 | 1.2455 | 1.7137 | 1.7484 | 25.07% | 166.50% | |
| 1.1306 | 1.1731 | 12.1861 | 10.3195 | 9.4650 | 135.69% | 806.85% | |
| 1.5921 | 1.5275 | 2.0925 | 2.3252 | 2.4233 | 34.74% | 158.64% | |
| 2.5239 | 3.2088 | 1.7705 | 1.9732 | 1.8354 | 26.31% | 57.20% | |
| 7.2327 | 5.1785 | 5.9220 | 7.7026 | 9.7509 | 139.79% | 188.30% | |
| 3.1200 | 6.9141 | 7.0834 | 6.8568 | 5.1210 | 73.42% | 74.07% | |
| 2.2248 | 1.9480 | 2.2414 | 2.3164 | 2.3704 | 33.98% | 121.69% | |
| 6.5003 | 7.1325 | 6.8537 | 6.3346 | 5.9419 | 85.19% | 83.31% | |
| 1.3679 | 1.1163 | 1.2145 | 1.3523 | 1.2797 | 18.35% | 114.64% | |
| 8.8554 | 9.3259 | 7.9556 | 7.3498 | 6.9320 | 99.38% | 74.33% | |
| 1.8974 | 2.3570 | 3.0625 | 3.8629 | 4.4727 | 64.12% | 189.76% | |
| 1.4774 | 1.6510 | 1.9256 | 2.6808 | 2.7938 | 40.05% | 169.22% | |
| 13.5604 | 16.1354 | 17.8827 | 13.9912 | 12.5794 | 180.34% | 77.96% | |
| 7.4667 | 5.9183 | 9.7066 | 11.5560 | 11.2022 | 160.60% | 189.28% | |
| 10.1392 | 9.7105 | 6.0666 | 8.6414 | 8.4128 | 120.61% | 86.64% | |
| 15.7941 | 17.3601 | 14.4635 | 13.7025 | 13.7018 | 196.43% | 78.93% | |
| 18.3425 | 6.4673 | 7.2639 | 6.6248 | 6.0236 | 86.36% | 93.14% | |
| 7.3900 | 8.9929 | 9.8698 | 7.1226 | 6.6978 | 96.02% | 74.48% | |
| 5.0203 | 3.8320 | 4.5902 | 3.0867 | 2.6357 | 37.79% | 68.78% | |
| 2.1702 | 3.5224 | 4.4790 | 3.6789 | 3.3195 | 47.59% | 94.24% | |
| 9.7420 | 10.6156 | 10.9292 | 10.2517 | 9.4097 | 134.90% | 88.64% | |
| 19.7911 | 21.1327 | 15.6464 | 16.9688 | 17.3295 | 248.44% | 82.00% | |
| 2.2139 | 1.8235 | 1.6605 | 1.9326 | 2.1022 | 30.14% | 115.28% | |
| 6.7548 | 7.7072 | 2.3732 | 3.3253 | 3.3967 | 48.70% | 44.07% | |
| 3.7601 | 2.2583 | 2.1796 | 2.6546 | 2.9135 | 41.77% | 129.01% | |
| 0.5319 | 0.4850 | 0.9841 | 0.9766 | 0.8732 | 12.52% | 180.05% | |
| 1.4580 | 1.6254 | 2.2917 | 2.6074 | 2.6430 | 37.89% | 162.61% | |
| 3.2078 | 7.6969 | 11.9593 | 14.6237 | 14.0059 | 200.79% | 181.97% | |
| 98.2124 | 23.7512 | 51.5999 | 34.8389 | 37.9606 | 544.21% | 159.83% | |
| 2.6855 | 1.9350 | 2.0396 | 4.9847 | 5.0097 | 71.82% | 258.89% | |
| 3.0325 | 2.9818 | 5.2624 | 5.9721 | 5.4343 | 77.91% | 182.25% | |
| 1.1782 | 0.8537 | 0.8271 | 0.9236 | 0.9903 | 14.20% | 116.00% | |
| 61.7055 | 19.5265 | 18.1573 | 13.3933 | 15.3179 | 219.60% | 78.45% | |
| 0.8839 | 1.1842 | 1.4707 | 1.8922 | 2.3685 | 33.96% | 200.02% | |
| 1.6428 | 1.3331 | 1.6561 | 1.9528 | 1.8301 | 26.24% | 137.27% | |
| 1.9118 | 1.3759 | 1.4518 | 1.3681 | 1.2697 | 18.20% | 92.28% | |
| 9.1018 | 12.6166 | 6.4817 | 7.9723 | 7.3716 | 105.68% | 58.43% | |
| 56.6723 | 33.1851 | 28.5517 | 17.3924 | 13.6925 | 196.30% | 41.26% | |
| 7.6070 | 10.2335 | 5.2142 | 6.0593 | 5.9751 | 85.66% | 58.39% | |
| 1.4680 | 2.9391 | 4.7738 | 5.4069 | 3.5924 | 51.50% | 122.23% | |
| 1.5010 | 1.8188 | 2.4323 | 2.8642 | 3.0271 | 43.40% | 166.44% | |
| 5.8067 | 8.5807 | 2.6891 | 2.9301 | 3.0870 | 44.26% | 35.98% | |
| 3.1905 | 2.1766 | 1.5362 | 1.3442 | 1.1989 | 17.19% | 55.08% | |
| 0.2726 | 0.6831 | 2.6507 | 4.7793 | 5.1361 | 73.63% | 751.86% | |
| 4.1894 | 5.4643 | 6.5268 | 6.2149 | 5.9902 | 85.88% | 109.62% | |
| 7.1522 | 7.2480 | 6.0378 | 5.1853 | 5.3537 | 76.75% | 73.86% | |
| 2.0495 | 1.5817 | 1.7514 | 2.2184 | 2.2953 | 32.91% | 145.12% | |
| 2.4732 | 6.8321 | 7.1829 | 4.6739 | 4.9958 | 71.62% | 73.12% | |
| 2.7194 | 1.7911 | 2.2907 | 2.9505 | 3.0400 | 43.58% | 169.73% | |
| 12.4118 | 11.8694 | 9.9205 | 20.3731 | 19.0736 | 273.44% | 160.70% | |
| 1.1239 | 0.7836 | 0.8578 | 1.2047 | 1.1727 | 16.81% | 149.66% | |
| 4.9570 | 3.2755 | 3.3234 | 3.3211 | 3.3121 | 47.48% | 101.12% | |
| 1.2523 | 2.5640 | 2.2038 | 2.7412 | 2.8010 | 40.16% | 109.25% | |
| 1.0923 | 1.8732 | 3.1428 | 4.7854 | 5.0110 | 71.84% | 267.52% | |
| 0.5950 | 0.6778 | 0.7466 | 0.8748 | 0.9754 | 13.98% | 143.91% | |
| 3.0667 | 5.2550 | 9.5902 | 9.7373 | 10.4986 | 150.51% | 199.78% | |
| 8.3860 | 4.6925 | 5.2638 | 4.9173 | 4.6696 | 66.94% | 99.51% | |
| 12.8442 | 11.2419 | 13.5082 | 19.2977 | 19.3466 | 277.36% | 172.09% | |
| 2.5076 | 1.4575 | 1.5847 | 1.6077 | 1.6649 | 23.87% | 114.23% | |
| 3.3347 | 3.0158 | 2.8788 | 2.1413 | 1.8801 | 26.95% | 62.34% | |
| 3.8467 | 2.5610 | 2.7847 | 3.2132 | 3.2129 | 46.06% | 125.45% | |
| 14.0281 | 15.2580 | 13.8161 | 12.1079 | 9.7151 | 139.28% | 63.67% | |
| 14.2414 | 14.8128 | 16.0845 | 13.9222 | 12.6019 | 180.66% | 85.07% | |
| 2.1097 | 1.6857 | 1.4629 | 1.8223 | 1.8364 | 26.33% | 108.94% | |
| 20.3227 | 20.7595 | 21.2997 | 18.6948 | 16.8268 | 241.23% | 81.06% | |
| 19.5791 | 18.4668 | 26.5395 | 26.1552 | 25.5861 | 366.81% | 138.55% | |
| 1.8074 | 1.9970 | 2.2814 | 2.6027 | 2.5303 | 36.28% | 126.71% | |
| 4.2001 | 2.9809 | 3.8838 | 4.0865 | 4.1861 | 60.01% | 140.43% | |
| 2.9515 | 2.1535 | 2.4027 | 3.0008 | 3.0873 | 44.26% | 143.37% | |
| 2.5324 | 1.7727 | 1.8888 | 2.2816 | 2.3498 | 33.69% | 132.56% | |
| 187.2569 | 154.1787 | 92.4898 | 57.7687 | 61.6548 | 883.90% | 39.99% | |
| 0.7341 | 0.8922 | 1.5159 | 1.4328 | 1.0001 | 14.34% | 112.10% | |
| 14.9084 | 13.5587 | 10.7404 | 10.8409 | 10.6204 | 152.26% | 78.33% | |
| 11.3121 | 6.1714 | 7.5916 | 3.8213 | 4.1924 | 60.10% | 67.93% | |
| 6.9455 | 8.3692 | 4.7508 | 3.2948 | 3.1198 | 44.73% | 37.28% | |
| 3.4419 | 5.9744 | 7.9614 | 6.9886 | 5.8842 | 84.36% | 98.49% | |
| 4.3090 | 5.0738 | 4.5954 | 6.3478 | 6.3005 | 90.33% | 124.18% | |
| 1.9282 | 4.8424 | 4.5120 | 4.2014 | 3.8167 | 54.72% | 78.82% | |
| 221.8389 | 61.0367 | 96.4841 | 72.2900 | 67.3770 | 965.94% | 110.39% | |
| 1.0653 | 1.9049 | 3.4830 | 3.4872 | 3.4622 | 49.64% | 181.75% | |
| 8.7946 | 10.4632 | 6.5383 | 6.1493 | 6.0963 | 87.40% | 58.26% | |
| 14.6855 | 20.6903 | 15.4700 | 16.2459 | 17.9851 | 257.84% | 86.92% | |
| 1.1582 | 0.8596 | 0.6163 | 0.6641 | 0.6607 | 9.47% | 76.87% | |
| 13.0766 | 14.6012 | 19.5139 | 23.5159 | 22.6425 | 324.61% | 155.07% | |
| 5.3406 | 8.4412 | 7.8311 | 7.6314 | 7.5445 | 108.16% | 89.38% | |
| 2.8221 | 2.4397 | 3.0181 | 2.6340 | 2.4197 | 34.69% | 99.18% | |
| 1.8838 | 1.3846 | 1.5070 | 1.6351 | 1.6884 | 24.21% | 121.94% | |
| 3.6907 | 11.3521 | 11.4036 | 12.3314 | 11.6671 | 167.26% | 102.78% | |
| 0.7919 | 1.9692 | 2.6657 | 4.6060 | 5.0835 | 72.88% | 258.15% | |
| 0.8550 | 0.8737 | 1.0462 | 0.9601 | 0.8837 | 12.67% | 101.14% | |
| 1.1909 | 0.9437 | 0.8840 | 0.9273 | 0.8504 | 12.19% | 90.12% | |
| 1.6255 | 1.4799 | 2.1611 | 1.8747 | 1.9972 | 28.63% | 134.95% | |
| 5.4310 | 3.4263 | 2.9148 | 2.1010 | 1.9521 | 27.99% | 56.98% | |
| 7.6473 | 14.9676 | 4.5041 | 6.5081 | 6.3008 | 90.33% | 42.10% | |
| 0.5496 | 0.7606 | 1.0249 | 1.1514 | 1.1558 | 16.57% | 151.97% | |
| 5.5899 | 4.7176 | 5.3072 | 6.4743 | 7.6666 | 109.91% | 162.51% | |
| 12.7608 | 14.1274 | 9.6596 | 8.7082 | 8.3604 | 119.86% | 59.18% | |
| 8.8698 | 10.6785 | 11.8559 | 9.6593 | 8.7822 | 125.90% | 82.24% | |
| 14.4306 | 9.2461 | 9.0102 | 6.6710 | 5.9141 | 84.79% | 63.96% | |
| 4.2549 | 3.8833 | 3.0469 | 2.2599 | 2.2792 | 32.67% | 58.69% | |
| 2.5849 | 4.6775 | 11.8434 | 12.5403 | 12.3647 | 177.26% | 264.34% | |
| 2.5071 | 5.1500 | 4.8997 | 2.4603 | 2.2628 | 32.44% | 43.94% | |
| 0.9169 | 0.9260 | 1.6760 | 2.6859 | 2.6511 | 38.01% | 286.29% | |
| 2.4968 | 1.8695 | 3.6305 | 4.7132 | 5.2065 | 74.64% | 278.49% | |
| 0.9432 | 0.9424 | 1.0669 | 1.1432 | 1.2618 | 18.09% | 133.90% | |
| 3.2638 | 3.9217 | 5.8262 | 6.5104 | 6.6680 | 95.59% | 170.03% | |
| 4.5367 | 4.2253 | 1.7625 | 2.0570 | 2.3214 | 33.28% | 54.94% | |
| 20.5351 | 23.5183 | 21.0881 | 21.3834 | 20.7968 | 298.15% | 88.43% | |
| 1.1820 | 0.7914 | 1.9883 | 2.4188 | 1.7180 | 24.63% | 217.09% | |
| 0.9358 | 1.9887 | 2.3536 | 2.7408 | 2.5144 | 36.05% | 126.44% | |
| 9.9754 | 14.8896 | 39.9716 | 37.2419 | 33.2688 | 476.95% | 223.44% | |
| 2.1448 | 2.9058 | 3.6128 | 3.7739 | 4.1075 | 58.89% | 141.35% | |
| 2.9383 | 4.2299 | 4.9558 | 7.4005 | 8.0867 | 115.93% | 191.18% | |
| 3.7070 | 6.9210 | 14.6946 | 13.5154 | 12.8614 | 184.38% | 185.83% | |
| 1.5528 | 1.2243 | 1.2928 | 1.3534 | 1.3418 | 19.24% | 109.60% | |
| 1.3988 | 1.0581 | 0.9983 | 1.0947 | 1.1243 | 16.12% | 106.26% | |
| 13.8286 | 18.5010 | 9.4685 | 6.3480 | 4.8356 | 69.32% | 26.14% | |
| 10.3644 | 9.5334 | 11.4641 | 11.8874 | 11.9124 | 170.78% | 124.95% | |
| 27.4349 | 24.4080 | 24.0636 | 18.8335 | 17.9011 | 256.63% | 73.34% | |
| 9.0830 | 8.6584 | 7.2261 | 6.3621 | 6.6733 | 95.67% | 77.07% | |
| 0.6160 | 0.8178 | 1.1755 | 1.5549 | 1.3925 | 19.96% | 170.27% | |
| 8.6865 | 8.3957 | 9.2402 | 7.3135 | 4.9949 | 71.61% | 59.49% | |
| 0.9394 | 1.2934 | 1.8020 | 2.2967 | 2.2842 | 32.75% | 176.61% | |
| 2.1713 | 1.6423 | 2.8455 | 4.0437 | 4.8821 | 69.99% | 297.27% | |
| 3.4877 | 3.2709 | 2.6924 | 2.3090 | 1.9148 | 27.45% | 58.54% | |
| 1.1805 | 1.8528 | 2.4516 | 3.0172 | 2.7016 | 38.73% | 145.81% | |
| 0.9621 | 1.5129 | 2.2047 | 1.1259 | 1.2036 | 17.26% | 79.56% | |
| 10.6805 | 10.9673 | 11.3779 | 10.6277 | 8.9095 | 127.73% | 81.24% | |
| 3.0630 | 2.0291 | 1.4371 | 1.5936 | 1.5316 | 21.96% | 75.48% | |
| 4.2982 | 3.4623 | 2.2097 | 1.7650 | 1.6374 | 23.47% | 47.29% | |
| GLOBAL AVERAGE | 6.6213 | 6.2420 | 6.4702 | 6.7828 | 6.7623 | 100.00% | 108.34% |
Notes
- Greenhouse gases (GHG) constitute a group of gases contributing to global warming and climate change.
The Kyoto Protocol, an environmental agreement adopted by many of the parties to the United Nations Framework Convention on Climate Change (UNFCCC) in 1997 to curb global warming, nowadays covers seven greenhouse gases:- the non-fluorinated gases:
- carbon dioxide (CO2),
- methane (CH4),
- nitrous oxide (N2O),
- the fluorinated gases:
- hydrofluorocarbons (HFCs),
- perfluorocarbons (PFCs),
- sulphur hexafluoride (SF6),
- nitrogen trifluoride (NF3).
- the non-fluorinated gases:
- Carbon dioxide is the most important greenhouse gas, but not the only one. To capture all greenhouse gas emissions, researchers express them in carbon dioxide-equivalents (CO2eq). This takes all greenhouse gases into account, not just CO2. To express all greenhouse gases in carbon dioxide-equivalents (CO2eq), each one is weighted by its ″global warming potential″ (GWP) value. GWP measures the amount of warming a gas creates compared to CO2. CO2 is given a GWP value of one. If a gas had a GWP of 10 then one kilogram of that gas would generate ten times the warming effect as one kilogram of CO2. Carbon dioxide-equivalents are calculated for each gas by multiplying the mass of emissions of a specific greenhouse gas by its GWP factor. This warming can be stated over different timescales. To calculate CO2eq over 100 years, we’d multiply each gas by its GWP over a 100-year timescale (GWP100). Total greenhouse gas emissions – measured in CO2eq – are then calculated by summing each gas’ CO₂eq value.[1]
- The rate of build-up of GHG in the atmosphere can be reduced by taking advantage of the fact that atmospheric CO2 can accumulate as carbon in vegetation and soils in terrestrial ecosystems. Under the United Nations Framework Convention on Climate Change any process, activity or mechanism which removes a greenhouse gas (GHG) from the atmosphere is referred to as a "sink". Human activities impact terrestrial sinks, through land use, land-use change and forestry (LULUCF), consequently, the exchange of CO2 (carbon cycle) between the terrestrial biosphere and the atmosphere is altered.[4]
 Global Carbon Project (2022)[5]
References
- "Total greenhouse gas emissions per capita". ourworldindata.org. Our World in Data. Retrieved 2023-11-01.
- ● "Territorial (MtCO2)". GlobalCarbonAtlas.org. Retrieved 30 December 2021. (choose "Chart view"; use download link)
● Data for 2020 is also presented in Popovich, Nadja; Plumer, Brad (November 12, 2021). "Who Has The Most Historical Responsibility for Climate Change?". The New York Times. Archived from the original on December 29, 2021.
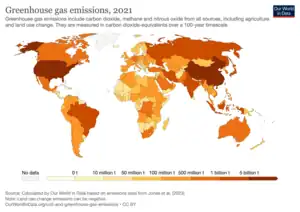
● Source for country populations: "List of the populations of the world's countries, dependencies, and territories". britannica.com. Encyclopedia Britannica. - "Greenhouse gas emissions". ourworldindata.org. Our World in Data. Retrieved 2023-11-01.
- United Nations Framework Convention on Climate Change. "Land Use, Land-Use Change and Forestry (LULUCF)". unfccc.int. Retrieved 2023-11-01.
- Global Carbon Project (2022) Supplemental data of Global Carbon Budget 2022 (Version 1.0) [Data set]. Global Carbon Project. https://doi.org/10.18160/gcp-2022
- "Per capita greenhouse gas emissions". Our World in Data. Retrieved 2023-11-01.
- Joint Research Centre (2023). "GHG emissions of all world countries". EDGAR - Emissions Database for Global Atmospheric Research. Retrieved 2023-11-01.
- Roser, Max; Ritchie, Hannah (11 May 2017). "CO2 and other Greenhouse Gas Emissions". Our World in Data. Archived from the original on 4 July 2019.
- Ritchie, Hannah; Roser, Max. "Per capita CO2 emissions". Our World in Data. Retrieved 2023-11-01.
- Ritchie, Hannah; Roser, Max. "Consumption-based (trade-adjusted) emissions". Our World in Data. Retrieved 2023-11-01.
- Intergovernmental Panel on Climate Change (2021). Climate Change 2021 The Physical Science Basis | Summary for Policymakers (PDF). p. 40. ISBN 978-92-9169-158-6.
- Klugman, Cornelia. "The EU, a world leader in fighting climate change". European Parliament Think Tank. Retrieved 2023-11-01.
See also
- List of countries by greenhouse gas emissions
- List of countries by carbon dioxide emissions
- List of countries by carbon dioxide emissions per capita
- Climate change
- Land use, land-use change, and forestry (LULUCF)
- List of countries by carbon intensity of GDP
- List of countries by renewable electricity production
- United Nations | Sustainable Development Goal 13 - Climate action
External links
- UN Sustainable Development Knowledge Platform – The SDGs
- GHG data from UNFCCC – United Nations Framework Convention on Climate Change greenhouse gas (GHG) emissions data
- Total greenhouse gas emissions (kt of CO2 equivalent) – World Bank
- CO2 emissions in metric tons per capita – Google Public Data Explorer