List of U.S. states and territories by area
This is a complete list of the U.S. states, its federal district and its major territories ordered by total area, land area and water area.[1] The water area includes inland waters, coastal waters, the Great Lakes and territorial waters. Glaciers and intermittent bodies of water are counted as land area.[2]
Area by state, federal district or territory
| State / territory | Total area | Land area | Water area | ||||
|---|---|---|---|---|---|---|---|
| mi2 | km2 | mi2 | km2 | mi2 | km2 | % | |
| 665,384 | 1,723,337 | 570,641 | 1,477,953 | 94,743 | 245,383 | 14.2% | |
| 268,596 | 695,662 | 261,232 | 676,587 | 7,365 | 19,075 | 2.7% | |
| 163,695 | 423,967 | 155,779 | 403,466 | 7,916 | 20,501 | 4.8% | |
| 147,040 | 380,831 | 145,546 | 376,962 | 1,494 | 3,869 | 1.0% | |
| 121,590 | 314,917 | 121,298 | 314,161 | 292 | 757 | 0.2% | |
| 113,990 | 295,234 | 113,594 | 294,207 | 396 | 1,026 | 0.3% | |
| 110,572 | 286,380 | 109,781 | 284,332 | 791 | 2,048 | 0.7% | |
| 104,094 | 269,601 | 103,642 | 268,431 | 452 | 1,170 | 0.4% | |
| 98,379 | 254,799 | 95,988 | 248,608 | 2,391 | 6,191 | 2.4% | |
| 97,813 | 253,335 | 97,093 | 251,470 | 720 | 1,864 | 0.7% | |
| 96,714 | 250,487 | 56,539 | 146,435 | 40,175 | 104,052 | 41.5% | |
| 86,936 | 225,163 | 79,627 | 206,232 | 7,309 | 18,930 | 8.4% | |
| 84,897 | 219,882 | 82,170 | 212,818 | 2,727 | 7,064 | 3.2% | |
| 83,569 | 216,443 | 82,643 | 214,045 | 926 | 2,398 | 1.1% | |
| 82,278 | 213,100 | 81,759 | 211,754 | 520 | 1,346 | 0.6% | |
| 77,348 | 200,330 | 76,824 | 198,974 | 524 | 1,356 | 0.7% | |
| 77,116 | 199,729 | 75,811 | 196,350 | 1,305 | 3,379 | 1.7% | |
| 71,298 | 184,661 | 66,456 | 172,119 | 4,842 | 12,542 | 6.8% | |
| 70,698 | 183,108 | 69,001 | 178,711 | 1,698 | 4,397 | 2.4% | |
| 69,899 | 181,037 | 68,595 | 177,660 | 1,304 | 3,377 | 1.9% | |
| 69,707 | 180,540 | 68,742 | 178,040 | 965 | 2,501 | 1.4% | |
| 65,758 | 170,312 | 53,625 | 138,887 | 12,133 | 31,424 | 18.5% | |
| 65,496 | 169,635 | 54,158 | 140,268 | 11,339 | 29,367 | 17.3% | |
| 59,425 | 153,910 | 57,513 | 148,959 | 1,912 | 4,951 | 3.2% | |
| 57,914 | 149,995 | 55,519 | 143,793 | 2,395 | 6,202 | 4.1% | |
| 56,273 | 145,746 | 55,857 | 144,669 | 416 | 1,077 | 0.7% | |
| 54,555 | 141,297 | 47,126 | 122,057 | 7,429 | 19,240 | 13.6% | |
| 53,819 | 139,391 | 48,618 | 125,920 | 5,201 | 13,471 | 9.7% | |
| 53,179 | 137,732 | 52,035 | 134,771 | 1,143 | 2,961 | 2.1% | |
| 52,420 | 135,767 | 50,645 | 131,171 | 1,775 | 4,597 | 3.4% | |
| 52,378 | 135,659 | 43,204 | 111,898 | 9,174 | 23,761 | 17.5% | |
| 48,432 | 125,438 | 46,923 | 121,531 | 1,509 | 3,907 | 3.1% | |
| 46,054 | 119,280 | 44,743 | 115,883 | 1,312 | 3,397 | 2.8% | |
| 44,826 | 116,098 | 40,861 | 105,829 | 3,965 | 10,269 | 8.8% | |
| 42,775 | 110,787 | 39,490 | 102,279 | 3,285 | 8,508 | 7.7% | |
| 42,144 | 109,153 | 41,235 | 106,798 | 909 | 2,355 | 2.2% | |
| 40,408 | 104,656 | 39,486 | 102,269 | 921 | 2,387 | 2.3% | |
| 36,420 | 94,326 | 35,826 | 92,789 | 593 | 1,537 | 1.6% | |
| 35,380 | 91,633 | 30,843 | 79,883 | 4,537 | 11,750 | 12.8% | |
| 32,020 | 82,933 | 30,061 | 77,857 | 1,960 | 5,076 | 6.1% | |
| 24,230 | 62,756 | 24,038 | 62,259 | 192 | 497 | 0.8% | |
| 12,406 | 32,131 | 9,707 | 25,142 | 2,699 | 6,990 | 21.8% | |
| 10,932 | 28,313 | 6,423 | 16,635 | 4,509 | 11,678 | 41.2% | |
| 10,554 | 27,336 | 7,800 | 20,202 | 2,754 | 7,134 | 26.1% | |
| 9,616 | 24,906 | 9,217 | 23,871 | 400 | 1,035 | 4.2% | |
| 9,349 | 24,214 | 8,953 | 23,187 | 397 | 1,027 | 4.2% | |
| 8,723 | 22,591 | 7,354 | 19,047 | 1,368 | 3,544 | 15.7% | |
| 5,543 | 14,357 | 4,842 | 12,542 | 701 | 1,816 | 12.6% | |
| 5,325 | 13,791 | 3,424 | 8,868 | 1,901 | 4,924 | 35.7% | |
| 2,489 | 6,446 | 1,949 | 5,047 | 540 | 1,399 | 21.7% | |
| 1,976 | 5,117 | 182 | 472 | 1,793 | 4,644 | 90.7% | |
| 1,545 | 4,001 | 1,034 | 2,678 | 511 | 1,324 | 33.1% | |
| 733 | 1,898 | 134 | 348 | 599 | 1,550 | 81.7% | |
| 581 | 1,505 | 76 | 198 | 505 | 1,307 | 86.9% | |
| 571 | 1,478 | 210 | 543 | 361 | 935 | 63.2% | |
| 68 | 177 | 61 | 158 | 7 | 19 | 10.3% | |
| Minor Outlying Islands[3][lower-alpha 1] | 16 | 41 | 16 | 41 | 0 | 0 | 0.0% |
| Contiguous US | 3,120,428 | 8,081,869 | 2,954,843 | 7,653,006 | 165,589 | 428,865 | 5.3% |
| 50 States | 3,796,676 | 9,833,342 | 3,531,846 | 9,147,436 | 264,834 | 685,907 | 7.0% |
| 50 States and DC | 3,796,744 | 9,833,519 | 3,531,907 | 9,147,594 | 264,841 | 685,926 | 7.0% |
| United States | 3,805,927 | 9,857,306 | 3,535,932 | 9,158,022 | 269,995 | 699,284 | 7.1% |
 U.S. states by total area
 U.S. states by land area
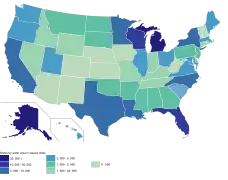 U.S. states by water area
 U.S. states by water percentage
![Alaska is the largest state by total area, land area, and water area. It is the seventh-largest country subdivision in the world.[failed verification]](../I/Map_of_USA_AK_full.png.webp)
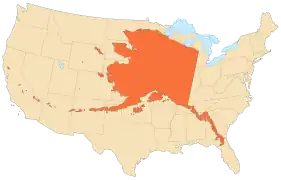 The area of Alaska is 18% of the area of the United States and equivalent to 21% of the area of the contiguous United States.
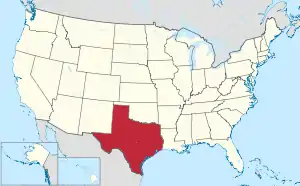 The second largest state, Texas, has only 40% of the total area of the largest state, Alaska.
_(extra_close).svg.png.webp) Rhode Island is the smallest state by total area and land area.
Rhode Island is the smallest state by total area and land area. San Bernardino County is the largest county in the contiguous U.S. and is larger than each of the nine smallest states; it is larger than the four smallest states combined.
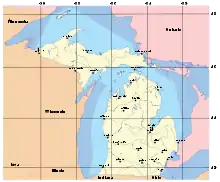 Michigan is second (after Alaska) in water area, and first in water percentage.
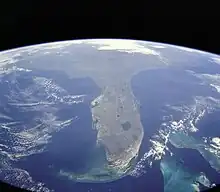 Florida is mostly a peninsula, and has the third-largest water area and seventh-largest water area percentage.
See also
- List of Canadian provinces and territories by area
- List of European countries by area
- List of political and geographic subdivisions by total area
- List of the largest country subdivisions by area
- List of U.S. cities by area
- List of U.S. states and territories by population
Notes
- Areas were not published in the 2010 census, unlike previous years, as the U.S. Census Bureau no longer collects data on the Minor Outlying Islands.[4]
References
- "State Area Measurements and Internal Point Coordinates". census.gov. 2010. Retrieved December 2, 2023.
- "Census 2000 Geographic Terms and Concepts", Census 2000 Geography Glossary, U.S. Census Bureau. Retrieved July 10, 2007.
- "United States Summary: 2000, Population and Housing Unit Counts" (PDF). United States Census Bureau. April 2004. p. 1 (Table 1). Archived from the original (PDF) on February 3, 2017. Retrieved December 28, 2023.
- "United States Summary: 2010, Population and Housing Unit Counts" (PDF). United States Census Bureau. September 2012. pp. V–2, 1 & 41 (Tables 1 & 18). Retrieved February 7, 2014.
- "World Factbook Country Comparison: Area". The World Factbook. CIA. Archived from the original on August 4, 2018. Retrieved August 1, 2018.
This article is issued from Wikipedia. The text is licensed under Creative Commons - Attribution - Sharealike. Additional terms may apply for the media files.