Virginia's 10th congressional district
Virginia's 10th congressional district is a U.S. congressional district in the Commonwealth of Virginia. It is represented by Democrat Jennifer Wexton, who was first elected in 2018.[4]
| Virginia's 10th congressional district | |||
|---|---|---|---|
Interactive map of district boundaries since 2023 | |||
| Representative |
| ||
| Distribution |
| ||
| Population (2022) | 805,988[2] | ||
| Median household income | $152,685[2] | ||
| Ethnicity |
| ||
| Cook PVI | D+6[3] | ||
.svg.png.webp)
.png.webp)
Geography
The district includes all of Rappahannock County, Fauquier County, and Loudoun County, parts of Fairfax County and Prince William County, as well as the independent cities of Manassas and Manassas Park.[5] The district closely matches Virginia's voting patterns in statewide races.
History
Beginning when it was re-created in 1952, the 10th district was in Republican hands for 60 of 66 years, including long stints in office by Joel Broyhill (1953–74) and Frank Wolf (1981–2014). Barbara Comstock, a former aide to Wolf, succeeded him after the 2014 election.[6] Wexton defeated Comstock in the 2018 midterms, becoming only the second Democrat to win the district.
The modern 10th congressional district was formed in 1952. For the next two decades, it consisted of Arlington, Alexandria, and most of Fairfax County. As a result of redistricting following the 1970 census, it lost Alexandria and was pushed westward to take in Loudoun County. Virginia's 10th congressional district used to be a Republican stronghold, having once voted by double-digit margins for Republican candidates. In 2000, ten-term incumbent Republican Congressman Frank Wolf won over 80% of the vote and did not face a Democratic opponent. Two years later, Wolf defeated his Democratic challenger John Stevens by 43 points. In 2004, President George W. Bush won the district by 11 points. In recent years, the district has become much friendlier to Democrats due to population growth in the Washington, D.C. suburbs. In 2012, Mitt Romney narrowly carried the district by a point, while in 2016, Hillary Clinton won the district by 10 points.
In 2017, Democrats scored major gains in the state legislative elections, leaving Comstock as the only elected Republican above the county level in much of the district. Ralph Northam also easily carried the district in the gubernatorial race. This proved to be a precursor to Comstock's defeat by Wexton a year later. As of 2022, VA-10 is the third-wealthiest congressional district in the country, with a median household income of $140,889.[7]
Demographics
According to Larry Sabato's Crystal Ball, as of 2016, the district had many "wealthy and highly-educated voters".[8] As of 2018, whites represented about 61% of the population, and immigrants (largely Hispanic and Asian) represented over 20%. Just over half of adults held at least a four-year college degree.[9]
As of 2018, the 10th district had 35,500 federal workers. By comparison, the 1st district had 46,900; the 11th had 51,900; and the 8th had 81,100.[10] As of 2018, the eastern part of the district was home to Dulles Airport and technology, telecom and aerospace companies including Verizon Business Global LLC and Aeronautical Systems Inc.[11]
Election results from statewide races
| Election results from statewide races | ||
|---|---|---|
| Year | Office | Results |
| 1992 | President | Bush 50%–33%[12] |
| 1996 | President | Dole 54%–38% |
| Senator | Warner 60%–40% | |
| 1997 | Governor | Gilmore 62%–37% |
| Lieutenant Governor | Hager 59%–37% | |
| Attorney General | Earley 62%–38% | |
| 2000 | President | Bush 56%–41%[13] |
| Senator | Allen 59%–41% | |
| 2001 | Governor | Earley 54%–45% |
| Lieutenant Governor | Katzen 57%–41% | |
| Attorney General | Kilgore 65%–35% | |
| 2004 | President | Bush 55%–44%[13] |
| 2008 | President | Obama 51%–48%[14] |
| 2012 | President | Romney 50%–49%[15] |
| 2013 | Governor | Cuccinelli 48%–47%–5%[16] |
| Lieutenant Governor | Northam 52%–48%[17] | |
| Attorney General | Obenshain 50%–50%[18] | |
| 2014 | Senator | Gillespie 52%–46%[19] |
| 2016 | President | Clinton 52%–42%[20] |
| 2017 | Governor | Northam 57%–43%[21] |
| Lieutenant Governor | Fairfax 54%–46% | |
| 2018 | Senator | Kaine 60%–38%[22] |
| 2020 | President | Biden 58%–39%[23] |
| 2021 | Governor | McAuliffe 52%–47% |
Recent election results
1970s
| Party | Candidate | Votes | % | |
|---|---|---|---|---|
| Republican | Joel T. Broyhill (incumbent) | 67,468 | 54.53 | |
| Democratic | Harold O. Miller | 56,255 | 45.47 | |
| Total votes | 123,723 | 100.00 | ||
| Republican hold | ||||
| Party | Candidate | Votes | % | |
|---|---|---|---|---|
| Republican | Joel T. Broyhill (incumbent) | 101,138 | 56.26 | |
| Democratic | Harold O. Miller | 78,638 | 43.74 | |
| Write-ins | 2 | <0.01 | ||
| Total votes | 179,778 | 100.00 | ||
| Republican hold | ||||
| Party | Candidate | Votes | % | |||
|---|---|---|---|---|---|---|
| Democratic | Joseph L. Fisher | 67,184 | 53.62 | |||
| Republican | Joel T. Broyhill (incumbent) | 56,649 | 45.21 | |||
| Independent | Francis J. Speh | 1,465 | 1.17 | |||
| Write-ins | 6 | <0.01 | ||||
| Total votes | 125,304 | 100.00 | ||||
| Democratic gain from Republican | ||||||
| Party | Candidate | Votes | % | |
|---|---|---|---|---|
| Democratic | Joseph L. Fisher (incumbent) | 103,689 | 54.72 | |
| Republican | Vincent F. Callahan Jr. | 73,616 | 38.85 | |
| Independent | E. Stanley Rittenhouse | 12,124 | 6.40 | |
| Write-ins | 60 | 0.03 | ||
| Total votes | 189,489 | 100.00 | ||
| Democratic hold | ||||
| Party | Candidate | Votes | % | |
|---|---|---|---|---|
| Democratic | Joseph L. Fisher (incumbent) | 70,892 | 53.35 | |
| Republican | Frank Wolf | 61,981 | 46.64 | |
| Write-ins | 9 | 0.01 | ||
| Total votes | 132,882 | 100.00 | ||
| Democratic hold | ||||
1980s
| Party | Candidate | Votes | % | |||
|---|---|---|---|---|---|---|
| Republican | Frank Wolf | 110,840 | 51.14 | |||
| Democratic | Joseph L. Fisher (incumbent) | 105,883 | 48.85 | |||
| Write-ins | 21 | 0.01 | ||||
| Total votes | 216,744 | 100.00 | ||||
| Republican gain from Democratic | ||||||
| Party | Candidate | Votes | % | |
|---|---|---|---|---|
| Republican | Frank Wolf (incumbent) | 86,506 | 52.74 | |
| Democratic | Ira M. Lechner | 75,361 | 45.94 | |
| Independent | Scott R. Bowden | 2,162 | 1.32 | |
| Write-ins | 6 | <0.01 | ||
| Total votes | 164,035 | 100.00 | ||
| Republican hold | ||||
| Party | Candidate | Votes | % | |
|---|---|---|---|---|
| Republican | Frank Wolf (incumbent) | 158,528 | 62.50 | |
| Democratic | John P. Flannery II | 95,074 | 37.49 | |
| Write-ins | 23 | <0.01 | ||
| Total votes | 253,625 | 100.00 | ||
| Republican hold | ||||
| Party | Candidate | Votes | % | |
|---|---|---|---|---|
| Republican | Frank Wolf (incumbent) | 95,724 | 60.20 | |
| Democratic | John G. Milliken | 63,292 | 39.80 | |
| Write-ins | 7 | <0.01 | ||
| Total votes | 159,023 | 100.00 | ||
| Republican hold | ||||
| Party | Candidate | Votes | % | |
|---|---|---|---|---|
| Republican | Frank Wolf (incumbent) | 188,550 | 68.09 | |
| Democratic | Bob L. Weinberg | 88,284 | 31.88 | |
| Write-ins | 74 | 0.03 | ||
| Total votes | 276,908 | 100.00 | ||
| Republican hold | ||||
1990s
| Party | Candidate | Votes | % | |
|---|---|---|---|---|
| Republican | Frank Wolf (incumbent) | 103,761 | 61.46 | |
| Democratic | N. MacKenzie Canter III | 57,249 | 33.91 | |
| Independent | Barbara S. Minnich | 5,273 | 3.12 | |
| Independent | Lyndon LaRouche | 2,293 | 1.36 | |
| Write-ins | 249 | 0.15 | ||
| Total votes | 168,825 | 100.00 | ||
| Republican hold | ||||
| Party | Candidate | Votes | % | |
|---|---|---|---|---|
| Republican | Frank Wolf (incumbent) | 144,471 | 63.59 | |
| Democratic | Raymond E. Vickery Jr. | 75,775 | 33.35 | |
| Independent | Alan R. Ogden | 6,874 | 3.03 | |
| Write-ins | 71 | 0.03 | ||
| Total votes | 227,191 | 100.00 | ||
| Republican hold | ||||
| Party | Candidate | Votes | % | |
|---|---|---|---|---|
| Republican | Frank Wolf (incumbent) | 153,311 | 87.34 | |
| Independent | Alan R. Ogden | 13,687 | 7.80 | |
| Independent | Robert L. Rilee | 8,267 | 4.71 | |
| Write-ins | 266 | 0.15 | ||
| Total votes | 175,531 | 100.00 | ||
| Republican hold | ||||
| Party | Candidate | Votes | % | |
|---|---|---|---|---|
| Republican | Frank Wolf (incumbent) | 169,266 | 72.02 | |
| Democratic | Bob L. Weinberg | 59,145 | 25.17 | |
| Independent | Gary A. Reams | 6,500 | 2.77 | |
| Write-ins | 102 | 0.04 | ||
| Total votes | 235,013 | 100.00 | ||
| Republican hold | ||||
| Party | Candidate | Votes | % | |
|---|---|---|---|---|
| Republican | Frank Wolf (incumbent) | 103,648 | 71.60 | |
| Democratic | Cornell W. Brooks | 36,476 | 25.20 | |
| Independent | Robert A. Buchanan | 4,506 | 3.11 | |
| Write-ins | 125 | 0.09 | ||
| Total votes | 144,755 | 100.00 | ||
| Republican hold | ||||
2000s
| Party | Candidate | Votes | % | |
|---|---|---|---|---|
| Republican | Frank Wolf (incumbent) | 238,817 | 84.20 | |
| Independent | Brian M. Brown | 28,107 | 9.91 | |
| Independent | Marc A. Rossi | 16,031 | 5.65 | |
| Write-ins | 682 | 0.24 | ||
| Total votes | 283,637 | 100.00 | ||
| Republican hold | ||||
| Party | Candidate | Votes | % | |
|---|---|---|---|---|
| Republican | Frank Wolf (incumbent) | 115,917 | 71.72 | |
| Democratic | John B. Stevens Jr. | 45,464 | 28.13 | |
| Write-ins | 234 | 0.14 | ||
| Total votes | 161,615 | 100.00 | ||
| Republican hold | ||||
| Party | Candidate | Votes | % | |
|---|---|---|---|---|
| Republican | Frank Wolf (incumbent) | 205,982 | 63.77 | |
| Democratic | James R. Socas | 116,654 | 36.11 | |
| Write-ins | 375 | 0.12 | ||
| Total votes | 323,011 | 100.00 | ||
| Republican hold | ||||
| Party | Candidate | Votes | % | |
|---|---|---|---|---|
| Republican | Frank Wolf (incumbent) | 138,213 | 57.32 | |
| Democratic | Judy Feder | 98,769 | 40.96 | |
| Libertarian | Wilbur N. Wood III | 2,107 | 0.87 | |
| Independent | Neeraj C. Nigam | 1,851 | 0.77 | |
| Write-ins | 194 | 0.08 | ||
| Total votes | 241,134 | 100.00 | ||
| Republican hold | ||||
| Party | Candidate | Votes | % | |
|---|---|---|---|---|
| Republican | Frank Wolf (incumbent) | 223,140 | 58.80 | |
| Democratic | Judy Feder | 147,357 | 38.83 | |
| Independent | Neeraj C. Nigam | 8,457 | 2.23 | |
| Write-ins | 526 | 0.14 | ||
| Total votes | 379,480 | 100.00 | ||
| Republican hold | ||||
2010s
| Party | Candidate | Votes | % | |
|---|---|---|---|---|
| Republican | Frank Wolf (incumbent) | 131,116 | 62.87 | |
| Democratic | Jeff Barnett | 72,604 | 34.81 | |
| Libertarian | Bill Redpath | 4,607 | 2.21 | |
| Write-ins | 229 | 0.11 | ||
| Total votes | 208,556 | 100.00 | ||
| Republican hold | ||||
| Party | Candidate | Votes | % | |
|---|---|---|---|---|
| Republican | Frank Wolf (incumbent) | 214,038 | 58.41 | |
| Democratic | Kristin Cabral | 142,024 | 38.76 | |
| Independent | Kevin Chisholm | 9,855 | 2.69 | |
| Write-in | 527 | 0.14 | ||
| Total votes | 366,444 | 100 | ||
| Republican hold | ||||
| Party | Candidate | Votes | % | |
|---|---|---|---|---|
| Republican | Barbara Comstock | 125,914 | 56.49% | |
| Democratic | John Foust | 89,957 | 40.36% | |
| Libertarian | Bill Redpath | 3,393 | 1.52% | |
| Independent | Brad Eickholt | 2,442 | 1.10% | |
| Independent Greens | Dianne Blais | 946 | 0.42% | |
| Write-in | 258 | 0.12% | ||
| Total votes | 222,910 | 100% | ||
| Republican hold | ||||
| Party | Candidate | Votes | % | ±% | |
|---|---|---|---|---|---|
| Republican | Barbara Comstock (incumbent) | 210,791 | 52.69% | -3.8% | |
| Democratic | LuAnn Bennett | 187,712 | 46.92% | +6.56% | |
| Write-in | 1,580 | 0.39% | +0.27% | ||
| Total votes | 400,083 | 100% | +79.48% | ||
| Republican hold | |||||
| Party | Candidate | Votes | % | ±% | ||
|---|---|---|---|---|---|---|
| Democratic | Jennifer Wexton | 206,356 | 56.1% | +9.2% | ||
| Republican | Barbara Comstock (incumbent) | 160,841 | 43.7% | -9.0% | ||
| Write-in | 598 | 0.2% | -0.2% | |||
| Total votes | 367,795 | 100% | -8.4% | |||
| Democratic gain from Republican | ||||||
2020s
| Party | Candidate | Votes | % | ±% | |
|---|---|---|---|---|---|
| Democratic | Jennifer Wexton (incumbent) | 268,734 | 56.5% | +0.4% | |
| Republican | Aliscia Andrews | 206,253 | 43.4% | -0.3% | |
| Write-in | 559 | 0.1% | -0.1% | ||
| Total votes | 475,546 | ||||
| Democratic hold | |||||
| Party | Candidate | Votes | % | ±% | |
|---|---|---|---|---|---|
| Democratic | Jennifer Wexton (incumbent) | 157,405 | 53.15% | -3.35% | |
| Republican | Hung Cao | 138,163 | 46.65% | +3.25% | |
| Write-in | 577 | 0.19% | +.09% | ||
| Total votes | 296,145 | ||||
| Democratic hold | |||||
List of members representing the district
| Representative | Party | Years | Cong ress |
Electoral history |
|---|---|---|---|---|
| District established March 4, 1789 | ||||
 Samuel Griffin (Williamsburg) |
Pro-Administration | March 4, 1789 – March 3, 1791 |
1st 2nd |
Elected in 1789. Re-elected in 1790. Redistricted to the 13th district. |
| Anti-Administration | March 4, 1791 – March 3, 1793 | |||
| Carter B. Harrison (Maycox) |
Anti-Administration | March 4, 1793 – March 3, 1795 |
3rd 4th 5th |
Elected in 1793. Re-elected in 1795. Re-elected in 1797. Retired. |
| Democratic-Republican | March 4, 1795 – March 3, 1799 | |||
| Edwin Gray | Democratic-Republican | March 4, 1799 – March 3, 1803 |
6th 7th |
Elected in 1799. Re-elected in 1801. Redistricted to the 19th district. |
| John Dawson | Democratic-Republican | March 4, 1803 – March 3, 1813 |
8th 9th 10th 11th 12th |
Redistricted from the 15th district and re-elected in 1803. Re-elected in 1805. Re-elected in 1807. Re-elected in 1809. Re-elected in 1811. Redistricted to the 11th district. |
| Aylett Hawes (Woodville) |
Democratic-Republican | March 4, 1813 – March 3, 1817 |
13th 14th |
Redistricted from the 9th district and re-elected in 1813. Re-elected in 1815. Retired. |
| George F. Strother (Culpeper) |
Democratic-Republican | March 4, 1817 – February 10, 1820 |
15th 16th |
Elected in 1817. Re-elected in 1819. Resigned. |
| Vacant | February 11, 1820 – November 12, 1820 |
16th | ||
| Thomas L. Moore (Warrenton) |
Democratic-Republican | November 13, 1820 – March 3, 1823 |
16th 17th |
Elected to finish Strother's term in August 1820 and seated November 13, 1820. Re-elected in 1821. Retired. |
 William C. Rives (Milton) |
Democratic-Republican | March 4, 1823 – March 3, 1825 |
18th 19th 20th 21st |
Elected in 1823. Re-elected in 1825. Re-elected in 1827. Re-elected in 1829. Resigned to become U.S. Minister to France. |
| Jacksonian | March 4, 1825 – April 17, 1829 | |||
| Vacant | April 18, 1829 – January 24, 1830 |
21st | ||
| William F. Gordon (Charlottesville) |
Jacksonian | January 25, 1830 – March 3, 1833 |
21st 22nd |
Elected in 1829 to finish Rives's term and seated January 25, 1830. Re-elected in 1831. Redistricted to the 12th district. |
| Joseph W. Chinn (Nuttsville) |
Jacksonian | March 4, 1833 – March 3, 1835 |
23rd | Elected in 1833. Lost re-election. |
| John Taliaferro (Fredericksburg) |
Anti-Jacksonian | March 4, 1835 – March 3, 1837 |
24th 25th 26th 27th |
Elected in 1835. Re-elected in 1837. Re-elected in 1839. Re-elected in 1841. Retired. |
| Whig | March 4, 1837 – March 3, 1843 | |||
 William Lucas (Charlestown) |
Democratic | March 4, 1843 – March 3, 1845 |
28th | Elected in 1843. Lost re-election. |
| Henry Bedinger III (Charlestown) |
Democratic | March 4, 1845 – March 3, 1849 |
29th 30th |
Elected in 1845. Re-elected in 1847. Lost re-election. |
 Richard Parker (Berryville) |
Democratic | March 4, 1849 – March 3, 1851 |
31st | Elected in 1849. Elected Virginia Circuit Court judge. |
 Charles J. Faulkner (Martinsburg) |
Whig | March 4, 1851 – March 3, 1853 |
32nd | Elected in 1851. Redistricted to the 8th district. |
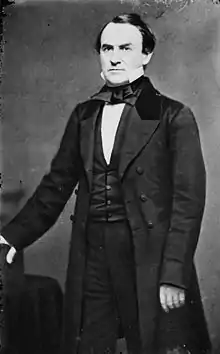
 Zedekiah Kidwell (Fairmont) |
Democratic | March 4, 1853 – March 3, 1857 |
33rd 34th |
Elected in 1853. Re-elected in 1855. Retired. |
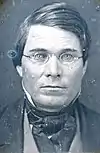
 Sherrard Clemens (Wheeling) |
Democratic | March 4, 1857 – March 3, 1861 |
35th 36th |
Elected in 1857. Re-elected in 1859. Retired. |
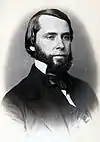
 William G. Brown (Kingwood) |
Unionist | March 4, 1861 – March 3, 1863 |
37th | Elected in 1861. Retired. |
| District inactive | March 4, 1863 – June 19, 1863 |
38th | Civil War | |
| District moved to West Virginia June 20, 1863 | ||||
| District re-established March 4, 1885 | ||||
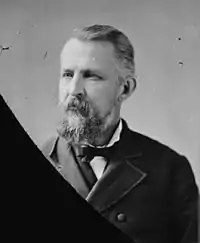 John R. Tucker (Lexington) |
Democratic | March 4, 1885 – March 3, 1887 |
49th | Elected in 1884. Retired. |
| Jacob Yost (Staunton) |
Republican | March 4, 1887 – March 3, 1889 |
50th | Elected in 1886. Lost re-election. |
 Henry S. Tucker III (Staunton) |
Democratic | March 4, 1889 – March 3, 1897 |
51st 52nd 53rd 54th |
Elected in 1888. Re-elected in 1890. Re-elected in 1892. Re-elected in 1894. Retired. |
| Jacob Yost (Staunton) |
Republican | March 4, 1897 – March 3, 1899 |
55th | Elected in 1896. . |
 Julian M. Quarles (Staunton) |
Democratic | March 4, 1899 – March 3, 1901 |
56th | Elected in 1898. Retired. |
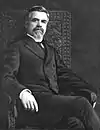
 Henry D. Flood (Appomattox) |
Democratic | March 4, 1901 – December 8, 1921 |
57th 58th 59th 60th 61st 62nd 63rd 64th 65th 66th 67th |
Elected in 1900. Re-elected in 1902. Re-elected in 1904. Re-elected in 1906. Re-elected in 1908. Re-elected in 1910. Re-elected in 1912. Re-elected in 1914. Re-elected in 1916. Re-elected in 1918. Re-elected in 1920. Died. |
| Vacant | December 9, 1921 – March 20, 1922 |
67th | ||
Henry S. Tucker III (Lexington) |
Democratic | March 21, 1922 – July 23, 1932 |
67th 68th 69th 70th 71st 72nd |
Elected to finish Flood's term. Re-elected in 1922. Re-elected in 1924. Re-elected in 1926. Re-elected in 1928. Re-elected in 1930. Died. |
| Vacant | July 24, 1932 – November 7, 1932 |
72nd | ||
| Joel W. Flood (Appomattox) |
Democratic | November 8, 1932 – March 3, 1933 |
Elected to finish Tucker's term. Retired. | |
| District dissolved March 4, 1933 | ||||
| District re-established January 3, 1953 | ||||
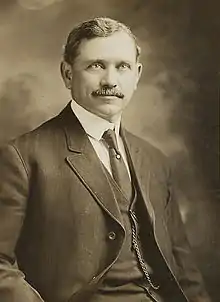
 Joel T. Broyhill (Arlington) |
Republican | January 3, 1953 – December 31, 1974 |
83rd 84th 85th 86th 87th 88th 89th 90th 91st 92nd 93rd |
Elected in 1952. Re-elected in 1954. Re-elected in 1956. Re-elected in 1958. Re-elected in 1960. Re-elected in 1962. Re-elected in 1964. Re-elected in 1966. Re-elected in 1968. Re-elected in 1970. Re-elected in 1972. Lost re-election. |
| Vacant | December 31, 1974 – January 3, 1975 |
93rd | ||
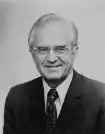 Joseph L. Fisher (Arlington) |
Democratic | January 3, 1975 – January 3, 1981 |
94th 95th 96th |
Elected in 1974. Re-elected in 1976. Re-elected in 1978. Lost re-election. |
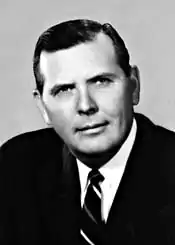
 Frank R. Wolf (Vienna) |
Republican | January 3, 1981 – January 3, 2015 |
97th 98th 99th 100th 101st 102nd 103rd 104th 105th 106th 107th 108th 109th 110th 111th 112th 113th |
Elected in 1980. Re-elected in 1982. Re-elected in 1984. Re-elected in 1986. Re-elected in 1988. Re-elected in 1990. Re-elected in 1992. Re-elected in 1994. Re-elected in 1996. Re-elected in 1998. Re-elected in 2000. Re-elected in 2002. Re-elected in 2004. Re-elected in 2006. Re-elected in 2008. Re-elected in 2010. Re-elected in 2012. Retired. |
.jpg.webp) Barbara Comstock (McLean) |
Republican | January 3, 2015 – January 3, 2019 |
114th 115th |
Elected in 2014. Re-elected in 2016. Lost re-election. |
 Jennifer Wexton (Leesburg) |
Democratic | January 3, 2019 – present |
116th 117th 118th |
Elected in 2018. Re-elected in 2020. Re-elected in 2022. Retiring at the end of term. |
Historical district boundaries
The Virginia Third District started in 1788 covering the counties of New Kent, Elizabeth City, Warwick, York, Charles City, Chesterfield, Henrico, Hanover and James City.[51]
.tif.png.webp)
See also
References
- "Geography Program". www.census.gov.
- Center for New Media & Promotion (CNMP). "My Congressional District Bureau". www.census.gov.
- "2022 Cook PVI: District Map and List". Cook Political Report. Retrieved January 10, 2023.
- Feldman, Kate (November 6, 2018). "Democrat Jennifer Wexton wins Virginia congressional race in first flip of 2018 midterm elections". New York Daily News.
- The Virginia Public Access Project. "District Profile: US Representative District 10". The Virginia Public Access Project. Retrieved February 22, 2024.
- McCaffrey, Scott (July 20, 2018). "Ex-Del. Brink: Wexton has edge, but count Comstock out at your peril". Inside Nova.
- DePietro, Andrew. "The Wealthiest Congressional Districts Of 2022". Forbes. Retrieved November 22, 2022.
- Kondik, Kyle; Skelley, Geoffrey. "House 2016: How a Democratic Wave Could Happen". University of Virginia Center for Politics. Retrieved April 20, 2016.
- Brownstein, Ronald (July 20, 2018). "There are absolutely two Americas. Sometimes in the same state". NBC.
- Portnoy, Jenna (August 1, 2018). "Rep. Comstock, running for reelection, won't vote for a government shutdown no matter how much Trump wants one". Washington Post.
- Edgerton, Anna (August 9, 2018). "A 'Killer Campaigner' for the GOP Swims Against a Blue Tide in Virginia". Bloomberg News. Archived from the original on September 30, 2020. Retrieved September 30, 2020.
{{cite web}}: CS1 maint: unfit URL (link) - Virginia Department of Elections. Official election results. The Library of Virginia.
- "Presidential Results by Congressional District, 2000-2008 – Swing State Project". December 15, 2008.
- Virginia State Board of Elections: Results by District, 2008 Presidential election. Accessed February 11, 2015.
- Virginia State Board of Elections: Results by District, 2012 Presidential election. Accessed February 11, 2015.
- "Governor>Votes by District". November 2013 General Election Official Results. Virginia State Board of Elections. Retrieved July 5, 2020.
- "Lieutenant Governor>Votes by District". November 2013 General Election Official Results. Virginia State Board of Elections. Retrieved July 5, 2020.
- "Attorney General>Votes by District". November 2013 General Election Official Results. Virginia State Board of Elections. Retrieved July 5, 2020.
- "Turnout by Congressional District". The Virginia Public Access Project. Retrieved July 4, 2020.
- "Daily Kos Elections' presidential results by congressional district for the 2016 and 2012 elections". Daily Kos. Retrieved January 13, 2017.
- "2017 Governor's Election Results by US Congressional District". VPAP. Retrieved December 3, 2017.
- "2018 U.S. Senate Results by Congressional District". The Virginia Public Access Project. Retrieved June 16, 2018.
- "Daily Kos Elections' presidential results by congressional district for 2020". Daily Kos.
- "Statistics of the Congressional Election of November 3, 1970" (PDF). Clerk of the House of Representatives.
- "Statistics of the Presidential and Congressional Election of November 7, 1972" (PDF). Clerk of the House of Representatives.
- "Statistics of the Congressional Election of November 4, 1974" (PDF). Clerk of the House of Representatives.
- "Statistics of the Presidential and Congressional Election of November 2, 1976" (PDF). Clerk of the House of Representatives.
- "Statistics of the Congressional Election of November 7, 1978" (PDF). Clerk of the House of Representatives.
- "Statistics of the Presidential and Congressional Election of November 4, 1980" (PDF). Clerk of the House of Representatives.
- "Statistics of the Congressional Election of November 2, 1982" (PDF). Clerk of the House of Representatives.
- "Statistics of the Presidential and Congressional Election of November 6, 1984" (PDF). Clerk of the House of Representatives.
- "Statistics of the Congressional Election of November 4, 1986" (PDF). Clerk of the House of Representatives.
- "Statistics of the Presidential and Congressional Election of November 8, 1988" (PDF). Clerk of the House of Representatives.
- "Statistics of the Congressional Election of November 6, 1990" (PDF). Clerk of the House of Representatives.
- "Statistics of the Presidential and Congressional Election of November 3, 1992" (PDF). Clerk of the House of Representatives.
- "Statistics of the Congressional Election of November 8, 1994" (PDF). Clerk of the House of Representatives.
- "Statistics of the Presidential and Congressional Election of November 5, 1996" (PDF). Clerk of the House of Representatives.
- "Statistics of the Congressional Election of November 3, 1998" (PDF). Clerk of the House of Representatives.
- "2000 ELECTION STATISTICS". clerk.house.gov.
- "2002 ELECTION STATISTICS". clerk.house.gov.
- "2004 ELECTION STATISTICS". clerk.house.gov.
- "2006 Election Statistics". clerk.house.gov.
- "November 2008 Unofficial Results". Virginia State Board of Elections. Archived from the original on April 1, 2012. Retrieved July 21, 2012.
- "November 2, 2010 General and Special Elections Official Results". Virginia State Board of Elections. Archived from the original on July 21, 2011. Retrieved January 7, 2011.
- "November 6, 2012 General Election Official Results". Virginia State Board of Elections. Archived from the original on May 12, 2013. Retrieved December 14, 2012.
- "Election Results | Virginia Department of Elections". Archived from the original on November 7, 2014. Retrieved December 22, 2014.
- "2016 November General". Results.elections.virginia.gov. Retrieved March 23, 2017.
- "2018 November General". Results.elections.virginia.gov. Retrieved November 26, 2018.
- "2020 November General". Results.elections.virginia.gov. Archived from the original on February 3, 2021. Retrieved November 9, 2020.
- "2022 November General". Results.elections.virginia.gov. Retrieved November 11, 2022.
- "The statutes at large : being a collection of all the laws of Virginia, from the first session of the legislature, in the year 1619 : published pursuant to an ... v. 12 (1785-88)". HathiTrust.
- Martis, Kenneth C. (1989). The Historical Atlas of Political Parties in the United States Congress. New York: Macmillan Publishing Company.
- Martis, Kenneth C. (1982). The Historical Atlas of United States Congressional Districts. New York: Macmillan Publishing Company.
- Congressional Biographical Directory of the United States 1774–present