Virginia's 2nd congressional district
Virginia's second congressional district is a U.S. congressional district in the Commonwealth of Virginia. It currently encompasses all of Accomack, Northampton, and Isle of Wight; all of the independent cities of Virginia Beach, Suffolk, and Franklin; part of the independent city of Chesapeake; and part of Southampton. However, its boundaries have changed greatly over the centuries; it initially encompassed what became West Virginia after the American Civil War. It is considered among the nation's most competitive congressional districts.
| Virginia's 2nd congressional district | |||
|---|---|---|---|
Interactive map of district boundaries since 2023 | |||
| Representative |
| ||
| Distribution |
| ||
| Population (2022) | 780,161[2] | ||
| Median household income | $83,535[3] | ||
| Ethnicity |
| ||
| Cook PVI | R+2[4] | ||
.svg.png.webp)
.png.webp)
The district has a significant military presence.[5] The Hampton Roads area is considered to be a military town.[6]
Republican Scott Rigell defeated Democrat Glenn Nye in the November 2, 2010, election, and took his seat January 3, 2011, serving until 2017, when he was succeeded by Scott Taylor. In the November 6, 2018, election, Democrat Elaine Luria defeated Republican Scott Taylor. In 2022, Luria was defeated by Republican Jen Kiggans, thereby making the district one of 18 that would have voted for Joe Biden in the 2020 presidential election had they existed in their current configuration while being won or held by a Republican in 2022.
The responsibility of drawing maps for congressional and state legislative districts passed from the Virginia Redistricting Commission (VRC) to the Supreme Court of Virginia in November 2021. The Supreme Court completed redistricting in December 2021, which was used for the 2022 elections.[7]
Recent results in statewide races
- Results under current lines (since 2023)
| Year | Office | Results |
|---|---|---|
| 2016 | President | Trump 49.8%–44.3% |
| 2017 | Governor | Northam 50.4%-48.5% |
| Lieutenant Governor | Vogel 52.2%-47.7% | |
| Attorney General | Adams 51.1%–48.8% | |
| 2018 | Senator | Kaine 52.6%-45.4% |
| 2020 | President | Biden 50.0%-48.0% |
| Senator | Warner 52.0%-47.9% | |
| 2021 | Governor | Youngkin 55.1%-44.2% |
| Lieutenant Governor | Sears 55.6%-44.3% | |
| Attorney General | Miyares 55.1%-44.8% |
- Results under old lines
| Year | Office | Results |
|---|---|---|
| 1996 | U.S. President | Dole 48%–44%[8] |
| U.S. Senator | Warner 57%–43%[8] | |
| 1997 | Governor | Gilmore 56%–42%[9] |
| Lieutenant Governor | Hager 52%–41%[9] | |
| Attorney General | Earley 63%–37%[9] | |
| 2000 | U.S. President | Bush 53%–45%[10] |
| U.S. Senator | Allen 51%–49%[10] | |
| 2001 | Governor | Earley 50%–50%[11] |
| Lieutenant Governor | Katzen 52%–47%[11] | |
| Attorney General | Kilgore 64%–36%[11] | |
| 2002 | U.S. Senator | Warner 84%–9%[12] |
| 2004 | U.S. President | Bush 58%–42%[13] |
| 2005 | Governor | Kaine 50%–47%[14] |
| Lieutenant Governor | Bolling 54%–45%[14] | |
| Attorney General | McDonnell 55%–44%[14] | |
| 2006 | Senate | Allen 51%–48%[15] |
| 2008 | U.S. President | Obama 50%–48%[16] |
| Senate | Warner 65%–34%[16] | |
| 2009 | Governor | McDonnell 62%–38%[17] |
| Lieutenant Governor | Bolling 56%–44%[18] | |
| Attorney General | Cuccinelli 60%–40%[18] | |
| 2012 | U.S. President | Obama 50%–48%[19] |
| Senate | Kaine 52%–48%[19] | |
| 2013 | Governor | McAuliffe 47%–46%–7%[20] |
| Lieutenant Governor | Northam 57%–43%[21] | |
| Attorney General | Obenshain 52%–48%[22] | |
| 2014 | Senator | Gillespie 49%–48%[23] |
| 2016 | U.S. President | Trump 48%–45%[24] |
| 2017 | Governor | Northam 51%–47%[25] |
| 2018 | Senator | Kaine 54%–44%[26] |
| 2020 | U.S. President | Biden 51%–46%[27] |
| 2021 | Governor | Youngkin 53%–45%[28] |
List of members representing the district
| Representative | Party | Years | Cong ress |
Electoral history |
|---|---|---|---|---|
| District established March 4, 1789 | ||||
 John Brown (Charlottesville) |
Anti-Administration | March 4, 1789 – June 1, 1792 |
1st 2nd |
Elected in 1789. Re-elected in 1790. Resigned. |
| Vacant | June 2, 1792 – March 3, 1793 |
2nd | ||
 Andrew Moore (Lexington) |
Anti-Administration | March 4, 1793 – March 3, 1795 |
3rd 4th |
Redistricted from the 3rd district and re-elected in 1793. Re-elected in 1795. Retired. |
| Democratic-Republican | March 4, 1795 – March 3, 1797 | |||
 David Holmes (Harrisonburg) |
Democratic-Republican | March 4, 1797 – March 3, 1803 |
5th 6th 7th |
Elected in 1797. Re-elected in 1799. Re-elected in 1801. Redistricted to the 4th district. |
| James Stephenson (Martinsburg) |
Federalist | March 4, 1803 – March 3, 1805 |
8th | Elected in 1803. Lost re-election. |
| John Morrow | Democratic-Republican | March 4, 1805 – March 3, 1809 |
9th 10th |
Elected in 1805. Re-elected in 1807. Lost re-election. |
| James Stephenson (Martinsburg) |
Federalist | March 4, 1809 – March 3, 1811 |
11th | Elected in 1809. Lost re-election. |
| John Baker (Shepherdstown) |
Federalist | March 4, 1811 – March 3, 1813 |
12th | Elected in 1811. Retired. |
| Francis White (Romney) |
Federalist | March 4, 1813 – March 3, 1815 |
13th | Elected in 1813. Lost re-election. |
| Magnus Tate (Martinsburg) |
Federalist | March 4, 1815 – March 3, 1817 |
14th | Elected in 1815. Retired. |
| Edward Colston (Martinsburg) |
Federalist | March 4, 1817 – March 3, 1819 |
15th | Elected in 1817. Lost re-election. |
| Thomas Van Swearingen (Shepherdstown) |
Federalist | March 4, 1819 – August 19, 1822 |
16th 17th |
Elected in 1819. Re-elected in 1821. Died. |
| Vacant | August 19, 1822 – October 28, 1822 |
17th | ||
| James Stephenson (Martinsburg) |
Federalist | October 28, 1822 – March 3, 1823 |
Elected to finish Van Swearingen's term and seated December 2, 1822. Redistricted to the 16th district. | |
| Arthur Smith (Smithfield) |
Democratic-Republican | March 4, 1823 – March 3, 1825 |
18th | Redistricted from the 20th district and Re-elected in 1823. Retired. |
| James Trezvant (Jerusalem) |
Jacksonian | March 4, 1825 – March 3, 1831 |
19th 20th 21st |
Elected in 1825. Re-elected in 1827. Re-elected in 1829. [data missing] |
 John Y. Mason (Hicksford) |
Jacksonian | March 4, 1831 – January 11, 1837 |
22nd 23rd 24th |
Elected in 1831. Re-elected in 1833. Re-elected in 1835. Resigned. |
| Vacant | January 12, 1837 – March 3, 1837 |
24th | ||
| Francis E. Rives (Littleton) |
Democratic | March 4, 1837 – March 3, 1841 |
25th 26th |
Elected in 1837. Re-elected in 1839. Retired. |
| George B. Cary (Bethlehem) |
Democratic | March 4, 1841 – March 3, 1843 |
27th | Elected in 1841. Retired. |
 George Dromgoole (Summit) |
Democratic | March 4, 1843 – April 27, 1847 |
28th 29th 30th |
Elected in 1843. Re-elected in 1845. Died. |
| Vacant | April 27, 1847 – August 5, 1847 |
30th | ||
| Richard K. Meade (Petersburg) |
Democratic | August 5, 1847 – March 3, 1853 |
30th 31st 32nd |
Elected to finish Dromgoole's term. Re-elected in 1847. Re-elected in 1849. Re-elected in 1851. Lost renomination. |
 John Millson (Norfolk) |
Democratic | March 4, 1853 – March 3, 1861 |
33rd 34th 35th 36th |
Elected in 1853. Re-elected in 1855. Re-elected in 1857. Re-elected in 1859. Retired. |
| District inactive | March 4, 1861 – January 26, 1870 |
37th 38th 39th 40th |
Civil War and Reconstruction | |
| James H. Platt Jr. (Norfolk) |
Republican | January 27, 1870 – March 3, 1875 |
41st 42nd 43rd |
Elected in 1870. Re-elected in 1872. Lost re-election. |
 John Goode Jr. (Norfolk) |
Democratic | March 4, 1875 – March 3, 1881 |
44th 45th 46th |
Elected in 1874. Re-elected in 1876. Re-elected in 1878. Lost re-election. |
 John F. Dezendorf (Norfolk) |
Republican | March 4, 1881 – March 3, 1883 |
47th | Elected in 1880. Retired. |
 Harry Libbey (Old Point Comfort) |
Readjuster | March 4, 1883 – March 3, 1885 |
48th 49th |
Elected in 1882. [data missing] |
| Republican | March 4, 1885 – March 3, 1887 |
Elected in 1884. Lost re-election. | ||
 George E. Bowden (Norfolk) |
Republican | March 4, 1887 – March 3, 1891 |
50th 51st |
Elected in 1886. Re-elected in 1888. Lost re-election. |
 John W. Lawson (Isle of Wight) |
Democratic | March 4, 1891 – March 3, 1893 |
52nd | Elected in 1890. Retired. |
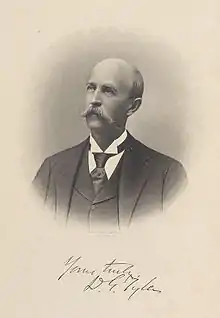 David Gardiner Tyler (Sturgeon Point) |
Democratic | March 4, 1893 – March 3, 1897 |
53rd 54th |
Elected in 1892. Re-elected in 1894. Lost re-election. |
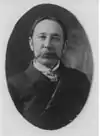
| William A. Young (Norfolk) |
Democratic | March 4, 1897 – April 26, 1898 |
55th | Election invalidated. |
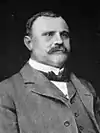
 Richard A. Wise (Williamsburg) |
Republican | April 26, 1898 – March 3, 1899 |
55th | Elected in 1898. Lost re-election. |
| William A. Young (Norfolk) |
Democratic | March 4, 1899 – March 12, 1900 |
56th | Election invalidated |
Richard A. Wise (Williamsburg) |
Republican | March 12, 1900 – December 21, 1900 |
56th | Elected in 1900. Died. |
| Vacant | December 21, 1900 – March 3, 1901 |
|||
 Harry L. Maynard (Portsmouth) |
Democratic | March 4, 1901 – March 3, 1911 |
57th 58th 59th 60th 61st |
Elected in 1900. Re-elected in 1902. Re-elected in 1904. Re-elected in 1906. Re-elected in 1908. Lost re-election. |
 Edward E. Holland (Suffolk) |
Democratic | March 4, 1911 – March 3, 1921 |
62nd 63rd 64th 65th 66th |
Elected in 1910. Re-elected in 1912. Re-elected in 1914. Re-elected in 1916. Re-elected in 1918. Retired. |
 Joseph T. Deal (Norfolk) |
Democratic | March 4, 1921 – March 3, 1929 |
67th 68th 69th 70th |
Elected in 1920. Re-elected in 1922. Re-elected in 1924. Re-elected in 1926. Lost re-election. |
| Menalcus Lankford (Norfolk) |
Republican | March 4, 1929 – March 3, 1933 |
71st 72nd |
Elected in 1928. Re-elected in 1930. Lost re-election. |
| District inactive | March 4, 1933 – January 3, 1935 |
73rd | ||
.png.webp) Colgate Darden (Norfolk) |
Democratic | January 3, 1935 – January 3, 1937 |
74th | Elected in 1934. Lost renomination. |
_in_1916_(cropped).jpg.webp) Norman R. Hamilton (Portsmouth) |
Democratic | January 3, 1937 – January 3, 1939 |
75th | Elected in 1936. Lost renomination. |
.jpg.webp) Colgate Darden (Norfolk) |
Democratic | January 3, 1939 – March 1, 1941 |
76th 77th |
Elected in 1938. Re-elected in 1940. Resigned to run for Governor of Virginia. |
| Vacant | March 1, 1941 – April 8, 1941 |
77th | ||
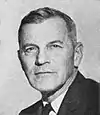
| Winder R. Harris (Norfolk) |
Democratic | April 8, 1941 – September 15, 1944 |
77th 78th |
Elected to finish Darden's term. Re-elected in 1942. Resigned. |
| Vacant | September 15, 1944 – November 7, 1944 |
78th | ||
 Ralph H. Daughton (Norfolk) |
Democratic | November 7, 1944 – January 3, 1947 |
78th 79th |
Elected to finish Harris' term. Simultaneously elected to a full term in 1944. Lost renomination. |
 Porter Hardy Jr. (Portsmouth) |
Democratic | January 3, 1947 – January 3, 1969 |
80th 81st 82nd 83rd 84th 85th 86th 87th 88th 89th 90th |
Elected in 1946. Re-elected in 1948. Re-elected in 1950. Re-elected in 1952. Re-elected in 1954. Re-elected in 1956. Re-elected in 1958. Re-elected in 1960. Re-elected in 1962. Re-elected in 1964. Re-elected in 1966. Retired. |
 G. William Whitehurst (Norfolk) |
Republican | January 3, 1969 – January 3, 1987 |
91st 92nd 93rd 94th 95th 96th 97th 98th 99th |
Elected in 1968. Re-elected in 1970. Re-elected in 1972. Re-elected in 1974. Re-elected in 1976. Re-elected in 1978. Re-elected in 1980. Re-elected in 1982. Re-elected in 1984. Retired. |
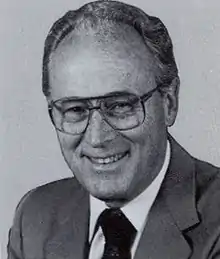
 Owen B. Pickett (Virginia Beach) |
Democratic | January 3, 1987 – January 3, 2001 |
100th 101st 102nd 103rd 104th 105th 106th |
Elected in 1986. Re-elected in 1988. Re-elected in 1990. Re-elected in 1992. Re-elected in 1994. Re-elected in 1996. Re-elected in 1998. Retired. |
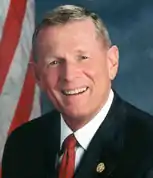 Ed Schrock (Virginia Beach) |
Republican | January 3, 2001 – January 3, 2005 |
107th 108th |
Elected in 2000. Re-elected in 2002. Retired. |
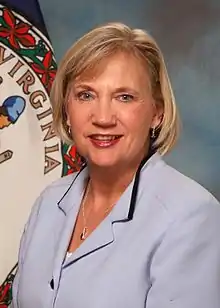 Thelma Drake (Norfolk) |
Republican | January 3, 2005 – January 3, 2009 |
109th 110th |
Elected in 2004. Re-elected in 2006. Lost re-election. |
 Glenn Nye (Norfolk) |
Democratic | January 3, 2009 – January 3, 2011 |
111th | Elected in 2008. Lost re-election. |
 Scott Rigell (Virginia Beach) |
Republican | January 3, 2011 – January 3, 2017 |
112th 113th 114th |
Elected in 2010. Re-elected in 2012. Re-elected in 2014. Retired. |
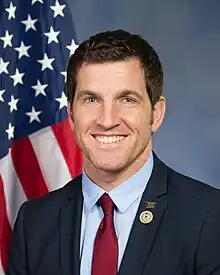 Scott Taylor (Virginia Beach) |
Republican | January 3, 2017 – January 3, 2019 |
115th | Elected in 2016. Lost re-election. |
 Elaine Luria (Norfolk) |
Democratic | January 3, 2019 – January 3, 2023 |
116th 117th |
Elected in 2018. Re-elected in 2020. Lost re-election. |
 Jen Kiggans (Virginia Beach) |
Republican | January 3, 2023 – present |
118th | Elected in 2022. |
Election results
1980s
| Party | Candidate | Votes | % | |
|---|---|---|---|---|
| Republican | G. William Whitehurst (Incumbent) | 97,319 | 89.84% | |
| Independent | Kenneth P. Morrison | 11,003 | 10.16% | |
| Write-in | 6 | 0.01% | ||
| Total votes | 108,328 | 100% | ||
| Republican hold | ||||
| Party | Candidate | Votes | % | |
|---|---|---|---|---|
| Republican | G. William Whitehurst (Incumbent) | 78,108 | 99.88% | |
| Write-in | 97 | 0.12% | ||
| Total votes | 78,205 | 100% | ||
| Republican hold | ||||
| Party | Candidate | Votes | % | |
|---|---|---|---|---|
| Republican | G. William Whitehurst (Incumbent) | 136,632 | 99.81% | |
| Write-in | 256 | 0.19% | ||
| Total votes | 136,888 | 100% | ||
| Republican hold | ||||
| Party | Candidate | Votes | % | |||
|---|---|---|---|---|---|---|
| Democratic | Owen B. Pickett | 54,491 | 49.46% | |||
| Republican | A. Joe Canada Jr. | 46,137 | 41.88% | |||
| Independent | Stephen P. Shao | 9,492 | 8.62% | |||
| Write-in | 49 | 0.04% | ||||
| Total votes | 110,169 | 100% | ||||
| Democratic gain from Republican | ||||||
| Party | Candidate | Votes | % | |
|---|---|---|---|---|
| Democratic | Owen B. Pickett (Incumbent) | 106,666 | 60.53% | |
| Republican | Jerry R. Curry | 62,564 | 35.51% | |
| Independent | Stephen P. Shao | 4,255 | 2.41% | |
| Independent | Robert A. Smith | 2,691 | 1.53% | |
| Write-in | 32 | 0.02% | ||
| Total votes | 176,208 | 100% | ||
| Democratic hold | ||||
1990s
| Party | Candidate | Votes | % | |
|---|---|---|---|---|
| Democratic | Owen B. Pickett (Incumbent) | 55,179 | 74.95% | |
| Independent | Harry G. Broskie | 15,915 | 21.62% | |
| Write-in | 2,524 | 3.43% | ||
| Total votes | 73,618 | 100% | ||
| Democratic hold | ||||
| Party | Candidate | Votes | % | |
|---|---|---|---|---|
| Democratic | Owen B. Pickett (Incumbent) | 99,253 | 56.03% | |
| Republican | J. L. Chapman IV | 77,797 | 43.92% | |
| Write-in | 83 | 0.05% | ||
| Total votes | 177,133 | 100% | ||
| Democratic hold | ||||
| Party | Candidate | Votes | % | |
|---|---|---|---|---|
| Democratic | Owen B. Pickett (Incumbent) | 81,372 | 59.05% | |
| Republican | J. L. Chapman IV | 56,375 | 40.91% | |
| Write-in | 55 | 0.04% | ||
| Total votes | 137,802 | 100% | ||
| Democratic hold | ||||
| Party | Candidate | Votes | % | |
|---|---|---|---|---|
| Democratic | Owen B. Pickett (Incumbent) | 106,215 | 64.77% | |
| Republican | John F. Tate | 57,586 | 35.11% | |
| Write-in | 195 | 0.12% | ||
| Total votes | 163,996 | 100% | ||
| Democratic hold | ||||
| Party | Candidate | Votes | % | |
|---|---|---|---|---|
| Democratic | Owen B. Pickett (Incumbent) | 67,975 | 94.29% | |
| Write-in | 4,116 | 5.71% | ||
| Total votes | 72,091 | 100% | ||
| Democratic hold | ||||
2000s
| Party | Candidate | Votes | % | |||
|---|---|---|---|---|---|---|
| Republican | Edward L. Schrock | 97,856 | 51.96% | |||
| Democratic | Jody M. Wagner | 90,328 | 47.96% | |||
| Write-in | 145 | 0.08% | ||||
| Total votes | 188,329 | 100% | ||||
| Republican gain from Democratic | ||||||
| Party | Candidate | Votes | % | |
|---|---|---|---|---|
| Republican | Edward L. Schrock (Incumbent) | 103,807 | 83.15% | |
| Green | D. C. Amarasinghe | 20,589 | 16.49% | |
| Write-in | 450 | 0.36% | ||
| Total votes | 124,846 | 100% | ||
| Republican hold | ||||
| Party | Candidate | Votes | % | |
|---|---|---|---|---|
| Republican | Thelma D. Drake | 132,946 | 55.08% | |
| Democratic | David B. Ashe | 108,180 | 44.82% | |
| Write-in | 254 | 0.11% | ||
| Total votes | 241,380 | 100% | ||
| Republican hold | ||||
| Party | Candidate | Votes | % | |
|---|---|---|---|---|
| Republican | Thelma D. Drake (Incumbent) | 88,777 | 51.27% | |
| Democratic | Phil Kellam | 83,901 | 48.45% | |
| Write-in | 481 | 0.28% | ||
| Total votes | 173,159 | 100% | ||
| Republican hold | ||||
| Party | Candidate | Votes | % | |||
|---|---|---|---|---|---|---|
| Democratic | Glenn Nye | 141,857 | 52.40% | |||
| Republican | Thelma D. Drake (Incumbent) | 128,486 | 47.46% | |||
| Write-in | 368 | 0.14% | ||||
| Total votes | 270,711 | 100% | ||||
| Democratic gain from Republican | ||||||
2010s
| Party | Candidate | Votes | % | |||
|---|---|---|---|---|---|---|
| Republican | E. Scott Rigell | 88,340 | 53.12% | |||
| Democratic | Glenn Nye (Incumbent) | 70,591 | 42.45% | |||
| Independent | Kenny E. Golden | 7,194 | 4.33% | |||
| Write-in | 164 | 0.10% | ||||
| Total votes | 166,289 | 100% | ||||
| Republican gain from Democratic | ||||||
| Party | Candidate | Votes | % | |
|---|---|---|---|---|
| Republican | E. Scott Rigell (Incumbent) | 166,231 | 53.76% | |
| Democratic | Paul O. Hirschbiel, Jr. | 142,548 | 46.10% | |
| Write-in | 443 | 0.14% | ||
| Total votes | 309,222 | 100% | ||
| Republican hold | ||||
| Party | Candidate | Votes | % | |
|---|---|---|---|---|
| Republican | E. Scott Rigell (Incumbent) | 101,558 | 58.68% | |
| Democratic | Suzanne Patrick | 71,178 | 41.13% | |
| Write-in | 324 | 0.19% | ||
| Total votes | 173,060 | 100% | ||
| Republican hold | ||||
| Party | Candidate | Votes | % | |
|---|---|---|---|---|
| Republican | Scott Taylor | 190,475 | 61.33% | |
| Democratic | Shaun D. Brown | 119,440 | 38.46% | |
| Write-in | 652 | 0.21% | ||
| Total votes | 310,567 | 100.00% | ||
| Republican hold | ||||
| Party | Candidate | Votes | % | |||
|---|---|---|---|---|---|---|
| Democratic | Elaine Luria | 139,571 | 51.05% | |||
| Republican | Scott Taylor (Incumbent) | 133,458 | 48.81% | |||
| Write-in | 371 | 0.14% | ||||
| Total votes | 273,400 | 100.00% | ||||
| Democratic gain from Republican | ||||||
2020s
| Party | Candidate | Votes | % | |
|---|---|---|---|---|
| Democratic | Elaine Luria (Incumbent) | 185,733 | 51.55% | |
| Republican | Scott Taylor | 165,031 | 45.81% | |
| Independent | David Foster | 9,170 | 2.55% | |
| Write-in | 343 | 0.10% | ||
| Total votes | 360,277 | 100.00% | ||
| Democratic hold | ||||
| Party | Candidate | Votes | % | |
|---|---|---|---|---|
| Republican | Jen Kiggans | 153,328 | 51.6% | |
| Democratic | Elaine Luria (Incumbent) | 143,219 | 48.2% | |
| Write-in | 449 | 0.2% | ||
| Total votes | 296,996 | 100.00% | ||
| Republican gain from Democratic | ||||
Historical district boundaries
The Virginia Second District started in 1788 covering the counties of Mercer, Jefferson, Fayette, Bourbon, Lincoln, Nelson and Madison.[34]
.tif.png.webp)
.png.webp)
References
- "Congressional Districts Relationship Files (state-based)". www.census.gov. US Census Bureau Geography.
- "My Congressional District". www.census.gov. Center for New Media & Promotion (CNMP), US Census Bureau.
- "My Congressional District".
- "2022 Cook PV: District Map and List". The Cook Political Report. July 12, 2022. Retrieved January 5, 2023.
- "Military Posts". American Communities Project. Retrieved November 22, 2022.
- "Naval Air Station Oceana | Base Overview & Info | MilitaryINSTALLATIONS". installations.militaryonesource.mil. Retrieved November 22, 2022.
- Virginia Redistricting Commission. "Virginia Redistricting Commission". Retrieved June 17, 2022.
- "November 5, 1996 General Election For Office of PRESIDENT/VICE PRESIDENT of the United States". Virginia State Board of Elections. Archived from the original on December 28, 2012. Retrieved December 21, 2012.
- "NOVEMBER 4, 1997 GENERAL ELECTION For Office of Governor". Virginia State Board of Elections. Archived from the original on December 28, 2012. Retrieved December 21, 2012.
- "November 7th - General Election". Virginia State Board of Elections. November 20, 2000. Archived from the original on December 29, 2012. Retrieved December 21, 2012.
- "Official Results: Governor". Virginia State Board of Elections. Archived from the original on December 29, 2012. Retrieved December 21, 2012.
- "Official Results: Senate". Virginia State Board of Elections. Archived from the original on December 28, 2012. Retrieved December 21, 2012.
- "November 2nd - General Election Official Results". Virginia State Board of Elections. Archived from the original on December 29, 2012. Retrieved December 21, 2012.
- "November 2005 Official Results". Virginia State Board of Elections. Archived from the original on December 28, 2012. Retrieved July 6, 2013.
- "November 2006 Official Results". Virginia State Board of Elections. Retrieved July 6, 2013.
- "November 2008 Official Results". Virginia State Board of Elections. Archived from the original on March 4, 2016. Retrieved December 21, 2012.
- "November 2009 Official Results". Virginia State Board of Elections. Archived from the original on April 1, 2012. Retrieved July 6, 2013.
- "November 2009 Official Results". Virginia State Board of Elections. Archived from the original on January 11, 2014. Retrieved July 6, 2013.
- "November 2012 Official Results". Virginia State Board of Elections. Archived from the original on August 9, 2016. Retrieved July 6, 2013.
- "Governor>Votes by District". November 2013 General Election Official Results. Virginia State Board of Elections. Retrieved July 5, 2020.
- "Lieutenant Governor>Votes by District". November 2013 General Election Official Results. Virginia State Board of Elections. Retrieved July 5, 2020.
- "Attorney General>Votes by District". November 2013 General Election Official Results. Virginia State Board of Elections. Retrieved July 5, 2020.
- "Turnout by Congressional District". The Virginia Public Access Project. Retrieved July 4, 2020.
- "Daily Kos Elections presents the 2016 presidential election results by congressional district".
- "2017 Governor's Election Results by Congressional District". The Virginia Public Access Project. Retrieved June 16, 2018.
- "2018 U.S. Senate Results by Congressional District". The Virginia Public Access Project. Retrieved June 16, 2018.
- "Daily Kos Elections' presidential results by congressional district for 2020, 2016, and 2012".
- @greggiroux (November 16, 2021). "Certified results of Virginia governor's election by current congressional district:" (Tweet) – via Twitter.
- "Election Results | Virginia Department of Elections". Archived from the original on November 7, 2014. Retrieved November 27, 2014.
- "2016 November General Congress". Virginia State Board of Elections. Retrieved November 24, 2016.
- "2018 November General Congress". Virginia State Board of Elections. Archived from the original on November 8, 2018. Retrieved December 7, 2018.
- "2020 November General Official Results". Virginia Department of Elections. November 11, 2020. Archived from the original on February 3, 2021. Retrieved December 15, 2020.
- "2022 November General". November 8, 2022. Retrieved November 8, 2022.
- Statute of 20 November 1788
- Martis, Kenneth C. (1989). The Historical Atlas of Political Parties in the United States Congress. New York: Macmillan Publishing Company.
- Martis, Kenneth C. (1982). The Historical Atlas of United States Congressional Districts. New York: Macmillan Publishing Company.
- Congressional Biographical Directory of the United States 1774–present