Virginia's 8th congressional district
Virginia's 8th congressional district is located just across the Potomac River from Washington, D.C.. It comprises several populous suburbs in Northern Virginia, including all of Alexandria, Arlington, and Falls Church, as well as parts of Fairfax County. Democrat Don Beyer has held the seat since 2015. With a Cook Partisan Voting Index rating of D+26, it is the most Democratic district in Virginia.[4]
| Virginia's 8th congressional district | |||
|---|---|---|---|
Interactive map of district boundaries since 2023 | |||
| Representative |
| ||
| Distribution |
| ||
| Population (2022) | 764,684[2] | ||
| Median household income | $122,460[3] | ||
| Ethnicity |
| ||
| Cook PVI | D+26[4] | ||
.svg.png.webp)
.png.webp)
The 8th district is heavily influenced by the federal government in neighboring Washington, with nearly a quarter of its working population employed in the public sector. Though commuting into the nation's capital for work is common, several government agencies have their headquarters in the 8th district. The most prominent of these are the United States Department of Defense (located in the Pentagon) and the Central Intelligence Agency. Their presence has established a flourishing aerospace and defense industry in the area, with Northrop Grumman being one of the district's top private sector employers. Other major corporations are also located within its boundaries, most notably AES.
The seat has long been a liberal stronghold, having backed every Democratic presidential nominee since 1992. But those margins have grown dramatically; in 2020, Joe Biden carried the 8th district by over 55 points. Once a popular destination for white flight, the district has seen an influx of Asian, Black, and Hispanic residents in recent years and is now majority nonwhite.[5] It also has the nation's fifth-highest share of individuals with a bachelor's degree or higher, in large part due to the nearby government presence.
Election results from statewide races
| Year | Office | Results |
|---|---|---|
| 1996 | President | Clinton 55%–40% |
| 2000 | President | Gore 55%–40%[6] |
| 2004 | President | Kerry 64%–35%[7] |
| 2008 | President | Obama 69%–30%[8] |
| 2012 | President | Obama 67%–32%[9] |
| 2016 | President | Clinton 72%–21%[10] |
| 2020 | President | Biden 77%–22%[11] |
Demographics
As of 2000, the district has 643,503 residents, 13.7% are African American, 9.5% are Asian, 16.4% are Hispanic and 64.5% are white.[12]
Virginia's eighth congressional district is traditionally a Democratic stronghold, most notably in the urban communities of Arlington and Alexandria.
Communities
Since 2023, the following communities have postal addresses within the 8th district.[13][14]
Partially within the district
Elections since 1960
1960s
| Party | Candidate | Votes | % | |
|---|---|---|---|---|
| Democratic | Howard W. Smith (inc.) | 42,809 | 75.7 | |
| Republican | Lawrence M. Traylor | 13,410 | 23.7 | |
| Write-ins | 364 | 0.6 | ||
| Total votes | 56,583 | 100.00 | ||
| Democratic hold | ||||
| Party | Candidate | Votes | % | |
|---|---|---|---|---|
| Democratic | Howard W. Smith (inc.) | 20,931 | 98.7 | |
| Write-ins | 267 | 1.3 | ||
| Total votes | 21,198 | 100.00 | ||
| Democratic hold | ||||
| Party | Candidate | Votes | % | |
|---|---|---|---|---|
| Democratic | Howard W. Smith (inc.) | 49,440 | 69.4 | |
| Independent | Floyd Caldwell Bagley | 21,813 | 30.6 | |
| Write-ins | 4 | <0.1 | ||
| Total votes | 71,257 | 100.00 | ||
| Democratic hold | ||||
| Party | Candidate | Votes | % | |||
|---|---|---|---|---|---|---|
| Republican | William L. Scott | 50,782 | 57.2 | |||
| Democratic | George Rawlings | 37,929 | 42.7 | |||
| Write-ins | 21 | <0.1 | ||||
| Total votes | 88,732 | 100.00 | ||||
| Republican gain from Democratic | ||||||
| Party | Candidate | Votes | % | |
|---|---|---|---|---|
| Republican | William L. Scott (inc.) | 68,167 | 64.9 | |
| Democratic | Andrew H. McCutcheon | 49,731 | 35.1 | |
| Write-ins | 1 | <0.1 | ||
| Total votes | 141,853 | 100.00 | ||
| Republican hold | ||||
1970s
| Party | Candidate | Votes | % | |
|---|---|---|---|---|
| Republican | William L. Scott (inc.) | 68,167 | 63.8 | |
| Democratic | Darrell Stearns | 38,680 | 36.2 | |
| Write-ins | 8 | <0.1 | ||
| Total votes | 106,855 | 100.00 | ||
| Republican hold | ||||
| Party | Candidate | Votes | % | |
|---|---|---|---|---|
| Republican | Stanford Parris | 60,446 | 44.4 | |
| Democratic | Robert F. Horan | 51,444 | 37.8 | |
| Independent | William Durland | 18,654 | 13.7 | |
| Independent | Robert E. Harris | 5,553 | 4.1 | |
| Write-ins | 2 | <0.1 | ||
| Total votes | 136,099 | 100.00 | ||
| Republican hold | ||||
| Party | Candidate | Votes | % | |||
|---|---|---|---|---|---|---|
| Democratic | Herbert Harris | 53,074 | 57.6 | |||
| Republican | Stanford Parris (inc.) | 38,997 | 42.4 | |||
| Write-ins | 11 | <0.1 | ||||
| Total votes | 92,082 | 100.00 | ||||
| Democratic gain from Republican | ||||||
| Party | Candidate | Votes | % | |
|---|---|---|---|---|
| Democratic | Herbert Harris (inc.) | 83,245 | 51.6 | |
| Republican | James R. Tate | 68,729 | 42.6 | |
| Independent | Michael D. Cannon | 9,292 | 5.8 | |
| Write-ins | 61 | <0.1 | ||
| Total votes | 161,327 | 100.00 | ||
| Democratic hold | ||||
| Party | Candidate | Votes | % | |
|---|---|---|---|---|
| Democratic | Herbert Harris (inc.) | 56,137 | 50.5 | |
| Republican | Jack Herrity | 52,396 | 47.1 | |
| Independent | Charles Coe | 2,632 | 2.4 | |
| Write-ins | 5 | <0.1 | ||
| Total votes | 111,170 | 100.00 | ||
| Democratic hold | ||||
1980s
| Party | Candidate | Votes | % | |||
|---|---|---|---|---|---|---|
| Republican | Stanford Parris | 95,624 | 48.8 | |||
| Democratic | Herbert Harris (inc.) | 94,530 | 48.3 | |||
| Independent | Deborah Frantz | 5,729 | 2.9 | |||
| Write-ins | 14 | <0.1 | ||||
| Total votes | 195,897 | 100.00 | ||||
| Republican gain from Democratic | ||||||
| Party | Candidate | Votes | % | |
|---|---|---|---|---|
| Republican | Stanford Parris (inc.) | 69,620 | 49.7 | |
| Democratic | Herbert Harris | 68,071 | 48.6 | |
| Independent | Austin Morrill | 2,373 | 1.7 | |
| Write-ins | 6 | <0.1 | ||
| Total votes | 140,070 | 100.00 | ||
| Republican hold | ||||
| Party | Candidate | Votes | % | |
|---|---|---|---|---|
| Republican | Stanford Parris (inc.) | 125,015 | 55.8 | |
| Democratic | Richard L. Saslaw | 97,250 | 43.4 | |
| Independent | Donald W. Carpenter | 1,814 | 0.8 | |
| Write-ins | 12 | <0.1 | ||
| Total votes | 224,091 | 100.00 | ||
| Republican hold | ||||
| Party | Candidate | Votes | % | |
|---|---|---|---|---|
| Republican | Stanford Parris (inc.) | 72,670 | 61.8 | |
| Democratic | James H. Boren | 44,965 | 38.2 | |
| Write-ins | 20 | <0.1 | ||
| Total votes | 117,655 | 100.00 | ||
| Republican hold | ||||
| Party | Candidate | Votes | % | |
|---|---|---|---|---|
| Republican | Stanford Parris (inc.) | 154,761 | 62.3 | |
| Democratic | David Brickley | 93,561 | 37.7 | |
| Write-ins | 78 | <0.1 | ||
| Total votes | 248,400 | 100.00 | ||
| Republican hold | ||||
1990s
| Party | Candidate | Votes | % | |||
|---|---|---|---|---|---|---|
| Democratic | Jim Moran | 88,475 | 51.7 | |||
| Republican | Stanford Parris (inc.) | 76,367 | 44.6 | |||
| Independent | Robert Murphy | 5,958 | 3.5 | |||
| Write-ins | 321 | 0.2 | ||||
| Total votes | 171,121 | 100.00 | ||||
| Democratic gain from Republican | ||||||
| Party | Candidate | Votes | % | |
|---|---|---|---|---|
| Democratic | Jim Moran (inc.) | 138,542 | 56.1 | |
| Republican | Kyle E. McSlarrow | 102,717 | 41.6 | |
| Independent | Alvin West | 5,601 | 2.3 | |
| Write-ins | 266 | 0.1 | ||
| Total votes | 247,126 | 100.00 | ||
| Democratic hold | ||||
| Party | Candidate | Votes | % | |
|---|---|---|---|---|
| Democratic | Jim Moran (inc.) | 120,281 | 59.3 | |
| Republican | Kyle E. McSlarrow | 79,568 | 39.3 | |
| Independent | R. Ward Edmonds | 1,858 | 0.9 | |
| Independent | William Jones | 868 | 0.4 | |
| Write-ins | 98 | <0.1 | ||
| Total votes | 202,673 | 100.00 | ||
| Democratic hold | ||||
| Party | Candidate | Votes | % | |
|---|---|---|---|---|
| Democratic | Jim Moran (inc.) | 152,334 | 66.4 | |
| Republican | John Otey | 64,562 | 28.1 | |
| Reform | R. Ward Edmonds | 6,243 | 2.7 | |
| Independent | Sarina Grosswald | 5,239 | 2.3 | |
| Independent | Charles Severance | 740 | 0.3 | |
| Write-ins | 303 | 0.1 | ||
| Total votes | 229,421 | 100.00 | ||
| Democratic hold | ||||
| Party | Candidate | Votes | % | |
|---|---|---|---|---|
| Democratic | Jim Moran (inc.) | 97,545 | 66.7 | |
| Republican | Demaris H. Miller | 48,352 | 33.1 | |
| Write-ins | 390 | 0.3 | ||
| Total votes | 146,287 | 100.00 | ||
| Democratic hold | ||||
2000s
| Party | Candidate | Votes | % | |
|---|---|---|---|---|
| Democratic | Jim Moran (inc.) | 164,178 | 63.3 | |
| Republican | Demaris H. Miller | 88,262 | 34.1 | |
| Independent | Ronald V. Crickenberger | 3,483 | 1.3 | |
| Independent | Rick Herron | 2,805 | 1.1 | |
| Write-ins | 471 | 0.2 | ||
| Total votes | 259,199 | 100.00 | ||
| Democratic hold | ||||
| Party | Candidate | Votes | % | |
|---|---|---|---|---|
| Democratic | Jim Moran (inc.) | 102,759 | 59.8 | |
| Republican | Scott C. Tate | 64,121 | 37.3 | |
| Independent | Ronald V. Crickenberger | 4,558 | 2.7 | |
| Write-ins | 361 | 0.2 | ||
| Total votes | 171,799 | 100.00 | ||
| Democratic hold | ||||
| Party | Candidate | Votes | % | |
|---|---|---|---|---|
| Democratic | Jim Moran (inc.) | 171,986 | 59.7 | |
| Republican | Lisa Marie Cheney | 106,231 | 36.9 | |
| Independent | Jim Hurysz | 9,004 | 3.1 | |
| Write-ins | 698 | 0.2 | ||
| Total votes | 287,919 | 100.00 | ||
| Democratic hold | ||||
| Party | Candidate | Votes | % | |
|---|---|---|---|---|
| Democratic | Jim Moran (inc.) | 144,700 | 66.4 | |
| Republican | Tom M. O'Donoghue | 66,639 | 30.6 | |
| Independent | Jim Hurysz | 6,094 | 2.8 | |
| Write-ins | 476 | 0.2 | ||
| Total votes | 217,909 | 100.00 | ||
| Democratic hold | ||||
| Party | Candidate | Votes | % | |
|---|---|---|---|---|
| Democratic | Jim Moran (inc.) | 222,986 | 67.9 | |
| Republican | Mark W. Ellmore | 97,425 | 29.7 | |
| Independent Greens | J. Ron Fisher | 6,829 | 2.1 | |
| Other | Write-in candidates | 957 | 0.3 | |
| Total votes | 328,197 | 100 | ||
| Democratic hold | ||||
2010s
| Party | Candidate | Votes | % | |
|---|---|---|---|---|
| Democratic | Jim Moran (inc.) | 116,293 | 61.0 | |
| Republican | Jay Patrick Murray | 71,108 | 37.3 | |
| Independent Greens | J. Ron Fisher | 2,704 | 1.4 | |
| Other | Write-in candidates | 492 | 0.2 | |
| Total votes | 233,368 | 100 | ||
| Turnout | 233,368 of 476,011 | 49.0 | ||
| Democratic hold | ||||
| Party | Candidate | Votes | % | |
|---|---|---|---|---|
| Democratic | Jim Moran (inc.) | 226,847 | 64.6 | |
| Republican | Jay Patrick Murray | 107,370 | 30.6 | |
| Independent | Jason Howell | 10,180 | 2.9 | |
| Independent Greens | Janet Murphy | 5,985 | 1.7 | |
| Write-in | 805 | 0.2 | ||
| Total votes | 351,187 | 100 | ||
| Democratic hold | ||||
| Party | Candidate | Votes | % | |
|---|---|---|---|---|
| Democratic | Don Beyer | 128,102 | 63.1 | |
| Republican | Micah Edmond | 63,810 | 31.4 | |
| Independent | Gwendolyn Beck | 5,420 | 2.7 | |
| Libertarian | Jeffrey Carson | 4,409 | 2.2 | |
| Independent Greens | Gerry Blais | 963 | 0.5 | |
| Write-in | 372 | 0.2 | ||
| Total votes | 203,076 | 100 | ||
| Democratic hold | ||||
| Party | Candidate | Votes | % | |
|---|---|---|---|---|
| Democratic | Don Beyer (inc.) | 246 653 | 68.4 | |
| Republican | Charles A. Hernick | 98,387 | 27.3 | |
| Independent | Julio Gracia | 14,664 | 4.0 | |
| Write-ins | 972 | 0.2 | ||
| Total votes | 360,676 | 100 | ||
| Democratic hold | ||||
| Party | Candidate | Votes | % | |
|---|---|---|---|---|
| Democratic | Don Beyer (inc.) | 247,137 | 76.1 | |
| Republican | Thomas Oh | 76,899 | 23.7 | |
| Write-ins | 712 | 0.2 | ||
| Turnout | 324,748 | 54.6 | ||
| Total votes | 324,748 | 100 | ||
| Democratic hold | ||||
2020s
| Party | Candidate | Votes | % | |
|---|---|---|---|---|
| Democratic | Don Beyer (inc.) | 301,454 | 76.0 | |
| Republican | Jeff Jordan | 95,365 | 24.0 | |
| Write-in | 926 | 0.2 | ||
| Total votes | 396,819 | 100 | ||
| Democratic hold | ||||
| Party | Candidate | Votes | % | |
|---|---|---|---|---|
| Democratic | Don Beyer (inc.) | 197,760 | 73.5 | |
| Republican | Karina Lipsman | 66,589 | 24.8 | |
| Independent | Teddy Fikre | 4,078 | 1.5 | |
| Write-in | 509 | 0.2 | ||
| Total votes | 268,936 | 100 | ||
| Democratic hold | ||||
List of members representing the district
| Representative | Party | Years | Cong ress |
Electoral history |
|---|---|---|---|---|
| District established March 4, 1789 | ||||
 Josiah Parker (Macclesfield) |
Anti-Administration | March 4, 1789 – March 3, 1793 |
1st 2nd |
Elected in 1789. Re-elected in 1790. Elected to Virginia 11th District |
 Thomas Claiborne (Brunswick County) |
Anti-Administration | March 4, 1793 – March 3, 1795 |
3rd 4th 5th |
Elected in 1793. Re-elected in 1795. Re-elected in 1797. Lost re-election. |
| Democratic-Republican | March 4, 1795 – March 3, 1799 | |||
.jpg.webp) Samuel Goode (Chesterfield County) |
Democratic-Republican | March 4, 1799 – March 3, 1801 |
6th | Elected in 1799. [data missing] |
Thomas Claiborne (Brunswick County) |
Democratic-Republican | March 4, 1801 – March 3, 1803 |
7th | Elected in 1801. Redistricted to the 17th district. |
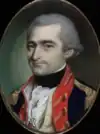
| Walter Jones (Hayfield) |
Democratic-Republican | March 4, 1803 – March 3, 1811 |
8th 9th 10th 11th |
Elected in 1803. Re-elected in 1805. Re-elected in 1807. Re-elected in 1809. Retired. |
| John Hungerford (Leedstown) |
Democratic-Republican | March 4, 1811 – November 29, 1811 |
12th | Elected in 1811. Lost election contest. |
| John Taliaferro (Fredericksburg) |
Democratic-Republican | November 29, 1811 – March 3, 1813 |
12th | Won election contest. Redistricted to the 9th district and lost re-election. |
| Joseph Lewis Jr. (Upperville) |
Federalist | March 4, 1813 – March 3, 1817 |
13th 14th |
Redistricted from the 7th district and re-elected in 1813. Re-elected in 1815. Retired. |
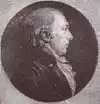
 Charles F. Mercer (Aldie) |
Federalist | March 4, 1817 – March 3, 1823 |
15th 16th 17th |
Elected in 1817. Re-elected in 1819. Re-elected in 1821. Redistricted to the 14th district. |
| Burwell Bassett (Williamsburg) |
Democratic-Republican (Crawford) | March 4, 1823 – March 3, 1825 |
18th 19th 20th |
Redistricted from the 13th district and re-elected in 1823. Re-elected in 1825. Re-elected in 1827. Lost re-election. |
| Jackson | March 4, 1825 – March 3, 1829 | |||
| Richard Coke Jr. (Williamsburg) |
Jackson | March 4, 1829 – March 3, 1833 |
21st 22nd |
Elected in 1829. Re-elected in 1831. Retired. |
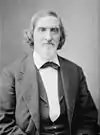
 Henry A. Wise (Accomac) |
Jackson | March 4, 1833 – March 3, 1837 |
23rd 24th 25th 26th 27th |
Elected in 1833. Re-elected in 1835. Re-elected in 1837. Re-elected in 1839. Re-elected in 1841. Redistricted to the 7th district. |
| Whig | March 4, 1837 – March 3, 1843 | |||
| Willoughby Newton (Hague) |
Whig | March 4, 1843 – March 3, 1845 |
28th | Elected in 1843. Lost re-election. |
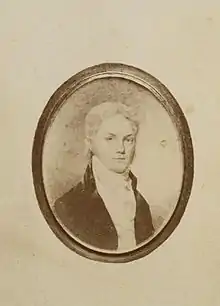
.jpg.webp) Robert M. T. Hunter (Lloyds) |
Whig | March 4, 1845 – March 3, 1847 |
29th | Elected in 1845. Elected to U.S. Senate |
 Richard L. T. Beale (Hague) |
Democratic | March 4, 1847 – March 3, 1849 |
30th | Elected in 1847. Retired. |
| Alexander R. Holladay (Mansfield) |
Democratic | March 4, 1849 – March 3, 1853 |
31st 32nd |
Elected in 1849. Re-elected in 1851. Retired. |
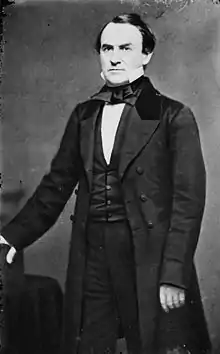 Charles J. Faulkner, Sr. (Martinsburg) |
Democratic | March 4, 1853 – March 3, 1859 |
33rd 34th 35th |
Elected in 1853. Re-elected in 1855. Re-elected in 1857. Appointed Minister to France. |
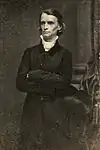
 Alexander R. Boteler (Shepherdstown) |
Opposition | March 4, 1859 – March 3, 1861 |
36th | Elected in 1859. Retired. |
| District inactive | March 4, 1861 – January 28, 1870 |
36th 37th 38th 39th 40th 41st |
Civil War and Reconstruction | |
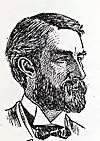
.jpg.webp) James K. Gibson (Abingdon) |
Conservative | January 28, 1870 – March 3, 1871 |
41st | Elected in 1870. Retired. |
 William Terry (Wytheville) |
Democratic | March 4, 1871 – March 3, 1873 |
42nd | Elected in 1870. Lost re-election. |
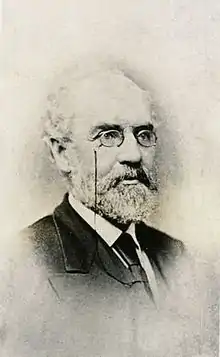
 Eppa Hunton (Warrenton) |
Democratic | March 4, 1873 – March 3, 1881 |
43rd 44th 45th 46th |
Elected in 1872. Re-elected in 1874. Re-elected in 1876. Re-elected in 1878. Retired. |
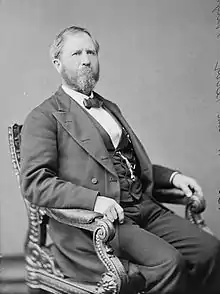
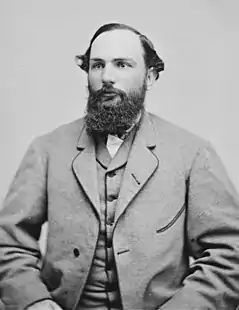
.jpg.webp) John S. Barbour Jr. (Alexandria) |
Democratic | March 4, 1881 – March 3, 1887 |
47th 48th 49th |
Elected in 1880. Re-elected in 1882. Re-elected in 1884. Retired. |
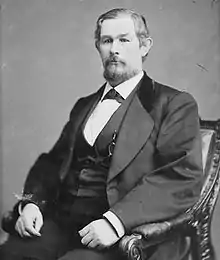
 William H. F. Lee (Ravensworth) |
Democratic | March 4, 1887 – October 15, 1891 |
50th 51st 52nd |
Elected in 1886. Re-elected in 1888. Re-elected in 1890. Died. |
| Vacant | October 16, 1891 – December 8, 1891 |
52nd | ||
 Elisha E. Meredith (Brentsville) |
Democratic | December 9, 1891 – March 3, 1897 |
52nd 53rd 54th |
Elected to finish Lee's term. Re-elected in 1892. Re-elected in 1894. Retired. |
 John F. Rixey (Brandy) |
Democratic | March 4, 1897 – February 8, 1907 |
55th 56th 57th 58th 59th |
Elected in 1896. Re-elected in 1898. Re-elected in 1900. Re-elected in 1902. Re-elected in 1904. Re-elected in 1906. Died. |
| Vacant | February 9, 1907 – November 4, 1907 |
59th 60th |
||
 Charles C. Carlin (Alexandria) |
Democratic | November 5, 1907 – March 3, 1919 |
60th 61st 62nd 63rd 64th 65th |
Elected to finish Rixley's term. Re-elected in 1908. Re-elected in 1910. Re-elected in 1912. Re-elected in 1914. Re-elected in 1916. Re-elected in 1918. Resigned. |
| Vacant | March 4, 1919 – April 26, 1919 |
66th | ||
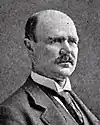
.jpg.webp) R. Walton Moore (Fairfax) |
Democratic | April 27, 1919 – March 3, 1931 |
66th 67th 68th 69th 70th 71st |
Elected to finish Carlin's term. Re-elected in 1920. Re-elected in 1922. Re-elected in 1924. Re-elected in 1926. Re-elected in 1928. Retired. |
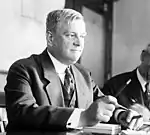
.jpg.webp) Howard W. Smith (Alexandria) |
Democratic | March 4, 1931 – March 3, 1933 |
72nd | Elected in 1930. Redistricted to the at-large seat. |
| District inactive | March 4, 1933 – January 3, 1935 |
73rd | ||
 Howard W. Smith (Broad Run) |
Democratic | January 3, 1935 – January 3, 1967 |
74th 75th 76th 77th 78th 79th 80th 81st 82nd 83rd 84th 85th 86th 87th 88th 89th |
Redistricted from the at-large seat and re-elected in 1934. Re-elected in 1936. Re-elected in 1938. Re-elected in 1940. Re-elected in 1942. Re-elected in 1944. Re-elected in 1946. Re-elected in 1948. Re-elected in 1950. Re-elected in 1952. Re-elected in 1954. Re-elected in 1956. Re-elected in 1958. Re-elected in 1960. Re-elected in 1962. Re-elected in 1964. Lost re-election. |
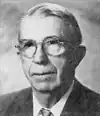
 William L. Scott (Fairfax) |
Republican | January 3, 1967 – January 3, 1973 |
90th 91st 92nd |
Elected in 1966. Re-elected in 1968. Re-elected in 1970. Elected to U.S. Senate. |
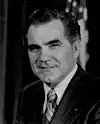
 Stanford Parris (Fairfax Station) |
Republican | January 3, 1973 – January 3, 1975 |
93rd | Elected in 1972. Lost re-election. |
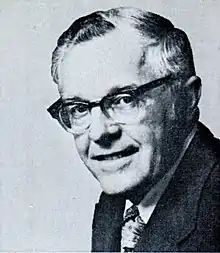
 Herbert E. Harris (Alexandria) |
Democratic | January 3, 1975 – January 3, 1981 |
94th 95th 96th |
Elected in 1974. Re-elected in 1976. Re-elected in 1978. Lost re-election. |
Stanford Parris (Fairfax Station) |
Republican | January 3, 1981 – January 3, 1991 |
97th 98th 99th 100th 101st |
Elected in 1980. Re-elected in 1982. Re-elected in 1984. Re-elected in 1986. Re-elected in 1988. Lost re-election. |
 Jim Moran (Alexandria) |
Democratic | January 3, 1991 – January 3, 2015 |
102nd 103rd 104th 105th 106th 107th 108th 109th 110th 111th 112th 113th |
Elected in 1990. Re-elected in 1992. Re-elected in 1994. Re-elected in 1996. Re-elected in 1998. Re-elected in 2000. Re-elected in 2002. Re-elected in 2004. Re-elected in 2006. Re-elected in 2008. Re-elected in 2010. Re-elected in 2012. Retired. |
.jpeg.webp) Don Beyer (Alexandria) |
Democratic | January 3, 2015 – present |
114th 115th 116th 117th 118th |
Elected in 2014. Re-elected in 2016. Re-elected in 2018. Re-elected in 2020. Re-elected in 2022. |
Historical district boundaries
The Virginia Eighth District started in 1788 covering the counties of Norfolk, Accomack, Northampton, Princess Anne, Nansemond, Isle of Wight, Surry and Southampton.[17]
.tif.png.webp)
References
- "Congressional Districts Relationship Files (state-based)". www.census.gov. US Census Bureau Geography. Retrieved April 10, 2018.
- "My Congressional District". www.census.gov. Center for New Media & Promotion (CNMP), US Census Bureau. Retrieved October 6, 2023.
- "My Congressional District".
- "2022 Cook PVI: District Map and List". Cook Political Report. Retrieved January 10, 2023.
- Feinberg, Lawrence (March 11, 1981). "N.Va. Minority Population Grew Sharply in 1970s". The Washington Post. Retrieved May 18, 2023.
- "Dave Leip's Atlas of U.S. Presidential Elections - County Data". Archived from the original on June 19, 2006.
- "Official Results/President". Commonwealth of Virginia/November 2nd – General Election. Virginia State Board of Elections. Archived from the original on December 29, 2012.
- "President>President And Vice President>Votes By District". November 2008 Official Results. Virginia State Board of Elections. Archived from the original on March 4, 2016.
- "President>President And Vice President>Votes By District". November 6, 2012 General Election Official Results. Virginia State Board of Elections. Archived from the original on August 9, 2016.
- "2016 November General President". Archived from the original on December 23, 2016. Retrieved October 1, 2020.
- "Daily Kos Elections' presidential results by congressional district for 2020, 2016, and 2012".
- "Congressional District 8, Virginia - Fact Sheet". fastfacts.census.gov. Archived from the original on July 17, 2011. Retrieved September 20, 2007.
- "Find Your Representative". United States House of Representatives. Retrieved May 15, 2023.
- "Look Up a ZIP Code". USPS.com. United States Postal Service. Retrieved May 15, 2023.
- "November 6, 2012 General Election Official Results". Virginia State Board of Elections. Archived from the original on May 12, 2013. Retrieved December 14, 2012.
- "Election Results | Virginia Department of Elections". Archived from the original on November 7, 2014. Retrieved November 27, 2014.
- Statute of 20 November 1788
Further reading
- Martis, Kenneth C. (1989). The Historical Atlas of Political Parties in the United States Congress. New York: Macmillan Publishing Company.
- Martis, Kenneth C. (1982). The Historical Atlas of United States Congressional Districts. New York: Macmillan Publishing Company.
- Congressional Biographical Directory of the United States 1774–present