wikiHow is a “wiki,” similar to Wikipedia, which means that many of our articles are co-written by multiple authors. To create this article, 29 people, some anonymous, worked to edit and improve it over time.
This article has been viewed 171,821 times.
Learn more...
A line plot is a graph that shows the frequency of data occurring along a number line. Line plots provide a quick and easy way to organize data and are best used when comparing fewer than 25 different numbers. If you want to know how to make a line plot, just look at Step 1 below to get started.
Steps
-
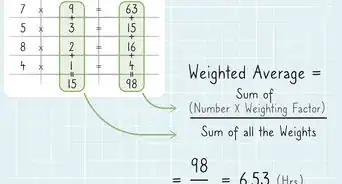
1Gather your data. Your data will be comprised of the frequency with which a certain act or event occurs within a given set of people or things.[1] For example, let's say that 10 students in a third grade class were asked the following question: "How many books did you read over the summer?" Your data is the amount of books that were read by each student; it does not matter which student read how many books. What matters is how many books were read. So, let's say that these are the ten different responses for how many books were read over the summer:
- 5, 1, 2, 5, 8, 0, 3, 2, 2, 1
-
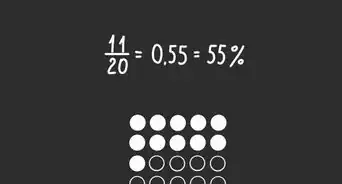
2Organize your data in numerical order. Organizing your data from smallest to largest can help you interpret the data and to get a better sense of the numbers and scope of numbers you are working with.[2] Take the numbers you have for how many books were read by each student and reorganize them from smallest to largest. You can cross off each number from the first list before you write it on the second list. When you're done, check to see that you still have the same amount of numbers (10). Here is how they would look:
- 0, 1, 1, 2, 2, 2, 3, 5, 5, 8
Advertisement -
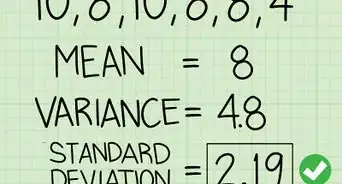
3Create a horizontal line. Check out your data and see what your largest and smallest data is.[3] Your smallest number is 0 and your largest is 8, so you will have to draw a horizontal line that spans from 0 to 8. If you're working with a larger range of numbers, then you won't have to label every single number. For your purposes here, though, you can draw a horizontal line that labels the numbers from 0-8, moving from left to right. It can just look like this:
- 0 1 2 3 4 5 6 7 8
-
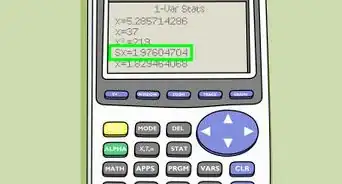
4Mark an "X" above the horizontal line every time the data occurs.[4] So, mark 1 X above 0 because it occurs once, mark 2 Xs above 1 because it occurs twice, mark 3 Xs above 2 because it occurs 3 times, mark 2 Xs above 5 because it occurs twice, and mark 1 X above 8 because it occurs once. Now that you have made a line plot of the frequency with which a class of 10 students read a certain amount of books, you can sit back and interpret the data.
-
5Interpret the data. Now that you've organized your data in a line plot, you can sit back and look at a few key components of the data.[5] Here is what people look for most commonly when they interpret the data in a line plot:
- The most commonly occurring event. In this scenario, it was most common for students to read 2 books over the summer, since "2 books" occurs more frequently than any other set of data.
- Outliers. "8" is an outlier because this set of data is far away from the others, and breaks the pattern of the most common amount of books read by students.
- Gaps. There are gaps between "3 books" and "5 books" and "5 books" and "8 books."
- Clusters. There is a cluster of data between "1 book" and "2 books," which means that a lot of the books that were read fall within those categories.


Community Q&A
-
QuestionWhat are line plots for?
 DonaganTop AnswererAs the above article states, line plots are used for organizing and comparing data.
 -
QuestionHow do I multiply and add when making a line plot?
 Community AnswerTo add, you can find your first number and count up the number you are adding to it. You will land on a whole number or a mixed number: that is your answer. To multiply, you can count from 0 up to your number. Let's say your number was 3. It takes you 1,2,3 "hops" to get from 0-3. Now, whatever you're multiplying by, count up that many times. For example, for 3x2, you'd "hop" up three, then another three to get 6.
 -
QuestionCan a line plot start with a number other than 0?
 Community AnswerYes, it can be a positive number or a negative number.


-Step-16.webp)

References
- ↑ https://www.youtube.com/watch?v=mHCBtKFhV8M
- ↑ https://www.varsitytutors.com/hotmath/hotmath_help/topics/line-plots
- ↑ https://www.mathplanet.com/education/algebra-2/equations-and-inequalities/line-plots-and-stem-and-leaf-plots
- ↑ https://www.mathplanet.com/education/algebra-2/equations-and-inequalities/line-plots-and-stem-and-leaf-plots
- ↑ https://www.youtube.com/watch?v=313MSSdpNU0
- http://www.learner.org/courses/learningmath/data/session2/part_b/making.html
About This Article
To make a line plot, organize your gathered data in numerical order from smallest to largest, or vice versa. Then, draw a number line that includes all of the numbers in your data, moving from left to right. Mark an "X" above the number for each time that specific number occurs in your data set. Look at the data to identify trends and patterns. For tips on interpreting the data by finding the outlier, clusters, and most commonly occurring event, read on!