X
wikiHow is a “wiki,” similar to Wikipedia, which means that many of our articles are co-written by multiple authors. To create this article, volunteer authors worked to edit and improve it over time.
This article has been viewed 26,186 times.
Learn more...
This instruction set explains how to solve a matrix equation and perform statistical analysis on a matrix in MATLAB.
- The matrix equations will be in the form Ax=B.
- The statistical analysis will find the total number of data points as well as the minimum, maximum, and range. In addition, it will include the sum, mean, and standard deviation. This section can be used on its own (without Part 1).
- For those with experience in MATLAB programming, the bold print offers an overview of each step.
- For new and less confident MATLAB users, the non-bolded text will offer a more detailed description of each step.
- The italicized text in each step offers an example of the step; it is suggested that those unfamiliar with programming make use of these examples to compare with what they have typed.
Steps
Part 1
Part 1 of 2:
Solving the Matrix Equation
-
1Standardize your matrices to be usable in the standard form of a matrix equation, Ax = B.
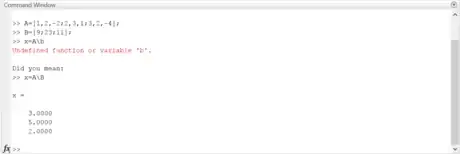
- For this instruction set, the matrix equation [1 2 -2 ; 2 3 1 ; 3 2 -4] x = [9 ; 23 ; 11] will be used to illustrate the process of solving the equation.
- The matrix [1 2 -2 ; 2 3 1 ; 3 2 -4] is the coefficient matrix.
- The B matrix is [ 9 ; 23 ; 11].
- The variable x is the matrix of solutions to the equation.
-
2Create the A matrix.
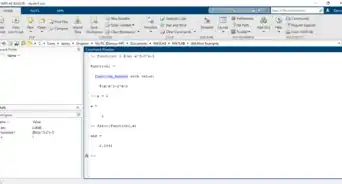
- Open MATLAB.
- Click in the command window (the large window in the center of the screen) to prepare for typing text.
- Type the variable name, in this case 'A', and the equals sign ( = ).
- Insert a left bracket ( [ ) and type the given A matrix, starting from the top left and working to the right, separating each number by a comma or a space. Once the end of a row is reached, signify this by including a semicolon. Then type the first number of the next row and continue in the same way as above. Include the entire matrix in this way and then end the matrix with a right bracket ( ] ),
- Hit enter to store the variable in the MATLAB workspace.
- For the example matrix given in step 1, the user would type A = [ 1 2 -2 ; 2 3 1 ; 3 2 -4 ] and hit enter.
Advertisement -
3Create the B matrix.
- Type the B matrix in the same format as explained above, or follow the shortened instructions below.
- Type the variable name followed by an equals sign. Then type a left bracket, the entries of the matrix, and a right bracket. Then hit enter.
- For the example, the user would type B = [ 9 ; 23 ; 11 ] and then hit enter.
-
4Check to see if the matrices are compatible for solving matrix equations. Do this by storing the size of each matrix as a variable and checking to see if there are the same number of columns in A as there rows in B.
- Visit http://math.sfsu.edu/smith/Documents/AppendixC.pdf to review why matrices must be tested for compatibility before being used in matrix algebra.
- Create a size variable for matrix A. Type a new variable name followed by an equals sign, then 'size', and the variable for the A matrix enclosed in parenthesis. Hit enter.
- For the example matrix, the user would type Asize = size(A) and hit enter.
- Create a size variable for matrix B in the same way as above.
- For the example, the user would type Bsize = size(B) and hit enter.
- Compare the rows of A to the columns of B by typing a new variable name followed by an equals sign. Then type a left parenthesis, the A size variable name and '(2)', two equal signs, your B size variable name, '(1)' and close the parenthesis. Hit enter.
- For the example matrix, the user would type comp = (Asize(2) == Bsize(1)) and hit enter.
- If the matrices are compatible, the output will be 1 and the matrices can be used for matrix equations.
- If the matrices are not compatible, the output will be 0 and the matrices cannot be used for matrix equations.
-
5
Advertisement
Part 2
Part 2 of 2:
Performing Statistical Analysis
-
1Create the A matrix as a single row matrix.
- Type a new variable name for A, followed by an equals sign. Type a left bracket ( [ ) and each number in the matrix separated by a space or a comma. Close with a right bracket ( ] ) and hit enter.
- For the example matrix given in step 1 of part 1, the user would type Arow = [ 1 2 -2 2 3 1 3 2 -4] and hit enter.
-
2
-
3
-
4
-
5Calculate the range of the data by subtracting the maximum value from the minimum value.
- Type a new variable name, followed by an equals sign. Then type the maximum variable name, the minus sign ( - ), and the minimum variable name. Hit enter.
- For the example, the user would type range = Amax - Amin and hit enter.
-
6
-
7
-
8Calculate the standard deviation (the square root of the variance) of the data by using the built-in function 'std'.
- Type a new variable name, followed by an equals sign. Then type 'std' and the name of the A matrix enclosed in parenthesis. Hit enter.
- For the example, the user would type Astd = std(Arow) and hit enter.
-
9Create a table to display the statistical analysis using the built-in function 'table'.
- Type a new variable name, followed by an equals sign. Then type 'table' and enclose each of the variables created for steps two through eight, separated by commas, enclosed in parenthesis. Hit enter.
- For the example, the user would type Stats = table(Ntotal, Amin, Amax, range, Asum, Amean, Astd) and hit enter.
Advertisement
Warnings
- Variable names are case sensitive and cannot contain any special characters, such as $,3,@,!, etc.⧼thumbs_response⧽
Advertisement
References
- The screenshots included are from the 'R2016b' student download of MATLAB.
About This Article
Advertisement


