Bonavista—Burin—Trinity
Bonavista—Burin—Trinity is a federal electoral district on Newfoundland Island in Newfoundland and Labrador, Canada, that has been represented in the House of Commons of Canada since 2015.
Bonavista—Burin—Trinity was created by the 2012 federal electoral boundaries redistribution and has been legally defined in the 2013 representation order. It came into effect upon the call of the 42nd Canadian federal election, scheduled for October 2015.[3] It was created out of parts of the electoral districts of Random—Burin—St. George's (41%), Bonavista—Gander—Grand Falls—Windsor (37%) and Avalon (22%).[4]
Following the 2022 Canadian federal electoral redistribution, this riding will be renamed Terra Nova—The Peninsulas at the first election held after approximately April 2024, and will gain the east coast of Placentia Bay from Avalon, while losing Salmon Cove to Avalon.[5]
Demographics
According to the 2011 National Household Survey, Bonavista—Burin—Trinity is the most Christian riding in Canada with 97% of the population claiming to have a Christian affiliation. It is also the only riding in Canada where less than 3% of the population has no religious affiliation.[6]
- According to the Canada 2021 Census[7]
Ethnic groups: 96.8% White, 2.4% Indigenous
Languages: 99.1% English
Religions: 88.8% Christian (25.8% Anglican, 22.9% United Church, 20.3% Catholic, 11.2% Methodist, 4.1% Pentecostal), 10.8% No Religion
Median income: $31,600 (2020)
Average income: $39,840 (2020)
Geography
The riding contains the Bonavista Bay area, the Burin Peninsula and the Trinity Bay area of Newfoundland.
History
The riding of Bonavista—Burin—Trinity was created in 2013 from the electoral districts of Random—Burin—St. George's, Bonavista—Gander—Grand Falls—Windsor and Avalon.
| Parliament | Years | Member | Party | |
|---|---|---|---|---|
| Bonavista—Burin—Trinity Riding created from Random—Burin—St. George's, Bonavista—Gander—Grand Falls—Windsor and Avalon |
||||
| 42nd | 2015–2017 | Judy Foote | Liberal | |
| 2017–2019 | Churence Rogers | |||
| 43rd | 2019–2021 | |||
| 44th | 2021–present | |||
Election results
2021 general election
| 2021 Canadian federal election | ||||||||
|---|---|---|---|---|---|---|---|---|
| Party | Candidate | Votes | % | ±% | Expenditures | |||
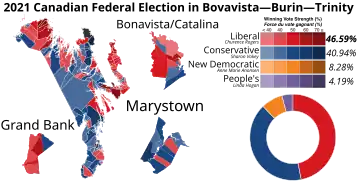
| Liberal | Churence Rogers | 13,972 | 46.59 | +0.89 | $68,517.84 | |||
| Conservative | Sharon Vokey | 12,278 | 40.93 | +1.47 | none listed | |||
| New Democratic | Anne Marie Anonsen | 2,484 | 8.28 | -3.70 | $393.05 | |||
| People's | Linda Hogan | 1,257 | 4.19 | – | none listed | |||
| Total valid votes/expense limit | 29,991 | 98.42 | +0.28 | $110,716.47 | ||||
| Total rejected ballots | 482 | 1.58 | -0.27 | |||||
| Turnout | 30,473 | 52.05 | -3.78 | |||||
| Registered voters | 58,541 | |||||||
| Liberal hold | Swing | -0.29 | ||||||
| Source: Elections Canada[8][9][10] | ||||||||
2019 general election
| 2019 Canadian federal election | ||||||||
|---|---|---|---|---|---|---|---|---|
| Party | Candidate | Votes | % | ±% | Expenditures | |||
| Liberal | Churence Rogers | 14,707 | 45.70 | -23.52 | $23,874.25 | |||
| Conservative | Sharon Vokey | 12,697 | 39.46 | +16.65 | none listed | |||
| New Democratic | Matthew Cooper | 3,855 | 11.98 | +7.25 | $6.68 | |||
| Green | Kelsey Reichel | 920 | 2.86 | +1.80 | none listed | |||
| Total valid votes/expense limit | 32,179 | 98.14 | -1.42 | 107,548.45 | ||||
| Total rejected ballots | 609 | 1.85 | +1.43 | |||||
| Turnout | 32,788 | 55.83 | +34.28 | |||||
| Eligible voters | 58,729 | |||||||
| Liberal hold | Swing | -20.09 | ||||||
| Source: Elections Canada[11][12] | ||||||||
2017 by-election
| Canadian federal by-election, December 11, 2017 Resignation of Judy Foote | ||||||||
|---|---|---|---|---|---|---|---|---|
| Party | Candidate | Votes | % | ±% | Expenditures | |||
| Liberal | Churence Rogers | 8,717 | 69.22 | -12.58 | ||||
| Conservative | Mike Windsor | 2,878 | 22.85 | +12.78 | ||||
| New Democratic | Tyler James Downey | 598 | 4.75 | -2.54 | ||||
| Libertarian | Shane Stapleton | 262 | 2.08 | N/A | ||||
| Green | Tyler Colbourne | 138 | 1.10 | +0.25 | ||||
| Total valid votes/Expense limit | 12,593 | 100.00 | 101,914.76 | |||||
| Total rejected ballots | 54 | 0.42 | +0.7 | |||||
| Turnout | 12,648 | 21.52 | -35.83 | |||||
| Eligible voters | 58,771 | |||||||
| Liberal hold | Swing | -12.68 | ||||||
| [13][14][15] | ||||||||
2015 general election
| 2015 Canadian federal election | ||||||||
|---|---|---|---|---|---|---|---|---|
| Party | Candidate | Votes | % | ±% | Expenditures | |||
| Liberal | Judy M. Foote | 28,704 | 81.80 | +27.33 | $40,957.22 | |||
| Conservative | Mike Windsor | 3,534 | 10.07 | –20.43 | $7,929.44 | |||
| New Democratic | Jenn Brown | 2,557 | 7.29 | –6.66 | $616.65 | |||
| Green | Tyler John Colbourne | 297 | 0.85 | –0.03 | – | |||
| Total valid votes/Expense limit | 35,092 | 100.00 | $214,042.22 | |||||
| Total rejected ballots | 173 | 0.49 | – | |||||
| Turnout | 35,265 | 57.36 | – | |||||
| Eligible voters | 61,475 | |||||||
| Liberal notional hold | Swing | +23.88 | ||||||
| Source: Elections Canada,[16][17] | ||||||||
| 2011 federal election redistributed results[18] | |||
|---|---|---|---|
| Party | Vote | % | |
| Liberal | 16,805 | 54.46 | |
| Conservative | 9,412 | 30.50 | |
| New Democratic | 4,303 | 13.95 | |
| Green | 270 | 0.88 | |
| Others | 66 | 0.21 | |
Student Vote Results
2019
| 2019 Canadian federal election | ||||||||
|---|---|---|---|---|---|---|---|---|
| Party | Candidate | Votes | % | ±% | ||||
| New Democratic | Matthew Cooper | 760 | 34.88 | +21.13 | ||||
| Liberal | Churence Rogers | 607 | 27.86 | -37.65 | ||||
| Conservative | Sharon Vokey | 446 | 20.47 | +11 | ||||
| Green | Kelsey Reichel | 366 | 16.8 | +5.54 | ||||
| Total valid votes | 2,179 | 100.0 | – | |||||
| Source: Student Vote Canada[19] | ||||||||
2015
| 2015 Canadian federal election | ||||||||
|---|---|---|---|---|---|---|---|---|
| Party | Candidate | Votes | % | |||||
| Liberal | Judy M. Foote | 948 | 65.51 | |||||
| New Democratic | Jenn Brown | 199 | 13.75 | |||||
| Green | Tyler John Colbourne | 163 | 11.26 | |||||
| Conservative | Mike Windsor | 137 | 9.47 | |||||
| Total valid votes | 1,447 | 100.0 | ||||||
| Source: Student Vote Canada[20] | ||||||||
References
- Statistics Canada: 2023
- Statistics Canada: 2023
- "Timeline for the Redistribution of Federal Electoral Districts".
- "Report – Newfoundland and Labrador".
- "New Federal Electoral Map for Newfoundland and Labrador".
- "National Household Survey (NHS)". January 15, 2001.
- "2021 National Household Survey Profile - Federal electoral district (2013 Representation Order)". February 8, 2023.
- "Confirmed candidates — Bonavista—Burin—Trinity". Elections Canada. Retrieved September 20, 2021.
- "Election Results". Elections Canada. Retrieved September 27, 2021.
- "Candidate Campaign Returns". Elections Canada. Retrieved July 19, 2022.
- "List of confirmed candidates". Elections Canada. Retrieved October 3, 2019.
- "Election Night Results". Elections Canada. Retrieved November 6, 2019.
- "Prime Minister of Canada announces by-elections". Prime Minister's Office. November 5, 2017.
- "Official Voting Results". www.elections.ca. Retrieved August 21, 2020.
- Canada, Elections (August 27, 2018). "2017 By-elections – Bonavista–Burin–Trinity (Newfoundland and Labrador)". www.elections.ca. Retrieved August 21, 2020.
- "October 19, 2015 Election Results — Bonavista—Burin—Trinity (Preliminary results)". Elections Canada. October 19, 2015. Retrieved October 24, 2015.
- Elections Canada – Preliminary Election Expenses Limits for Candidates Archived March 4, 2016, at the Wayback Machine
- Pundits' Guide to Canadian Elections
- "Student Vote Canada 2019". Retrieved September 22, 2020.
- "Student Vote". Retrieved September 22, 2020.