Heat wave
A heat wave, or heatwave,[1] or extreme heat, is a period of excessively hot weather, which may be accompanied by high humidity, especially in oceanic climate countries. While definitions vary,[2] a heat wave is usually measured relative to the usual climate in the area and relative to normal temperatures for the season. Temperatures that people from a hotter climate consider normal can be called a heat wave in a cooler area if they are outside the normal climate pattern for that area.[3]

The term is applied both to hot weather variations and to extraordinary spells of hot weather which may occur only once a century. Severe heat waves have caused catastrophic crop failures, thousands of deaths from hyperthermia, increased risk of wildfires in areas with drought, and widespread power outages due to increased use of air conditioning. A heat wave is considered extreme weather, and poses danger to human health because heat and sunlight overwhelm the human body's cooling system. Heat waves can usually be detected using forecasting instruments so that a warning can be issued.
Heatwaves often have complex effects on human economies, due to less productivity of workers, disruption of agricultural and industrial processes and damage to infrastructure not adapted for extreme heat.[4][5]
Heatwaves have become more frequent, and over land more intense, almost everywhere since the 1950s, due to climate change.[6]
Definitions
There are several quite similar definitions of heat waves:
- The IPCC defines heat wave as "a period of abnormally hot weather, often defined with reference to a relative temperature threshold, lasting from two days to months."[7]: 2911
- A definition based on the Heat Wave Duration Index is that a heat wave occurs when the daily maximum temperature of more than five consecutive days exceeds the average maximum temperature by 5 °C (9 °F), the normal period being 1961–1990.[8] The same definition is used by the World Meteorological Organization.[9]
- A definition from the Glossary of Meteorology is:[10] "A period of abnormally and uncomfortably hot and usually humid weather."
Europe
In the Netherlands, a heat wave is defined as a period of at least five consecutive days in which the maximum temperature in De Bilt exceeds 25 °C (77 °F), provided that on at least three days in this period the maximum temperature in De Bilt exceeds 30 °C (86 °F). This definition of a heat wave is also used in Belgium (with Ukkel as reference point) and Luxembourg.
In Denmark, a national heat wave (hedebølge) is defined as a period of at least 3 consecutive days of which period the average maximum temperature across more than fifty percent of the country exceeds 28 °C (82.4 °F) – the Danish Meteorological Institute further defines a "warmth wave" (varmebølge) when the same criteria are met for a 25 °C (77.0 °F) temperature,[11] while in Sweden, a heat wave is defined as at least five days in a row with a daily high exceeding 25 °C (77.0 °F).[12]
In Greece, according to the Hellenic National Metereological Service, a heat wave is defined as three consecutive days at or above 39 °C (102 °F) and a minimum temperature in the same period at or over 26 °C (79 °F), with no winds or with weak winds, and the above conditions being observed in a broad area.
In the United Kingdom, the Met Office operates a Heat Health Watch system which places each Local Authority region into one of four levels. Heatwave conditions are defined by the maximum daytime temperature and minimum nighttime temperature rising above the threshold for a particular region. The length of time spent above that threshold determines the particular level. Level 1 is normal summer conditions. Level 2 is reached when there is a 60% or higher risk that the temperature will be above the threshold levels for two days and the intervening night. Level 3 is triggered when the temperature has been above the threshold for the preceding day and night, and there is a 90% or higher chance that it will stay above the threshold in the following day. Level 4 is triggered if conditions are more severe than those of the preceding three levels. Each of the first three levels is associated with a particular state of readiness and response by the social and health services, and Level 4 is associated with more widespread response.[13]
Other regions
In the United States, definitions also vary by region, usually meaning a period of at least two or more days of excessively hot weather.[14] In the Northeast, a heat wave is typically defined as three consecutive days where the temperature reaches or exceeds 90 °F (32.2 °C), but not always as this ties in with humidity levels to determine a heat index threshold.[15] The same does not apply to drier climates. A heat storm is a Californian term for an extended heat wave. Heat storms occur when the temperature reaches 100 °F (37.8 °C) for three or more consecutive days over a wide area (tens of thousands of square miles). The National Weather Service issues heat advisories and excessive heat warnings when unusual periods of hot weather are expected.
In Adelaide, South Australia, a heat wave is defined as five consecutive days at or above 35 °C (95 °F), or three consecutive days at or over 40 °C (104 °F).[16] The Australian Bureau of Meteorology defines a heat wave as "three days or more of maximum and minimum temperatures that are unusual for the location".[17] Until the introduction of this new Pilot Heatwave Forecast there was no national definition that described heatwave or measures of heatwave severity.[17]
Observations
A general indicator that allows comparing heat waves in different regions of the World, characterized by different climates, was published in 2015.[18] This was used to estimate heat waves occurrence at the global scale from 1901 to 2010, finding a substantial and sharp increase in the number of affected areas in the last two decades.[19]
June 2019 was the hottest month on record worldwide, the effects of this were especially prominent in Europe.[20] Increased wildfires in places such as Spain can also be attributed to heat waves.[21]
The 2021 Western North America heat wave resulted in some of the highest temperatures ever recorded in the region, including 49.6 °C (121.3 °F), the highest temperature ever measured in Canada.[22]
A study that investigated 13,115 cities found that extreme heat exposure of a wet bulb globe temperature above 30 °C tripled between 1983 and 2016. It increased by ~50% when the population growth in these cities is not taken into account. Urban areas and living spaces are often significantly warmer than surrounding rural areas, partly due to the urban heat island effect. The researchers compiled a comprehensive inventory of past urban extreme heat events.[23][24]
Causes

Heat waves form when high pressure aloft (from 10,000–25,000 feet (3,000–7,600 metres)) strengthens and remains over a region for several days up to several weeks.[25] This is common in summer (in both Northern and Southern Hemispheres) as the jet stream 'follows the sun'. On the equator side of the jet stream, in the upper layers of the atmosphere, is the high pressure area.
Summertime weather patterns are generally slower to change than in winter. As a result, this upper level high pressure also moves slowly. Under high pressure, the air subsides (sinks) toward the surface, warming and drying adiabatically, inhibiting convection and preventing the formation of clouds. Reduction of clouds increases shortwave radiation reaching the surface. A low pressure at the surface leads to surface wind from lower latitudes that brings warm air, enhancing the warming. Alternatively, the surface winds could blow from the hot continental interior towards the coastal zone, leading to heat waves there, or from a high elevation towards low elevation, enhancing the subsidence and therefore the adiabatic warming.[26] [27]
In the Eastern United States a heat wave can occur when a high pressure system originating in the Gulf of Mexico becomes stationary just off the Atlantic Seaboard (typically known as a Bermuda High). Hot humid air masses form over the Gulf of Mexico and the Caribbean Sea while hot dry air masses form over the desert Southwest and northern Mexico. The SW winds on the back side of the High continue to pump hot, humid Gulf air northeastward resulting in a spell of hot and humid weather for much of the Eastern States.[28]
In the Western Cape Province of South Africa, a heat wave can occur when a low pressure offshore and high pressure inland air combine to form a Bergwind. The air warms as it descends from the Karoo interior, and the temperature will rise about 10 °C from the interior to the coast. Humidities are usually very low, and the temperatures can be over 40 °C in summer. The highest official temperatures recorded in South Africa (51.5 °C) was recorded one summer during a bergwind occurring along the Eastern Cape coastline.[29][30]
The role of soil moisture can also contribute to the intensification of heat waves in Europe.[31][32] Low soil moisture leads to a number of complex feedback mechanisms, which can in turn result in increased surface temperatures. One of the main mechanisms is reduced evaporative cooling of the atmosphere.[31] When water evaporates, it consumes energy and thus will lower the surrounding temperature. If the soil is very dry, then incoming radiation from the sun will warm the air with little or no cooling effect from moisture evaporating from the soil.
Climate change
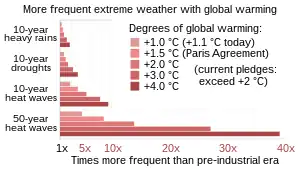

Heatwaves over land have become more frequent and more intense in almost all world regions since the 1950s, due to climate change. Furthermore, heat waves are more likely to occur simultaneously with droughts. And marine heatwaves are twice as likely as they were in 1980.[35] Climate change will lead to more very hot days and fewer very cold days.[36]: 7 There are fewer cold waves.[33]: 8
The intensity of individual heat waves can often be attributed to global warming. Some extreme events would have been nearly impossible without human influence on the climate system. A heatwave that would occur once every ten years before global warming started, now occurs 2.8 times as often. Under further warming, heatwaves are set to become more frequent. An event that would occur each ten year, would occur every other year if global warming reaches 2 °C (3.6 °F).[37]
Heat stress is not only related to temperature, but also increases if humidity is higher. The wet-bulb temperature measures both temperature and humidity. Above a wet-bulb temperature of 35 °C (95 °F), this heat stress is beyond human adaptation, and can kill people. If global warming is kept below 1.5 or 2 °C (2.7 or 3.6 °F), this deadly heat and humidity can likely be avoided in most of the tropics, but there may still be negative health impacts.[38][39]
There is some evidence climate change leads to a weakening of the polar vortex, which would make the jet stream more wavy.[40] This would lead to outbursts of very cold winter weather across parts of Eurasia[41] and North America, as well as very warm air incursions into the Arctic.[42][43][44]Impacts on human health
Heat-related health impacts for vulnerable people

Heat illness is a spectrum of disorders due to increased body temperature. It can be caused by either environmental conditions or by exertion. It includes minor conditions such as heat cramps, heat syncope, and heat exhaustion as well as the more severe condition known as heat stroke.[45] It can affect any or all anatomical systems.[46] Heat illnesses include:[47][48] Heat stroke, heat exhaustion, heat syncope, heat edema, heat cramps, heat rash, heat tetany.
Prevention includes avoiding medications that can increase the risk of heat illness, gradual adjustment to heat, and sufficient fluids and electrolytes.[49][50]Vulnerable people with regard to heat illnesses include people with low incomes, minority groups, women (in particular pregnant women), children, older adults (over 65 years old), people with chronic diseases, disabilities and co-morbidities.[51]: 13 Further people at risk include those in urban environments (due to the urban heat island effect), outdoor workers and people who take certain prescription drugs.[51] Exposure to extreme heat poses an acute health hazard for many of the people deemed as vulnerable.[51][52]
Climate change increases the frequency and severity of heatwaves and thus heat stress for people. Human responses to heat stress can include heat stroke and hyperthermia. Extreme heat is also linked to low quality sleep, acute kidney injury and complications with pregnancy. Furthermore, it may cause the deterioration of pre-existing cardiovascular and respiratory disease.[53]: 1624 Adverse pregnancy outcomes due to high ambient temperatures include for example low birth weight and pre-term birth.[53]: 1051 Heat waves have also resulted in epidemics of chronic kidney disease (CKD).[54][55] Prolonged heat exposure, physical exertion, and dehydration are sufficient factors for the development of CKD.[54][55]
The human body requires evaporative cooling to prevent overheating, even with a low activity level. With excessive ambient heat and humidity during heatwaves, adequate evaporative cooling might be compromised.
A wet-bulb temperature that is too high means that human bodies would no longer be able to adequately cool the skin.[56][57] A wet bulb temperature of 35 °C is regarded as the limit for humans (called the "physiological threshold for human adaptability" to heat and humidity).[58]: 1498 As of 2020, only two weather stations had recorded 35 °C wet-bulb temperatures, and only very briefly, but the frequency and duration of these events is expected to rise with ongoing climate change.[59][60][61] Global warming above 1.5 degrees risks making parts of the tropics uninhabitable because the threshold for the wet bulb temperature may be passed.[56]
People with cognitive health issues (e.g. depression, dementia, Parkinson's disease) are more at risk when faced with high temperatures and ought to be extra careful.[62] as cognitive performance has been shown to be differentially affected by heat.[63] People with diabetes, are overweight, have sleep deprivation, or have cardiovascular/cerebrovascular conditions should avoid too much heat exposure.[62][64]
The risk of dying from chronic lung disease during a heat wave has been estimated at 1.8-8.2% higher compared to average summer temperatures.[65] An 8% increase in hospitalization rate for people with COPD has been estimated for every 1 °C increase in temperatures above 29 °C.[52]
Mortality
Health experts warn that "exposure to extreme heat increases the risk of death from cardiovascular, cerebrovascular, and respiratory conditions and all-cause mortality. Heat-related deaths in people older than 65 years reached a record high of an estimated 345 000 deaths in 2019".[51]: 9
More than 70,000 Europeans died as a result of the 2003 European heat wave.[66] Also more than 2,000 people died in Karachi, Pakistan in June 2015 due to a severe heat wave with temperatures as high as 49 °C (120 °F).[67][68]
Increasing access to indoor cooling (air conditioning) will help prevent heat-related mortality but current air conditioning technology is generally unsustainable as it contributes to greenhouse gas emissions, air pollution, peak electricity demand, and urban heat islands.[51]: 17
Mortality due to heat waves could be reduced if buildings were better designed to modify the internal climate, or if the occupants were better educated about the issues, so they can take action on time.[69][70] Heatwave early warning and response systems are important elements of heat action plans.Underreporting of fatalities
The number of heat fatalities is likely highly underreported due to a lack of reports and misreports.[71] When factoring in heat-related illnesses, actual death tolls linked to extreme heat may be six times as high as official figures, as suggested for California[72] and Japan.[73]
Part of the mortality observed during a heat wave can be attributed to short-term forward mortality displacement. It has been observed that for some heat waves, there is a compensatory decrease in overall mortality during the subsequent weeks after a heat wave. Such compensatory reductions in mortality suggest that heat affects especially those so ill that they "would have died in the short term anyway".[74]
Another explanation for underreporting is the social attenuation in most contexts of heat waves as a health risk. As shown by the deadly French heat wave in 2003, heat wave dangers result from the intricate association of natural and social factors.[75] Social invisibility is one such factor. In places where heat-related deaths often occur indoors, among elderly people living alone, it can be challenging to assign heat as a contributing factor.[76]
Heat index for temperature and relative humidity
Temperature Relative humidity |
80 °F (27 °C) | 82 °F (28 °C) | 84 °F (29 °C) | 86 °F (30 °C) | 88 °F (31 °C) | 90 °F (32 °C) | 92 °F (33 °C) | 94 °F (34 °C) | 96 °F (36 °C) | 98 °F (37 °C) | 100 °F (38 °C) | 102 °F (39 °C) | 104 °F (40 °C) | 106 °F (41 °C) | 108 °F (42 °C) | 110 °F (43 °C) |
|---|---|---|---|---|---|---|---|---|---|---|---|---|---|---|---|---|
| 40% | 80 °F (27 °C) | 81 °F (27 °C) | 83 °F (28 °C) | 85 °F (29 °C) | 88 °F (31 °C) | 91 °F (33 °C) | 94 °F (34 °C) | 97 °F (36 °C) | 101 °F (38 °C) | 105 °F (41 °C) | 109 °F (43 °C) | 114 °F (46 °C) | 119 °F (48 °C) | 124 °F (51 °C) | 130 °F (54 °C) | 136 °F (58 °C) |
| 45% | 80 °F (27 °C) | 82 °F (28 °C) | 84 °F (29 °C) | 87 °F (31 °C) | 89 °F (32 °C) | 93 °F (34 °C) | 96 °F (36 °C) | 100 °F (38 °C) | 104 °F (40 °C) | 109 °F (43 °C) | 114 °F (46 °C) | 119 °F (48 °C) | 124 °F (51 °C) | 130 °F (54 °C) | 137 °F (58 °C) | |
| 50% | 81 °F (27 °C) | 83 °F (28 °C) | 85 °F (29 °C) | 88 °F (31 °C) | 91 °F (33 °C) | 95 °F (35 °C) | 99 °F (37 °C) | 103 °F (39 °C) | 108 °F (42 °C) | 113 °F (45 °C) | 118 °F (48 °C) | 124 °F (51 °C) | 131 °F (55 °C) | 137 °F (58 °C) | ||
| 55% | 81 °F (27 °C) | 84 °F (29 °C) | 86 °F (30 °C) | 89 °F (32 °C) | 93 °F (34 °C) | 97 °F (36 °C) | 101 °F (38 °C) | 106 °F (41 °C) | 112 °F (44 °C) | 117 °F (47 °C) | 124 °F (51 °C) | 130 °F (54 °C) | 137 °F (58 °C) | |||
| 60% | 82 °F (28 °C) | 84 °F (29 °C) | 88 °F (31 °C) | 91 °F (33 °C) | 95 °F (35 °C) | 100 °F (38 °C) | 105 °F (41 °C) | 110 °F (43 °C) | 116 °F (47 °C) | 123 °F (51 °C) | 129 °F (54 °C) | 137 °F (58 °C) | ||||
| 65% | 82 °F (28 °C) | 85 °F (29 °C) | 89 °F (32 °C) | 93 °F (34 °C) | 98 °F (37 °C) | 103 °F (39 °C) | 108 °F (42 °C) | 114 °F (46 °C) | 121 °F (49 °C) | 128 °F (53 °C) | 136 °F (58 °C) | |||||
| 70% | 83 °F (28 °C) | 86 °F (30 °C) | 90 °F (32 °C) | 95 °F (35 °C) | 100 °F (38 °C) | 105 °F (41 °C) | 112 °F (44 °C) | 119 °F (48 °C) | 126 °F (52 °C) | 134 °F (57 °C) | ||||||
| 75% | 84 °F (29 °C) | 88 °F (31 °C) | 92 °F (33 °C) | 97 °F (36 °C) | 103 °F (39 °C) | 109 °F (43 °C) | 116 °F (47 °C) | 124 °F (51 °C) | 132 °F (56 °C) | |||||||
| 80% | 84 °F (29 °C) | 89 °F (32 °C) | 94 °F (34 °C) | 100 °F (38 °C) | 106 °F (41 °C) | 113 °F (45 °C) | 121 °F (49 °C) | 129 °F (54 °C) | ||||||||
| 85% | 85 °F (29 °C) | 90 °F (32 °C) | 96 °F (36 °C) | 102 °F (39 °C) | 110 °F (43 °C) | 117 °F (47 °C) | 126 °F (52 °C) | 135 °F (57 °C) | ||||||||
| 90% | 86 °F (30 °C) | 91 °F (33 °C) | 98 °F (37 °C) | 105 °F (41 °C) | 113 °F (45 °C) | 122 °F (50 °C) | 131 °F (55 °C) | |||||||||
| 95% | 86 °F (30 °C) | 93 °F (34 °C) | 100 °F (38 °C) | 108 °F (42 °C) | 117 °F (47 °C) | 127 °F (53 °C) | ||||||||||
| 100% | 87 °F (31 °C) | 95 °F (35 °C) | 103 °F (39 °C) | 112 °F (44 °C) | 121 °F (49 °C) | 132 °F (56 °C) |
The heat index (as shown in the table above) is a measure of how hot it feels when relative humidity is factored with the actual air temperature.
Psychological and sociological effects
In addition to physical stress, excessive heat causes psychological stress, to a degree which affects performance, and is also associated with an increase in violent crime.[77] High temperatures are associated with increased conflict both at the interpersonal level and at the societal level. In every society, crime rates go up when temperatures go up, particularly violent crimes such as assault, murder, and rape. Furthermore, in politically unstable countries, high temperatures are an aggravating factor that lead toward civil wars.[78]
Additionally, high temperatures have a significant effect on income. A study of counties in the United States found that economic productivity of individual days declines by about 1.7% for each degree Celsius above 15 °C (59 °F).[79]
Surface ozone (air pollution)
Ozone pollution in urban areas is especially concerning with increasing temperatures, raising heat-related mortality during heat waves.[80] During heat waves in urban areas, ground level ozone pollution can be 20% higher than usual.[81]
One study concluded that from 1860 to 2000, the global population-weighted fine particle concentrations increased by 5% and near-surface ozone concentrations by 2% due to climate change.[82]
An investigation to assess the joint mortality effects of ozone and heat during the European heat waves in 2003, concluded that these appear to be additive.[83]
| Part of a series on |
| Weather |
|---|
 |
|
|
Other impacts
Reduced GDP
Calculations from 2022 suggest heatwaves will cause ~1% decrease of GDP to economies by mid 21st century.[84][85][86]
Heatwaves often have complex effects on human economies, due to less productivity of workers, disruption of agricultural and industrial processes and damage to infrastructure not adapted for extreme heat.[4][5]
Reduced agricultural yields
Heat waves significantly threaten agricultural production. In 2019, heat waves in the Mulanje region of Malawi involved temperatures as high as 40 °C (104 °F). This and a late rain season resulted in significant tea leaf scorching and reduced yields.[87]
Wildfires
If a heat wave occurs during a drought, which dries out vegetation, it can contribute to bushfires and wildfires. During the disastrous heat wave that struck Europe in 2003, fires raged through Portugal, destroying over 3,010 square kilometres (1,160 sq mi) or 301,000 hectares (740,000 acres) of forest and 440 square kilometres (170 sq mi) or 44,000 hectares (110,000 acres) of agricultural land and causing an estimated €1 billion worth of damage.[88] High end farmlands have irrigation systems to back up crops with. Heat waves cause wildfires.
Floods
Heat waves can also contribute to severe flooding. The record-breaking heat wave that afflicted Pakistan beginning in May 2022 led to glacier melt and moisture flow, which were factors in the devastating floods that began in June and claimed over 1,100 lives.[89]
Infrastructural damage
Heat waves can and do cause roads and highways to buckle and melt,[90] water lines to burst, and power transformers to detonate, causing fires. Heat waves can also damage rail roads, such as buckling and kinking rails, which can lead to slower traffic, delays, and even cancellations of service when rails are too dangerous to traverse by trains.
Power outages
Heat waves often lead to electricity spikes due to increased air conditioning use, which can create power outages, exacerbating the problem. During the 2006 North American heat wave, thousands of homes and businesses went without power, especially in California. In Los Angeles, electrical transformers failed, leaving thousands without power for as long as five days.[91] The 2009 South Eastern Australia Heat Wave caused the city of Melbourne, Australia to experience some major power disruptions which left over half a million people without power as the heat wave blew transformers and overloaded a power grid.
Options for reducing impacts of heat waves on people
Reducing urban heat island effect

| External video | |
|---|---|
.JPG.webp) | |
Strategies to improve urban resilience by reducing excessive heat in cities include: Planting trees in cities, white roofs and light-coloured concrete, green infrastructure (including green roofs), passive daytime radiative cooling.
The temperature difference between urban areas and the surrounding suburban or rural areas can be as much as 5 °C (9.0 °F). Nearly 40 percent of that increase is due to the prevalence of dark roofs, with the remainder coming from dark-colored pavement and the declining presence of vegetation. The heat island effect can be counteracted slightly by using white or reflective materials to build houses, roofs, pavements, and roads, thus increasing the overall albedo of the city.[92]Using air conditioning and other cooling systems
One public health measure taken during heat waves is the setting-up of air-conditioned public cooling centers. There are novel designs for cooling systems that are relatively low-cost, do not use electrical components, are off-grid and chemically store solar energy for on-demand use.[93][94]
Adding air conditioning in schools[95] provides a cooler work place but results in additional greenhouse gas emissions unless solar energy is used.
Examples by country
United States

In July 2019, over 50 million people in the United States were present in a jurisdiction with any type of heat advisory. Scientists predicted that in the days following the issuance of these warnings, many records for highest low temperatures will be broken: i.e. the lowest temperature in a 24-hour period will be higher than any low temperature measured before.[96]
According to estimates of a 2022 study, 107 million people in the US will experience extremely dangerous heat in the year 2053.[97]
Heat waves are the most lethal type of weather phenomenon in the United States. Between 1992 and 2001, deaths from excessive heat in the United States numbered 2,190, compared with 880 deaths from floods and 150 from hurricanes.[98] The average annual number of fatalities directly attributed to heat in the United States is about 400.[71] The 1995 Chicago heat wave, one of the worst in US history, led to approximately 739 heat-related deaths over a period of 5 days.[99] In the United States, the loss of human life in hot spells in summer exceeds that caused by all other weather events combined, including lightning, rain, floods, hurricanes, and tornadoes.[100][101]
About 6,200 Americans are hospitalized each summer (data from 2008) due to excessive heat, and those at highest risk are poor, uninsured or elderly.[102]
Research in the United States suggests that the relationship between extreme temperature and mortality varies by location. Heat is more likely to increase the risk of mortality in cities in the northern part of the country than in the southern regions of the country. For example, when Chicago, Denver, or New York City experience unusually hot summertime temperatures, elevated levels of illness and death are predicted. In contrast, parts of the country that are mild to hot year-round have a lower public health risk from excessive heat. Research shows that residents of southern cities, such as Miami, Tampa, Los Angeles, and Phoenix, tend to be acclimated to hot weather conditions and therefore less vulnerable to heat related deaths. However, as a whole, people in the United States appear to be adapting to hotter temperatures further north each decade, although this might be due to better infrastructure, more modern building design, and better public awareness.[103]
Society and culture
Policy makers, funders and researchers have created the Extreme Heat Resilience Alliance coalition under the Atlantic Council to advocate for naming heatwaves, measuring them, and ranking them to build better awareness of their impacts.[104][105]
References
- "heatwave noun - Definition". gcunoxfohoarnersdictionaries.com.
- Meehl, G. A (2004). "More Intense, More Frequent, and Longer Lasting Heat Waves in the 21st Century". Science. 305 (5686): 994–7. Bibcode:2004Sci...305..994M. doi:10.1126/science.1098704. PMID 15310900.
- Robinson, Peter J (2001). "On the Definition of a Heat Wave". Journal of Applied Meteorology. 40 (4): 762–775. Bibcode:2001JApMe..40..762R. doi:10.1175/1520-0450(2001)040<0762:OTDOAH>2.0.CO;2.
- Bottollier-Depois, Amélie. "Deadly heatwaves threaten economies too". phys.org. Retrieved 15 July 2022.
- García-León, David; Casanueva, Ana; Standardi, Gabriele; Burgstall, Annkatrin; Flouris, Andreas D.; Nybo, Lars (4 October 2021). "Current and projected regional economic impacts of heatwaves in Europe". Nature Communications. 12 (1): 5807. Bibcode:2021NatCo..12.5807G. doi:10.1038/s41467-021-26050-z. ISSN 2041-1723. PMC 8490455. PMID 34608159.
- "Summary for Policymakers" (PDF). Climate Change 2021: The Physical Science Basis. Intergovernmental Panel on Climate Change. 2021. pp. 8–10. Archived (PDF) from the original on 4 November 2021.
- IPCC, 2022: Annex II: Glossary [Möller, V., R. van Diemen, J.B.R. Matthews, C. Méndez, S. Semenov, J.S. Fuglestvedt, A. Reisinger (eds.)]. In: Climate Change 2022: Impacts, Adaptation and Vulnerability. Contribution of Working Group II to the Sixth Assessment Report of the Intergovernmental Panel on Climate Change [H.-O. Pörtner, D.C. Roberts, M. Tignor, E.S. Poloczanska, K. Mintenbeck, A. Alegría, M. Craig, S. Langsdorf, S. Löschke, V. Möller, A. Okem, B. Rama (eds.)]. Cambridge University Press, Cambridge, UK and New York, NY, USA, pp. 2897–2930, doi:10.1017/9781009325844.029.
- Frich, A.; L.V. Alexander; P. Della-Marta; B. Gleason; M. Haylock; A.M.G. Klein Tank; T. Peterson (January 2002). "Observed coherent changes in climatic extremes during the second half of the twentieth century" (PDF). Climate Research. 19: 193–212. Bibcode:2002ClRes..19..193F. doi:10.3354/cr019193.
- "Heat wave | meteorology". Encyclopedia Britannica. Retrieved 1 April 2019.
- Glickman, Todd S. (June 2000). Glossary of Meteorology. Boston: American Meteorological Society. ISBN 978-1-878220-49-3.
- "Danmark får varme- og hedebølge" (in Danish). Danish Meteorological Institute. 22 July 2008. Archived from the original on 23 July 2008. Retrieved 18 July 2013.
- "Värmebölja | Klimat | Kunskapsbanken | SMHI" (in Swedish). Smhi.se. Retrieved 17 July 2013.
- "Heat-health watch". Met Office. 31 August 2011. Retrieved 17 July 2013.
- "Glossary". NOAA's National Weather Service. 25 June 2009. Retrieved 17 July 2013.
- Singer, Stephen. "Half the country wilts under unrelenting heat". Yahoo! News. Archived from the original on 16 July 2012.
- "Extreme Heat Services for South Australia". Bureau of Meteorology. 15 January 2010. Retrieved 17 July 2013.
- "Australia Weather and Warnings". Bureau of Meteorology. Archived from the original on 16 October 2015. Retrieved 17 January 2016.
- Russo, Simone; Sillmann, Jana; Fischer, Erich M (2015). "Top ten European heatwaves since 1950 and their occurrence in the coming decades" (PDF). Environmental Research Letters. 10 (12): 124003. Bibcode:2015ERL....10l4003R. doi:10.1088/1748-9326/10/12/124003.
- Zampieri, Matteo; Russo, Simone; Di Sabatino, Silvana; Michetti, Melania; Scoccimarro, Enrico; Gualdi, Silvio (2016). "Global assessment of heat wave magnitudes from 1901 to 2010 and implications for the river discharge of the Alps". Science of the Total Environment. 571: 1330–9. Bibcode:2016ScTEn.571.1330Z. doi:10.1016/j.scitotenv.2016.07.008. PMID 27418520.
- Iliana, Magra (25 July 2019). "Europe Braces for 'Hottest Day of the Year'". The New York Times. New York Times. Retrieved 25 July 2019.
- Duncan, Conrad (3 July 2019). "June was hottest ever recorded on Earth, European satellite agency announces". The Independent. Archived from the original on 9 May 2022. Retrieved 4 July 2019.
- Berardelli, Jeff (29 June 2021). "Pacific Northwest bakes under once-in-a-millennium heat dome". www.cbsnews.com. Retrieved 30 June 2021.
- Henson, Bob. "Exposure to extreme urban heat has tripled worldwide since the 1980s, study finds". Washington Post. Retrieved 15 November 2021.
- Tuholske, Cascade; Caylor, Kelly; Funk, Chris; Verdin, Andrew; Sweeney, Stuart; Grace, Kathryn; Peterson, Pete; Evans, Tom (12 October 2021). "Global urban population exposure to extreme heat". Proceedings of the National Academy of Sciences. 118 (41): e2024792118. Bibcode:2021PNAS..11824792T. doi:10.1073/pnas.2024792118. ISSN 0027-8424. PMC 8521713. PMID 34607944.
- US Department of Commerce, NOAA. "NWS JetStream - Heat Index". www.weather.gov. Retrieved 9 February 2019.
- Lau, N; Nath, Mary Jo (2012). "A Model Study of Heat Waves over North America: Meteorological Aspects and Projections for the Twenty-First Century". Journal of Climate. 25 (14): 4761–4784. Bibcode:2012JCli...25.4761L. doi:10.1175/JCLI-D-11-00575.1.
- "Heat Index". US National Weather Service.
- "Heat Index". Pasquotank County, NC, U. S. Website. Archived from the original on 18 March 2012.
- "Bergwind Info". 1stweather.com. Archived from the original on 15 April 2012.
- "Natural Hazards - Heat Wave". City of Cape Town, South Africa Website. Archived from the original on 8 June 2012.
- Miralles, D. G.; van den Berg, M. J.; Teuling, A. J.; de Jeu, R. A. M. (November 2012). "Soil moisture-temperature coupling: A multiscale observational analysis". Geophysical Research Letters. 39 (21): n/a. Bibcode:2012GeoRL..3921707M. doi:10.1029/2012gl053703. ISSN 0094-8276. S2CID 53668167.
- Seneviratne, Sonia I.; Corti, Thierry; Davin, Edouard L.; Hirschi, Martin; Jaeger, Eric B.; Lehner, Irene; Orlowsky, Boris; Teuling, Adriaan J. (1 May 2010). "Investigating soil moisture–climate interactions in a changing climate: A review". Earth-Science Reviews. 99 (3): 125–161. Bibcode:2010ESRv...99..125S. doi:10.1016/j.earscirev.2010.02.004. ISSN 0012-8252.
- IPCC, 2021: Summary for Policymakers. In: Climate Change 2021: The Physical Science Basis. Contribution of Working Group I to the Sixth Assessment Report of the Intergovernmental Panel on Climate Change [Masson-Delmotte, V., P. Zhai, A. Pirani, S.L. Connors, C. Péan, S. Berger, N. Caud, Y. Chen, L. Goldfarb, M.I. Gomis, M. Huang, K. Leitzell, E. Lonnoy, J.B.R. Matthews, T.K. Maycock, T. Waterfield, O. Yelekçi, R. Yu, and B. Zhou (eds.)]. Cambridge University Press, Cambridge, United Kingdom and New York, NY, USA, pp. 3−32, doi:10.1017/9781009157896.001
- Rousi, Efi; Kornhuber, Kai; Beobide-Arsuaga, Goratz; Luo, Fei; Coumou, Dim (4 July 2022). "Accelerated western European heatwave trends linked to more-persistent double jets over Eurasia". Nature Communications. 13 (1): 3851. Bibcode:2022NatCo..13.3851R. doi:10.1038/s41467-022-31432-y. PMC 9253148. PMID 35788585.
- News report: Fountain, Henry (18 July 2022). "Why Europe Is Becoming a Heat Wave Hot Spot". The New York Times. Retrieved 21 August 2022.
- "Summary for Policymakers" (PDF). Climate Change 2021: The Physical Science Basis. Intergovernmental Panel on Climate Change. 2021. pp. 8–10. Archived (PDF) from the original on 4 November 2021.
- IPCC, 2013: Summary for Policymakers. In: Climate Change 2013: The Physical Science Basis. Contribution of Working Group I to the Fifth Assessment Report of the Intergovernmental Panel on Climate Change [Stocker, T.F., D. Qin, G.-K. Plattner, M. Tignor, S.K. Allen, J. Boschung, A. Nauels, Y. Xia, V. Bex and P.M. Midgley (eds.)]. Cambridge University Press, Cambridge, United Kingdom and New York, NY, USA.
- Clarke, Ben; Otto, Friederike; Stuart-Smith, Rupert; Harrington, Luke (28 June 2022). "Extreme weather impacts of climate change: an attribution perspective". Environmental Research: Climate. 1 (1): 012001. doi:10.1088/2752-5295/ac6e7d. ISSN 2752-5295. S2CID 250134589.
- Zhang, Yi; Held, Isaac; Fueglistaler, Stephan (8 March 2021). "Projections of tropical heat stress constrained by atmospheric dynamics". Nature Geoscience. 14 (3): 133–137. Bibcode:2021NatGe..14..133Z. doi:10.1038/s41561-021-00695-3. S2CID 232146008.
- Milman, Oliver (8 March 2021). "Global heating pushes tropical regions towards limits of human livability". The Guardian. Retrieved 22 July 2022.
- NOAA (16 February 2022). "Understanding the Arctic polar vortex". www.climate.gov. Retrieved 19 February 2022.
- "How global warming can cause Europe's harsh winter weather". Deutsche Welle. 11 February 2021. Retrieved 15 December 2021.
- "Climate change: Arctic warming linked to colder winters". BBC News. 2 September 2021. Archived from the original on 20 October 2021. Retrieved 20 October 2021.
- Cohen, Judah; Agel, Laurie; Barlow, Mathew; Garfinkel, Chaim I.; White, Ian (3 September 2021). "Linking Arctic variability and change with extreme winter weather in the United States". Science. 373 (6559): 1116–1121. Bibcode:2021Sci...373.1116C. doi:10.1126/science.abi9167. PMID 34516838. S2CID 237402139.
- Douglas, Erin (14 December 2021). "Winters get warmer with climate change. So what explains Texas' cold snap in February?". The Texas Tribune. Retrieved 15 December 2021.
- Lugo-Amador, Nannette M; Rothenhaus, Todd; Moyer, Peter (2004). "Heat-related illness". Emergency Medicine Clinics of North America. 22 (2): 315–27, viii. doi:10.1016/j.emc.2004.01.004. PMID 15163570.
- Morca, Camilo; Counsell, Bielecki, Louis (November 2017), "Twenty-Seven Ways a Heat Wave Can Kill You: Deadly Heat in the Era of Climate Change", Cardiovascular Quality and Outcomes, 10 (11), doi:10.1161/CIRCOUTCOMES.117.004233, PMID 29122837
{{citation}}: CS1 maint: multiple names: authors list (link) - Tintinalli, Judith (2004). Emergency Medicine: A Comprehensive Study Guide (6th ed.). McGraw-Hill Professional. p. 1186. ISBN 0-07-138875-3.
- "Heat Illness: MedlinePlus". Nlm.nih.gov. Archived from the original on 4 July 2014. Retrieved 10 July 2014.
- Lipman, GS; Eifling, KP; Ellis, MA; Gaudio, FG; Otten, EM; Grissom, CK; Wilderness Medical Society (December 2013). "Wilderness Medical Society practice guidelines for the prevention and treatment of heat-related illness". Wilderness & Environmental Medicine. 24 (4): 351–61. doi:10.1016/j.wem.2013.07.004. PMID 24140191.
- Jacklitsch, Brenda L. (29 June 2011). "Summer Heat Can Be Deadly for Outdoor Workers". NIOSH: Workplace Safety and Health. Medscape and NIOSH. Archived from the original on 4 December 2012.
- Romanello, Marina; McGushin, Alice; Di Napoli, Claudia; Drummond, Paul; Hughes, Nick; Jamart, Louis; Kennard, Harry; Lampard, Pete; Solano Rodriguez, Baltazar; Arnell, Nigel; Ayeb-Karlsson, Sonja; Belesova, Kristine; Cai, Wenjia; Campbell-Lendrum, Diarmid; Capstick, Stuart; Chambers, Jonathan; Chu, Lingzhi; Ciampi, Luisa; Dalin, Carole; Dasandi, Niheer; Dasgupta, Shouro; Davies, Michael; Dominguez-Salas, Paula; Dubrow, Robert; Ebi, Kristie L; Eckelman, Matthew; Ekins, Paul; Escobar, Luis E; Georgeson, Lucien; Grace, Delia; Graham, Hilary; Gunther, Samuel H; Hartinger, Stella; He, Kehan; Heaviside, Clare; Hess, Jeremy; Hsu, Shih-Che; Jankin, Slava; Jimenez, Marcia P; Kelman, Ilan; et al. (October 2021). "The 2021 report of the Lancet Countdown on health and climate change: code red for a healthy future" (PDF). The Lancet. 398 (10311): 1619–1662. doi:10.1016/S0140-6736(21)01787-6. hdl:10278/3746207. PMID 34687662. S2CID 239046862.
- Demain, Jeffrey G. (24 March 2018). "Climate Change and the Impact on Respiratory and Allergic Disease: 2018". Current Allergy and Asthma Reports. 18 (4): 22. doi:10.1007/s11882-018-0777-7. PMID 29574605. S2CID 4440737.
- Marina Romanello, Claudia Di Napoli, Paul Drummond, Carole Green, Harry Kennard, Pete Lampard, Daniel Scamman, Nigel Arnell, Sonja Ayeb-Karlsson, Lea Berrang Ford, Kristine Belesova, Kathryn Bowen, Wenjia Cai, Max Callaghan, Diarmid Campbell-Lendrum, Jonathan Chambers, Kim R van Daalen, Carole Dalin, Niheer Dasandi, Shouro Dasgupta, Michael Davies, Paula Dominguez-Salas, Robert Dubrow, Kristie L Ebi, Matthew Eckelman, Paul Ekins, Luis E Escobar, Lucien Georgeson, Hilary Graham, Samuel H Gunther, Ian Hamilton, Yun Hang, Risto Hänninen, Stella Hartinger, Kehan He, Jeremy J Hess, Shih-Che Hsu, Slava Jankin, Louis Jamart et al. (2022) The 2022 report of the Lancet Countdown on health and climate change: health at the mercy of fossil fuels, The Lancet, Vol 400 November 5, DOI: 10.1016/ S0140-6736(22)01540-9
- Glaser; et al. (2016). "Climate Change and the Emergent Epidemic of CKD from Heat Stress in Rural Communities: the Case for Heat Stress Nephropathy". Clin J Am Soc Nephrol. 11 (8): 1472–83. doi:10.2215/CJN.13841215. PMC 4974898. PMID 27151892.
- Shih, Gerry (6 January 2023). "The world's torrid future is etched in the crippled kidneys of Nepali workers". Washington Post. Retrieved 20 January 2023.
- "Global heating pushes tropical regions towards limits of human livability". The Guardian. 8 March 2021. Retrieved 24 June 2021.
- Chow, Denise (7 May 2022). "Deadly 'wet-bulb temperatures' are being stoked by climate change and heat waves". NBC News. Retrieved 22 July 2022.
- Shaw, R., Y. Luo, T.S. Cheong, S. Abdul Halim, S. Chaturvedi, M. Hashizume, G.E. Insarov, Y. Ishikawa, M. Jafari, A. Kitoh, J. Pulhin, C. Singh, K. Vasant, and Z. Zhang, 2022: Asia. In: Climate Change 2022: Impacts, Adaptation and Vulnerability. Contribution of Working Group II to the Sixth Assessment Report of the Intergovernmental Panel on Climate Change [H.-O. Pörtner, D.C. Roberts, M. Tignor, E.S. Poloczanska, K. Mintenbeck, A. Alegría, M. Craig, S. Langsdorf, S. Löschke, V. Möller, A. Okem, B. Rama (eds.)]. Cambridge University Press, Cambridge, UK and New York, NY, USA, pp. 1457–1579, doi:10.1017/9781009325844.012.
- Sherwood, S.C.; Huber, M. (25 May 2010). "An adaptability limit to climate change due to heat stress". Proc. Natl. Acad. Sci. U.S.A. 107 (21): 9552–5. Bibcode:2010PNAS..107.9552S. doi:10.1073/pnas.0913352107. PMC 2906879. PMID 20439769.
- Madge, Grahame (9 November 2021). "One billion face heat-stress risk from 2°C rise". Met Office. Retrieved 10 November 2021.
- Colin Raymond; Tom Matthews; Radley M. Horton (2020). "The emergence of heat and humidity too severe for human tolerance". Science Advances. 6 (19): eaaw1838. Bibcode:2020SciA....6.1838R. doi:10.1126/sciadv.aaw1838. PMC 7209987. PMID 32494693.
- Kovats, R. Sari; Hajat, Shakoor (April 2008). "Heat Stress and Public Health: A Critical Review". Annual Review of Public Health. 29 (1): 41–55. doi:10.1146/annurev.publhealth.29.020907.090843. PMID 18031221.
- Hancock, P. A.; Vasmatzidis, I. (January 2003). "Research Article". International Journal of Hyperthermia. 19 (3): 355–372. CiteSeerX 10.1.1.464.7830. doi:10.1080/0265673021000054630. PMID 12745975. S2CID 13960829.
- Koppe, Christina; Sari Kovats; Gerd Jendritzky; Bettina Menne (2004). "Heat-waves: risks and responses". Health and Global Environmental Change Series. 2.
- Witt, Christian; Schubert, André Jean; Jehn, Melissa; Holzgreve, Alfred; Liebers, Uta; Endlicher, Wilfried; Scherer, Dieter (21 December 2015). "The Effects of Climate Change on Patients With Chronic Lung Disease. A Systematic Literature Review". Deutsches Ärzteblatt International. 112 (51–52): 878–883. doi:10.3238/arztebl.2015.0878. ISSN 1866-0452. PMC 4736555. PMID 26900154.
- Robine, Jean-Marie; Cheung, Siu Lan K; Le Roy, Sophie; Van Oyen, Herman; Griffiths, Clare; Michel, Jean-Pierre; Herrmann, François Richard (2008). "Death toll exceeded 70,000 in Europe during the summer of 2003". Comptes Rendus Biologies. 331 (2): 171–8. doi:10.1016/j.crvi.2007.12.001. PMID 18241810.
- Haider, Kamran; Anis, Khurrum (24 June 2015). "Heat Wave Death Toll Rises to 2,000 in Pakistan's Financial Hub". Bloomberg News. Retrieved 3 August 2015.
- Mansoor, Hasan (30 June 2015). "Heatstroke leaves another 26 dead in Sindh". Dawn. Retrieved 9 August 2015.
- Coley, D.; Kershaw, T. J.; Eames, M. (2012). "A comparison of structural and behavioural adaptations to future proofing buildings against higher temperatures" (PDF). Building and Environment. 55: 159–166. doi:10.1016/j.buildenv.2011.12.011. hdl:10871/13936. S2CID 55303235.
- Coley, D.; Kershaw, T. J. (2010). "Changes in internal temperatures within the built environment as a response to a changing climate" (PDF). Building and Environment. 45 (1): 89–93. doi:10.1016/j.buildenv.2009.05.009.
- Basu, Rupa; Jonathan M. Samet (2002). "Relation between Elevated Ambient Temperature and Mortality: A Review of the Epidemiologic Evidence". Epidemiologic Reviews. 24 (2): 190–202. doi:10.1093/epirev/mxf007. PMID 12762092.
- "Heat waves are far deadlier than we think. How California neglects this climate threat". Los Angeles Times. Retrieved 4 September 2022.
- Fujibe, Fumiaki; Matsumoto, Jun (2021). "Estimation of Excess Deaths during Hot Summers in Japan". Sola. 17: 220–223. Bibcode:2021SOLA...17..220F. doi:10.2151/sola.2021-038. S2CID 241577645.
- Huynen, Maud M. T. E; Martens, Pim; Schram, Dieneke; Weijenberg, Matty P; Kunst, Anton E (2001). "The Impact of Heat Waves and Cold Spells on Mortality Rates in the Dutch Population". Environmental Health Perspectives. 109 (5): 463–70. doi:10.2307/3454704. JSTOR 3454704. PMC 1240305. PMID 11401757.
- Poumadère, M.; Mays, C.; Le Mer, S.; Blong, R. (2005). "The 2003 Heat Wave in France: Dangerous Climate Change Here and Now" (PDF). Risk Analysis. 25 (6): 1483–1494. CiteSeerX 10.1.1.577.825. doi:10.1111/j.1539-6924.2005.00694.x. PMID 16506977. S2CID 25784074.
- Ro, Christine (1 September 2022). "Can Japan really reach "zero deaths" from heat stroke?". BMJ. 378: o2107. doi:10.1136/bmj.o2107. ISSN 1756-1833. S2CID 251954370.
- Simister, John; Cary Cooper (October 2004). "Thermal stress in the U.S.A.: effects on violence and on employee behaviour". Stress and Health. 21 (1): 3–15. doi:10.1002/smi.1029.
- Hsiang, Solomon; Burke, Marshall; Miguel, Edward (2015). "Climate and Conflict". Annual Review of Economics. 7 (1): 577–617. doi:10.1146/annurev-economics-080614-115430. S2CID 17657019.
- Solomon, Hsiang; Tatyana, Deryugina (December 2014). "Does the Environment Still Matter? Daily Temperature and Income in the United States". NBER Working Paper No. 20750. doi:10.3386/w20750.
- Diem, Jeremy E.; Stauber, Christine E.; Rothenberg, Richard (16 May 2017). Añel, Juan A. (ed.). "Heat in the southeastern United States: Characteristics, trends, and potential health impact". PLOS ONE. 12 (5): e0177937. Bibcode:2017PLoSO..1277937D. doi:10.1371/journal.pone.0177937. ISSN 1932-6203. PMC 5433771. PMID 28520817.
- Hou, Pei; Wu, Shiliang (July 2016). "Long-term Changes in Extreme Air Pollution Meteorology and the Implications for Air Quality". Scientific Reports. 6 (1): 23792. Bibcode:2016NatSR...623792H. doi:10.1038/srep23792. ISSN 2045-2322. PMC 4815017. PMID 27029386.
- Orru, H.; Ebi, K. L.; Forsberg, B. (2017). "The Interplay of Climate Change and Air Pollution on Health". Current Environmental Health Reports. 4 (4): 504–513. doi:10.1007/s40572-017-0168-6. ISSN 2196-5412. PMC 5676805. PMID 29080073.
- Kosatsky T. (July 2005). "The 2003 European heat waves". Eurosurveillance. 10 (7): 3–4. doi:10.2807/esm.10.07.00552-en. PMID 29208081. Retrieved 14 January 2014.
- Benedek, Réfi (12 July 2022). "The cost of heatwaves". HYPEANDHYPER. Retrieved 15 July 2022.
- "Rising Heat is Making it Harder to Work in the U.S. — the Costs for the Economy Will Soar with Climate Change". Time. Retrieved 15 July 2022.
- García-León, David; Casanueva, Ana; Standardi, Gabriele; Burgstall, Annkatrin; Flouris, Andreas D.; Nybo, Lars (4 October 2021). "Current and projected regional economic impacts of heatwaves in Europe". Nature Communications. 12 (1): 5807. Bibcode:2021NatCo..12.5807G. doi:10.1038/s41467-021-26050-z. ISSN 2041-1723. PMC 8490455. PMID 34608159.
- "Malawi heatwaves threaten tea yields and livelihoods – Future Climate Africa". Retrieved 24 September 2020.
- Bell, M.; A. Giannini; E. Grover; M. Hopp; B. Lyon; A. Seth (September 2003). "Climate Impacts". IRI Climate Digest. The Earth Institute. Retrieved 28 July 2006.
- Clarke, Ben; Otto, Friederike; Harrington, Luke. "Pakistan floods: what role did climate change play?". The Conversation. Retrieved 4 September 2022.
- "When does tarmac melt?". BBC News. 15 July 2013.
- Doan, Lynn; Covarrubias, Amanda (27 July 2006). "Heat Eases, but Thousands of Southern Californians Still Lack Power". Los Angeles Times. Retrieved 16 June 2014.
- Albers, R. A. W., Bosch, P. R., Blocken, B., Van Den Dobbelsteen, A. A. J. F., Van Hove, L. W. A., Spit, T. J. M., ... & Rovers, V. (2015). Overview of challenges and achievements in the Climate Adaptation of Cities and in the Climate Proof Cities program. Building and environment, 83, 1–10.
- "Sunlight and salt water join forces in electricity-free cooling system". New Atlas. 20 September 2021. Retrieved 20 October 2021.
- Wang, Wenbin; Shi, Yusuf; Zhang, Chenlin; Li, Renyuan; Wu, Mengchun; Zhuo, Sifei; Aleid, Sara; Wang, Peng (1 September 2021). "Conversion and storage of solar energy for cooling". Energy & Environmental Science. 15: 136–145. doi:10.1039/D1EE01688A. ISSN 1754-5706. S2CID 239698764.
- Kaufman, Leslie (23 May 2011). "A City Prepares for a Warm Long-Term Forecast". The New York Times. ISSN 0362-4331. Retrieved 8 February 2023.
- Rosane, Olivia. "50 Million Americans Are Currently Living Under Some Type of Heat Warning". Ecowatch. Retrieved 19 July 2019.
- Miller, Brandon; Waldrop, Theresa (16 August 2022). "An 'extreme heat belt' will impact over 100 million Americans in the next 30 years, study finds". CNN. Retrieved 22 August 2022.
- "Hot Weather Tips and the Chicago Heat Plan". About.com. Archived from the original on 21 June 2006. Retrieved 27 July 2006.
- Near-Fatal Heat Stroke during the 1995 Heat Wave in Chicago. Annals of Internal Medicine Vol. 129 Issue 3
- Klinenberg, Eric (2002). Heat Wave: A Social Autopsy of Disaster in Chicago. Chicago, IL: Chicago University Press. ISBN 978-0-226-44321-8.
- Dead Heat: Why don't Americans sweat over heat-wave deaths? By Eric Klinenberg. Slate.com. Posted Tuesday, 30 July 2002
- Most People Struck Down by Summer Heat Are Poor Newswise, Retrieved on 9 July 2008.
- Robert E. Davis; Paul C. Knappenberger; Patrick J. Michaels & Wendy M. Novicoff (November 2003). "Changing heat-related mortality in the United States". Environmental Health Perspectives. 111 (14): 1712–1718. doi:10.1289/ehp.6336. PMC 1241712. PMID 14594620.
- "Extreme Heat Resilience Alliance: Reducing Extreme Heat Risk for Vulnerable People". wcr.ethz.ch. Archived from the original on 21 August 2020. Retrieved 2 September 2020.
- "The world's getting hotter. Can naming heat waves raise awareness of the risks?". The World from PRX. Retrieved 2 September 2020.
External links
- Current global map of extreme temperatures
- Social & Economic Costs of Temperature Extremes from NOAA Socioeconomics website initiative, National Centers for Environmental Information