Hurunui District
Hurunui District is a territorial local government district within the Canterbury Region on the east coast of New Zealand's South Island, north of Christchurch. It stretches from the east coast to the Main Divide. Its land area is 8,640.96 square kilometres (3,336.29 sq mi).
Hurunui District | |
|---|---|
 Hurunui District Offices in Amberley | |
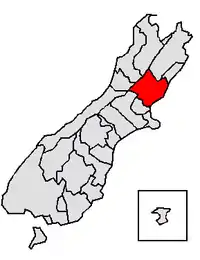 Location of the Hurunui District within the South Island | |
| Coordinates: 43°09′07″S 172°43′44″E | |
| Country | New Zealand |
| Region | Canterbury |
| Wards |
|
| Formed | 1989 |
| Seat | Amberley |
| Government | |
| • Mayor | Marie Black |
| • Deputy Mayor | Vince Daly |
| • Territorial authority | Hurunui District Council |
| Area | |
| • Total | 8,640.96 km2 (3,336.29 sq mi) |
| Population (June 2022)[2] | |
| • Total | 13,700 |
| • Density | 1.6/km2 (4.1/sq mi) |
| Time zone | UTC+12 (NZST) |
| • Summer (DST) | UTC+13 (NZDT) |
| Postcode(s) | |
| Website | www |
Local government
During the period, 1853 to 1876, the area north of the Hurunui River was administered as part of the Nelson Province. After the abolition of the provinces in 1876, the Amuri and Cheviot counties were formed. In the 1989 local government reforms, these counties were merged with Hurunui County to form the present district.[3] The current district mayor is Marie Black, who was elected in 2019 upon the retirement of the previous mayor Winton Dalley.[4]
Population
Hurunui District covers 8,640.96 km2 (3,336.29 sq mi)[1] and had an estimated population of 13,700 as of June 2022,[2] with a population density of 1.6 people per km2.
| Year | Pop. | ±% p.a. |
|---|---|---|
| 2006 | 10,476 | — |
| 2013 | 11,529 | +1.38% |
| 2018 | 12,558 | +1.72% |
| Source: [5] | ||
Hurunui District had a population of 12,558 at the 2018 New Zealand census, an increase of 1,029 people (8.9%) since the 2013 census, and an increase of 2,082 people (19.9%) since the 2006 census. There were 4,926 households. There were 6,369 males and 6,192 females, giving a sex ratio of 1.03 males per female. The median age was 44.4 years (compared with 37.4 years nationally), with 2,427 people (19.3%) aged under 15 years, 1,812 (14.4%) aged 15 to 29, 5,841 (46.5%) aged 30 to 64, and 2,478 (19.7%) aged 65 or older.
Ethnicities were 92.0% European/Pākehā, 8.6% Māori, 1.1% Pacific peoples, 3.9% Asian, and 2.1% other ethnicities. People may identify with more than one ethnicity.
The percentage of people born overseas was 16.6, compared with 27.1% nationally.
Although some people objected to giving their religion, 52.5% had no religion, 36.6% were Christian, 0.5% were Hindu, 0.2% were Muslim, 0.2% were Buddhist and 2.0% had other religions.
Of those at least 15 years old, 1,590 (15.7%) people had a bachelor or higher degree, and 2,064 (20.4%) people had no formal qualifications. The median income was $31,600, compared with $31,800 nationally. 1,440 people (14.2%) earned over $70,000 compared to 17.2% nationally. The employment status of those at least 15 was that 5,277 (52.1%) people were employed full-time, 1,788 (17.6%) were part-time, and 195 (1.9%) were unemployed.[5]
| Name | Area (km2) | Population | Density (per km2) | Households | Median age | Median income |
|---|---|---|---|---|---|---|
| Hanmer Springs Ward[lower-alpha 1] | 2,899.88 | 1,209 | 0.42 | 471 | 42.4 years | $35,500 |
| Amuri-Hurunui Ward[lower-alpha 1] | 3,557.75 | 3,690 | 1.04 | 1,428 | 38.2 years | $34,400 |
| Cheviot Ward[lower-alpha 2] | 1,041.60 | 1,371 | 1.32 | 564 | 46.3 years | $27,800 |
| Glenmark Ward[lower-alpha 2] | 644.72 | 1,194 | 1.85 | 465 | 46.0 years | $30,600 |
| Amberley Ward[lower-alpha 3] | 496.97 | 5,091 | 10.24 | 1,998 | 47.5 years | $29,700 |
| New Zealand | 37.4 years | $31,800 |
- Now part of West Ward
- Now part of East Ward
- Now called South Ward
Urban areas and settlements
Amberley, the district seat, is the only town in the Hurunui district with a population over 1,000. It is home to 2,340 people, 17.1% of the district's population.[2]
Other settlements and localities in the district include the following:
|
|
|
References
- "ArcGIS Web Application". statsnz.maps.arcgis.com. Retrieved 11 March 2022.
- "Subnational population estimates (RC, SA2), by age and sex, at 30 June 1996-2022 (2022 boundaries)". Statistics New Zealand. Retrieved 25 October 2022. (regional councils); "Subnational population estimates (TA, SA2), by age and sex, at 30 June 1996-2022 (2022 boundaries)". Statistics New Zealand. Retrieved 25 October 2022. (territorial authorities); "Subnational population estimates (urban rural), by age and sex, at 30 June 1996-2022 (2022 boundaries)". Statistics New Zealand. Retrieved 25 October 2022. (urban areas)
- "Council archives". Hurunui District Council. Retrieved 29 April 2020.
- "2019 Local Body Elections". Hurunui District Council. Retrieved 11 April 2020.
- "Statistical area 1 dataset for 2018 Census". Statistics New Zealand. March 2020. Hurunui District (058). 2018 Census place summary: Hurunui District
External links
Adjacent cities and districts | |
|---|---|