Ohio's 7th congressional district
Ohio's 7th congressional district is represented by Max Miller. It is currently located in the northeastern section of the state, including part of Cuyahoga County.
| Ohio's 7th congressional district | |||
|---|---|---|---|
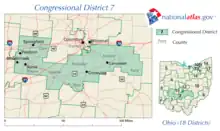
Interactive map of district boundaries since January 3, 2023 | |||
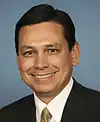
| Representative |
| ||
| Population (2021) | 792,610[1] | ||
| Median household income | $75,339[2] | ||
| Ethnicity |
| ||
| Cook PVI | R+7[3] | ||
.svg.png.webp)
Election results from statewide races
| Year | Office | Result |
|---|---|---|
| 2000 | President | George W. Bush 56% - Al Gore 42% |
| 2004 | President | George W. Bush 57% - John Kerry 43% |
| 2008 | President | John McCain 50.9% - Barack Obama 46.9% |
| 2012 | President | Mitt Romney 53.7% - Barack Obama 44.2% |
| 2016 | President | Donald Trump 62.5% - Hillary Clinton 32.8% |
| 2020 | President | Donald Trump 65% - Joe Biden 33% |
List of members representing the district


.jpg.webp)


.png.webp)


.png.webp)


.jpg.webp)


.jpg.webp)
Recent election results
The following chart shows historic election results. Bold type indicates victor. Italic type indicates incumbent.
| Year | Democratic | Republican | Other |
|---|---|---|---|
| 1920 | Paul F. Dye: 47,196 | Simeon D. Fess: 73,794 | |
| 1922 | Charles B. Zimmerman: 38,522 | Charles Brand: 53,182 | |
| 1924 | C. K. Wolf: 34,709 | Charles Brand: 61,557 | |
| 1926 | Harry E. Rice: 22,314 | Charles Brand: 45,699 | |
| 1928 | Harry E. Rice: 34,323 | Charles Brand: 75,753 | |
| 1930 | John L. Zimmerman Jr.: 35,663 | Charles Brand: 50,595 | |
| 1932 | Aaron J. Halloran: 57,715 | Leroy T. Marshall: 65,064 | |
| 1934 | C. W. Rich: 43,226 | Leroy T. Marshall: 46,453 | |
| 1936 | Arthur W. Aleshire: 68,456 | Leroy T. Marshall: 67,454 | |
| 1938 | Arthur W. Aleshire: 50,163 | Clarence J. Brown: 68,185 | |
| 1940 | J. Fuller Trump: 59,667 | Clarence J. Brown: 83,415 | |
| 1942 | George H. Smith: 23,384 | Clarence J. Brown: 52,270 | |
| 1944 | John L. Cashim: 52,403 | Clarence J. Brown: 84,770 | Carl H. Ehl: 211 |
| 1946 | Carl H. Ehl: 29,824 | Clarence J. Brown: 63,390 | |
| 1948 | Clarence J. Brown: 71,737 | ||
| 1950 | Ben J. Goldman: 35,818 | Clarence J. Brown: 77,660 | |
| 1952 | Clarence J. Brown: 98,354 | ||
| 1954 | G. Louis Wren: 35,504 | Clarence J. Brown: 62,821 | |
| 1956 | Joseph A. Sullivan: 47,220 | Clarence J. Brown: 91,439 | |
| 1958 | Joseph A. Sullivan: 48,994 | Clarence J. Brown: 75,085 | |
| 1960 | Joseph A. Sullivan: 55,451 | Clarence J. Brown: 105,026 | |
| 1962 | Robert A. Riley: 39,908 | Clarence J. Brown: 83,680 | |
| 1964 | Jerry R. Graham: 70,857 | Bud Brown*: 93,022 | |
| 1966 | Bud Brown: 81,225 | ||
| 1968 | Robert E. Cecile: 55,386 | Bud Brown: 97,581 | |
| 1970 | Joseph D. Lewis: 37,294 | Bud Brown: 84,448 | |
| 1972 | Bud Brown: 112,350 | Dorothy Franke: 40,945 | |
| 1974 | Patrick L. Nelson: 34,828 | Bud Brown: 73,503 | Dorothy Franke: 13,088 |
| 1976 | Dorothy Franke: 54,755 | Bud Brown: 101,027 | |
| 1978 | Bud Brown: 92,507 | ||
| 1980 | Donald Hollister: 38,952 | Bud Brown: 124,137 | |
| 1982 | Roger D. Tackett: 65,543 | Mike DeWine: 87,842 | John B. Winer (L): 2,761 |
| 1984 | Donald E. Scott: 40,621 | Mike DeWine: 147,885 | Others: 4,352 |
| 1986 | Mike DeWine: 119,238 | ||
| 1988 | Jack Schira: 50,423 | Mike DeWine: 142,597 | |
| 1990 | Jack Schira: 59,349 | Dave Hobson: 97,123 | |
| 1992 | Clifford S. Heskett: 66,237 | Dave Hobson: 164,195 | |
| 1994 | Dave Hobson: 140,124 | ||
| 1996 | Richard K. Blain: 61,419 | Dave Hobson: 158,087 | Dawn Marie Johnson (N): 13,478 |
| 1998 | Donald E. Minor Jr.: 49,780 | Dave Hobson: 120,765 | James A. Schrader (L): 9,146 |
| 2000 | Donald E. Minor Jr.: 60,755 | Dave Hobson: 163,646 | John Mitchel: 13,983 Jack D. Null (L): 3,802 |
| 2002 | Kara Anastasio: 45,568 | Dave Hobson: 113,252 | Frank Doden (G): 8,812 |
| 2004 | Kara Anastasio: 97,972 | Dave Hobson: 182,621 | |
| 2006 | William R. Conner: 85,202 | Dave Hobson: 133,112 | |
| 2008 | Sharen Neuhardt: 113,099 | Steve Austria: 159,265 | |
| 2010 | William R. Conner: 70,400 | Steve Austria: 135,721 | John Anderson (L): 9,381 David Easton (C): 2,811 |
| 2012[4] | Joyce Healy-Abrams: 137,708 | Bob Gibbs: 178,104 | |
| 2014[5] | Bob Gibbs: 143,959 | ||
| 2016[6] | Roy Rich: 89,638 | Bob Gibbs: 198,221 | Dan Phillip: 21,694 |
| 2018[7] | Ken Harbaugh: 107,536 | Bob Gibbs: 153,117 | |
| 2020 | Quentin Potter: 102,271 | Bob Gibbs: 236,607 | Brandon Lape (L): 11,671 |
| 2022 | Matthew Diemer: 135,485 | Max Miller: 168,002 | Others: 86 |
Historical district boundaries
2003–2013
.tif.png.webp)
2013–2023
References
- "My Congressional District".
- "My Congressional District".
- "2022 Cook PVI℠: District Map and List". Cook Political Report. Retrieved January 10, 2023.
- "2012 Election Results". Ohio Secretary of State.
- "2014 Elections Results - Ohio Secretary of State". www.sos.state.oh.us. Retrieved October 7, 2020.
- "2016 Official Elections Results - Ohio Secretary of State". www.sos.state.oh.us. Retrieved October 7, 2020.
- "2018 Official Elections Results - Ohio Secretary of State". www.sos.state.oh.us. Retrieved October 7, 2020.
- Martis, Kenneth C. (1989). The Historical Atlas of Political Parties in the United States Congress. New York: Macmillan Publishing Company.
- Martis, Kenneth C. (1982). The Historical Atlas of United States Congressional Districts. New York: Macmillan Publishing Company.
- Congressional Biographical Directory of the United States 1774–present
This article is issued from Wikipedia. The text is licensed under Creative Commons - Attribution - Sharealike. Additional terms may apply for the media files.