Lüliang
Lüliang[2] or Lyuliang (simplified Chinese: 吕梁; traditional Chinese: 呂梁; pinyin: Lǚliáng) is a prefecture-level city in the west of Shanxi province, People's Republic of China, bordering Shaanxi province across the Yellow River to the west, Jinzhong and the provincial capital of Taiyuan to the east, Linfen to the south, and Xinzhou to the north. It has a total area of 21,143 square kilometres (8,163 sq mi) and total population of 3,398,431 inhabitants according to the 2020 Chinese census, of whom 456,355 lived in the built-up (or metro) area made of Lishi District
Lüliang
吕梁市 Lvliang, Lyuliang | |
|---|---|
 | |
.png.webp) Location of Lüliang City jurisdiction in Shanxi | |
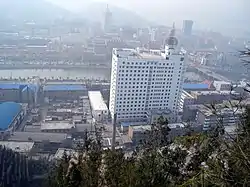
 Lüliang Location of the city centre in Shanxi | |
| Coordinates (Lüliang municipal government): 37°31′08″N 111°08′40″E | |
| Country | People's Republic of China |
| Province | Shanxi |
| County-level divisions | 1 District 2 county-level cities 10 counties |
| Municipal seat | Lishi District |
| Government | |
| • Type | Prefecture-level city |
| • CPC Lvliang Secretary | Gao Weidong (高卫东) |
| • Mayor | Ding Xuefeng (丁雪峰) |
| Area | |
| • Prefecture-level city | 21,143 km2 (8,163 sq mi) |
| • Urban | 1,323 km2 (511 sq mi) |
| • Metro | 1,323 km2 (511 sq mi) |
| Elevation | 952 m (3,123 ft) |
| Population (2020 census)[1] | |
| • Prefecture-level city | 3,398,431 |
| • Density | 160/km2 (420/sq mi) |
| • Urban | 456,355 |
| • Urban density | 340/km2 (890/sq mi) |
| • Metro | 456,355 |
| • Metro density | 340/km2 (890/sq mi) |
| Time zone | UTC+8 (China Standard) |
| Postal code | 033000 |
| Area code | 0358 |
| ISO 3166 code | CN-SX-11 |
| Licence plates | 晋J |
| Administrative division code | 141100 |
| Website | www |
History
In 2010 the city had a GDP growth rate at 21%; at the time prices for coal were high and the city had an active coal industry. There were plans to build a new business district in Lüliang, and the city's mayor had strongly pushed for the plan. In 2014 the GDP declined by 2%. By 2015 due to a slowing economy plans in that city stalled and many apartment blocks were left unoccupied. By 2015 the mayor lost his job due to corruption.[3]
In July 2021, following a Chinese government crackdown on the Abrahamic faiths in China, Christian Church Minister Zhao Weikai was arrested and charged with "illegal holding of materials promoting terrorism and extremism" by the municipal police and was forbidden from meeting with his legal council. This incident was used by various human rights groups as an example of religious persecution by the Chinese Communist Party. [4]
The Chinese-American reproductive biologist Min Chueh Chang was born in Lüliang in 1908.
Administration
Lüliang has direct jurisdiction over 1 district, 2 county-level cities, and 10 counties:
| Map | ||||||
|---|---|---|---|---|---|---|
| # | Name | Hanzi | Hanyu Pinyin | Population (2010 census)[5] | Area (km²) | Density (/km²) |
| 1 | Lishi District | 离石区 | Líshí Qū | 320,142 | 1,323 | 242 |
| 2 | Xiaoyi City | 孝义市 | Xiàoyì Shì | 468,770 | 934 | 502 |
| 3 | Fenyang City | 汾阳市 | Fényáng Shì | 416,212 | 1,173 | 355 |
| 4 | Wenshui County | 文水县 | Wénshuǐ Xiàn | 421,199 | 1,069 | 394 |
| 5 | Zhongyang County | 中阳县 | Zhōngyáng Xiàn | 141,374 | 1,435 | 98 |
| 6 | Xing County | 兴县 | Xīng Xiàn | 279,373 | 3,164 | 88 |
| 7 | Lin County | 临县 | Lín Xiàn | 579,077 | 2,979 | 194 |
| 8 | Fangshan County | 方山县 | Fāngshān Xiàn | 143,809 | 1,433 | 100 |
| 9 | Liulin County | 柳林县 | Liǔlín Xiàn | 320,676 | 1,288 | 249 |
| 10 | Lan County | 岚县 | Lán Xiàn | 174,182 | 1,509 | 115 |
| 11 | Jiaokou County | 交口县 | Jiāokǒu Xiàn | 119,918 | 1,258 | 95 |
| 12 | Jiaocheng County | 交城县 | Jiāochéng Xiàn | 230,521 | 1,821 | 126 |
| 13 | Shilou County | 石楼县 | Shílóu Xiàn | 111,815 | 1,736 | 64 |

Climate
Lüliang has a monsoon-influenced continental climate, that, under the Köppen climate classification, falls on the borderline between the semi-arid (Köppen BSk) and humid continental (Dwa) regimes, and features large diurnal temperature variation. Winters are cold and very dry, while summers are hot and slightly humid. The monthly daily average temperature ranges from −7.0 °C (19.4 °F) in January to 23.7 °C (74.7 °F) in July, while the annual mean is 9.5 °C (49.1 °F). Close to three-fourths of the annual precipitation occurs from June to September.
| Climate data for Lüliang (Lishi District, 1981−2010 normals, extremes 1971-2010) | |||||||||||||
|---|---|---|---|---|---|---|---|---|---|---|---|---|---|
| Month | Jan | Feb | Mar | Apr | May | Jun | Jul | Aug | Sep | Oct | Nov | Dec | Year |
| Record high °C (°F) | 15.0 (59.0) |
22.7 (72.9) |
29.8 (85.6) |
35.5 (95.9) |
36.7 (98.1) |
40.6 (105.1) |
39.8 (103.6) |
37.2 (99.0) |
36.2 (97.2) |
29.4 (84.9) |
24.1 (75.4) |
16.7 (62.1) |
40.6 (105.1) |
| Average high °C (°F) | 0.3 (32.5) |
4.9 (40.8) |
11.5 (52.7) |
19.6 (67.3) |
25.4 (77.7) |
29.2 (84.6) |
30.3 (86.5) |
28.2 (82.8) |
23.4 (74.1) |
17.1 (62.8) |
8.9 (48.0) |
1.8 (35.2) |
16.7 (62.1) |
| Daily mean °C (°F) | −7.0 (19.4) |
−2.3 (27.9) |
4.1 (39.4) |
11.8 (53.2) |
17.9 (64.2) |
22.0 (71.6) |
23.7 (74.7) |
21.6 (70.9) |
16.4 (61.5) |
9.7 (49.5) |
1.7 (35.1) |
−5.1 (22.8) |
9.5 (49.2) |
| Average low °C (°F) | −12.5 (9.5) |
−8.0 (17.6) |
−1.9 (28.6) |
4.7 (40.5) |
10.6 (51.1) |
15.2 (59.4) |
18.0 (64.4) |
16.3 (61.3) |
10.8 (51.4) |
4.1 (39.4) |
−3.5 (25.7) |
−10.2 (13.6) |
3.6 (38.5) |
| Record low °C (°F) | −26.0 (−14.8) |
−23.9 (−11.0) |
−16.1 (3.0) |
−9.6 (14.7) |
−3.2 (26.2) |
4.2 (39.6) |
10.2 (50.4) |
6.6 (43.9) |
−2.0 (28.4) |
−8.7 (16.3) |
−20.0 (−4.0) |
−24.9 (−12.8) |
−26.0 (−14.8) |
| Average precipitation mm (inches) | 2.6 (0.10) |
5.2 (0.20) |
13.2 (0.52) |
21.8 (0.86) |
38.2 (1.50) |
59.2 (2.33) |
93.4 (3.68) |
107.7 (4.24) |
73.5 (2.89) |
31.6 (1.24) |
13.8 (0.54) |
3.1 (0.12) |
463.3 (18.22) |
| Average precipitation days (≥ 0.1 mm) | 2.4 | 3.4 | 5.0 | 5.3 | 6.2 | 8.3 | 11.4 | 11.5 | 8.6 | 6.1 | 3.9 | 2.2 | 74.3 |
| Average relative humidity (%) | 55 | 52 | 48 | 43 | 46 | 54 | 65 | 72 | 71 | 66 | 60 | 57 | 57 |
| Source 1: China Meteorological Data Service Center[6] | |||||||||||||
| Source 2: Weather China (precipitation days 1971–2000)[7] | |||||||||||||
References
- "China: Shānxī (Prefectures, Cities, Districts and Counties) - Population Statistics, Charts and Map".
- Because of the relative difficulty in inputting the umlauted ü, the name Lvliang is often seen in government websites and road signages.
- Langfitt, Frank. "A 'Sense Of Crisis' Now In A Chinese Boomtown Gone Bust" (Archive).National Public Radio. September 16, 2015. Retrieved on September 17, 2015.
- "Two hostile Lüliang City procuratorates present obstacles to Lawyer Fang Xiangui meeting with Minister Zhao Weikai". China Aid. 31 July 2021. Retrieved 7 February 2022.
- "Lǚliáng Shì (Shānxī) (China): Cities, Districts and Counties & Townships - Population Statistics, Charts and Map". www.citypopulation.de. Retrieved 2022-07-07.
- 中国地面气候标准值月值(1981-2010) (in Simplified Chinese). China Meteorological Data Service Center. Retrieved 29 November 2022.
- 吕梁 - 气象数据 -中国天气网 (in Chinese (China)). Weather China. Retrieved 2011-12-21.
External links
Major cities along the Yellow River | ||
|---|---|---|
| Province-level subdivisions | Cities (from upper reaches to lower reaches) |  |
| Gansu | ||
| Ningxia | ||
| Inner Mongolia | ||
| Shanxi | ||
| Shaanxi | ||
| Henan | ||
| Shandong | ||
Major cities along the Pearl River · Major cities along the Yangtze River | ||