Mississauga—Lakeshore (provincial electoral district)
Mississauga—Lakeshore is a provincial electoral district in Ontario, Canada. It elects one member to the Legislative Assembly of Ontario. This riding was formerly known as Mississauga South prior to 2015.[1]
 Location in Mississauga | |||
| Provincial electoral district | |||
| Legislature | Legislative Assembly of Ontario | ||
| MPP |
Progressive Conservative | ||
| District created | 1975 | ||
| First contested | 1975 | ||
| Last contested | 2022 | ||
| Demographics | |||
| Population (2016) | 117,440 | ||
| Electors (2018) | 90,469 | ||
| Area (km²) | 88 | ||
| Pop. density (per km²) | 1,334.5 | ||
| Census division(s) | Peel Region | ||
| Census subdivision(s) | Mississauga | ||
It includes the neighbourhoods of Cawthra, Sheridan Heights, Park Royal, Clarkson, Rattray Park Estates, Lorne Park, Lorne Park Estates, Port Credit, Applewood Acres, Lakeview and Orchard Heights. It has a population of 113,003 and an area of 61 km2.
In 2003, it was defined to consist of the part of the City of Mississauga lying southeast of a line drawn from northeast to southwest along the Queensway to the Credit River, west along the Credit River, and southwest along Dundas Street West to the southwestern city limit.
.png.webp)
Members of Provincial Parliament
| Mississauga South | ||||
|---|---|---|---|---|
| Assembly | Years | Member | Party | |
| Riding created | ||||
| 30th | 1975–1977 | Douglas Kennedy | Progressive Conservative | |
| 31st | 1977–1981 | |||
| 32nd | 1981–1985 | |||
| 33rd | 1985–1987 | Margaret Marland | Progressive Conservative | |
| 34th | 1987–1990 | |||
| 35th | 1990–1995 | |||
| 36th | 1995–1999 | |||
| 37th | 1999–2003 | |||
| 38th | 2003–2007 | Tim Peterson | Liberal | |
| 2007–2007 | Independent | |||
| 2007–2007 | Progressive Conservative | |||
| 39th | 2007–2011 | Charles Sousa | Liberal | |
| 40th | 2011–2014 | |||
| 41st | 2014–2018 | |||
| Mississauga—Lakeshore | ||||
| 42nd | 2018–2022 | Rudy Cuzzetto | Progressive Conservative | |
| 43rd | 2022–present | |||
| Sourced from the Ontario Legislative Assembly[2] | ||||
Electoral history
Once one of the strongest bastions of PC support in the province (winning 61% of the vote as recently as 1999), and certainly in the Toronto area, Mississauga South provincially has become more and more Liberal in last election cycles.
Election results
| 2022 Ontario general election | ||||||||
|---|---|---|---|---|---|---|---|---|
| Party | Candidate | Votes | % | ±% | ||||
| Progressive Conservative | Rudy Cuzzetto | 19,341 | 45.09 | +2.76 | ||||
| Liberal | Elizabeth Mendes | 15,768 | 36.76 | +1.73 | ||||
| New Democratic | Julia Kole | 3,647 | 8.50 | -9.80 | ||||
| Green | David Zeni | 2,160 | 5.04 | +2.09 | ||||
| New Blue | Renata Cynarska | 1,014 | 2.36 | |||||
| Ontario Party | George Cescon | 501 | 1.17 | |||||
| None of the Above | Brian Crombie | 459 | 1.07 | +0.39 | ||||
| Total valid votes | 42,890 | |||||||
| Total rejected, unmarked and declined ballots | 262 | 0.61 | ||||||
| Turnout | 43,152 | 46.89 | ||||||
| Eligible voters | 92,026 | |||||||
| Source: Elections Ontario[3] | ||||||||
| 2018 Ontario general election | ||||||||
|---|---|---|---|---|---|---|---|---|
| Party | Candidate | Votes | % | ±% | ||||
| Progressive Conservative | Rudy Cuzzetto | 22,520 | 42.33 | +8.88 | ||||
| Liberal | Charles Sousa | 18,636 | 35.03 | -15.45 | ||||
| New Democratic | Boris Rosolak | 9,735 | 18.30 | +7.62 | ||||
| Green | Lloyd Jones | 1,572 | 2.95 | -0.24 | ||||
| None of the Above | Kenny Robinson | 363 | 0.68 | |||||
| Libertarian | Jay Ward | 223 | 0.42 | |||||
| Go Vegan | Felicia Trigiani | 150 | 0.28 | |||||
| Total valid votes | 53,199 | 99.12 | ||||||
| Total rejected, unmarked and declined ballots | 474 | 0.88 | ||||||
| Turnout | 53,673 | 59.33 | ||||||
| Eligible voters | 90,469 | |||||||
| Progressive Conservative gain from Liberal | Swing | +12.17 | ||||||
| Source: Elections Ontario[4] | ||||||||
| 2014 general election redistributed results[5] | |||
|---|---|---|---|
| Party | Vote | % | |
| Liberal | 23,269 | 50.49 | |
| Progressive Conservative | 15,420 | 33.45 | |
| New Democratic | 4,921 | 10.68 | |
| Green | 1,471 | 3.19 | |
| Others | 1,010 | 2.19 | |
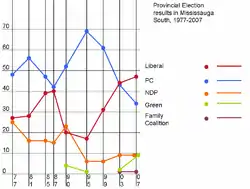
Mississauga South, 1977-2014
| 2014 Ontario general election | ||||||||
|---|---|---|---|---|---|---|---|---|
| Party | Candidate | Votes | % | ±% | ||||
| Liberal | Charles Sousa | 22,192 | 50.76 | +0.05 | ||||
| Progressive Conservative | Effie Triantafilopoulos | 14,514 | 33.20 | -2.89 | ||||
| New Democratic | Boris Rosolak | 4,649 | 10.63 | +0.57 | ||||
| Green | Lloyd Jones | 1,418 | 3.24 | +1.10 | ||||
| None of the Above | Andrew Weber | 591 | 1.35 | |||||
| Libertarian | James Judson | 355 | 0.81 | |||||
| Total valid votes | 43,719 | 100.0 | ||||||
| Liberal hold | Swing | +1.47 | ||||||
| Source: Elections Ontario[6] | ||||||||
| 2011 Ontario general election | ||||||||
|---|---|---|---|---|---|---|---|---|
| Party | Candidate | Votes | % | ±% | ||||
| Liberal | Charles Sousa | 20,375 | 50.71 | +3.92 | ||||
| Progressive Conservative | Geoff Janoscik | 14,499 | 36.09 | +1.69 | ||||
| New Democratic | Anju Sikka | 4,044 | 10.06 | +0.93 | ||||
| Green | Cory Mogk | 860 | 2.14 | -6.7 | ||||
| Freedom | Mark Harris | 236 | 0.59 | |||||
| Vegan Environmental | Paul Figueiras | 165 | 0.41 | |||||
| Total valid votes | 40,179 | 100.00 | ||||||
| Total rejected, unmarked and declined ballots | 178 | 0.44 | ||||||
| Turnout | 40,357 | 51.25 | ||||||
| Eligible voters | 78,746 | |||||||
| Liberal hold | Swing | +1.12 | ||||||
| Source: Elections Ontario[7] | ||||||||
| 2007 Ontario general election | ||||||||
|---|---|---|---|---|---|---|---|---|
| Party | Candidate | Votes | % | ±% | ||||
| Liberal | Charles Sousa | 19,195 | 46.79 | +2.99 | ||||
| Progressive Conservative | Tim Peterson | 14,114 | 34.40 | -8.8 | ||||
| New Democratic | Ken Cole | 3,745 | 9.13 | -0.05 | ||||
| Green | David Johnston | 3,627 | 8.84 | +6.43 | ||||
| Family Coalition | Samantha Toteda | 345 | 0.84 | -0.57 | ||||
| Total valid votes | 41,026 | 100.0 | ||||||
| 2007 Ontario electoral reform referendum | |||
|---|---|---|---|
| Side | Votes | % | |
| First Past the Post | 26,121 | 65.1 | |
| Mixed member proportional | 13,985 | 34.9 | |
| Total valid votes | 40,106 | 100.0 | |
| 2003 Ontario general election | ||||||||
|---|---|---|---|---|---|---|---|---|
| Party | Candidate | Votes | % | ±% | ||||
| Liberal | Tim Peterson | 17,211 | 43.80 | +12.32 | ||||
| Progressive Conservative | Margaret Marland | 16,977 | 43.20 | -18.07 | ||||
| New Democratic | Ken Cole | 3,606 | 9.18 | +3.3 | ||||
| Green | Pamela Murray | 949 | 2.41 | |||||
| Family Coalition | Alfred Zawadzki | 555 | 1.41 | |||||
| Total valid votes | 39,298 | 100.0% | ||||||
| 1999 Ontario general election | ||||||||
|---|---|---|---|---|---|---|---|---|
| Party | Candidate | Votes | % | ±% | ||||
| Progressive Conservative | Margaret Marland | 23,890 | 61.27 | -8.49 | ||||
| Liberal | Ieva Martin | 12,275 | 31.48 | +14.73 | ||||
| New Democratic | Ken Cole | 2,293 | 5.88 | -4.02 | ||||
| Independent | Tim Sullivan | 535 | 1.37 | |||||
| Total valid votes | 38,993 | 100.0 | ||||||
| 1995 Ontario general election | ||||||||
|---|---|---|---|---|---|---|---|---|
| Party | Candidate | Votes | % | ±% | ||||
| Progressive Conservative | Margaret Marland | 23,116 | 69.76 | +17.31 | ||||
| Liberal | Ieva Martin | 5,551 | 16.75 | -3.54 | ||||
| New Democratic | David Messenger[8] | 3,282 | 9.90 | -13.31 | ||||
| Natural Law | Scott Kay | 334 | 1.01 | |||||
| Independent | Adrian Earl Crewson | 309 | 0.93 | |||||
| Independent | Wolfgang G. Mueller | 287 | 0.87 | |||||
| Green | Matthew Wood | 256 | 0.77 | -3.28 | ||||
| Total valid votes | 33,135 | 100.0 | ||||||
| 1990 Ontario general election | ||||||||
|---|---|---|---|---|---|---|---|---|
| Party | Candidate | Votes | % | ±% | ||||
| Progressive Conservative | Margaret Marland | 17,126 | 52.45 | +10.21 | ||||
| New Democratic | Sue Craig | 7,579 | 23.21 | +8.04 | ||||
| Liberal | Donna Scott | 6,624 | 20.29 | -20.13 | ||||
| Green | Scott McWhinnie | 1,323 | 4.05 | |||||
| Total valid votes | 32,652 | 100.0 | ||||||
| 1987 Ontario general election | ||||||||
|---|---|---|---|---|---|---|---|---|
| Party | Candidate | Votes | % | ±% | ||||
| Progressive Conservative | Margaret Marland | 13,854 | 42.24 | -2.34 | ||||
| Liberal | Claudette MacKay-Lassonde | 13,255 | 40.42 | +1.13 | ||||
| New Democratic | Barry Stevens | 4,976 | 15.17 | -0.96 | ||||
| Freedom | Chris Balabanian | 712 | 2.17 | |||||
| Total valid votes | 32,797 | 100.0 | ||||||
| 1985 Ontario general election | ||||||||
|---|---|---|---|---|---|---|---|---|
| Party | Candidate | Votes | % | ±% | ||||
| Progressive Conservative | Margaret Marland | 13,186 | 44.58 | -11.05 | ||||
| Liberal | Carolynne Siller | 11,623 | 39.29 | +11.12 | ||||
| New Democratic | Barry Stevens | 4,770 | 16.13 | -0.07 | ||||
| Total valid votes | 29,579 | 100.0 | ||||||
| 1981 Ontario general election | ||||||||
|---|---|---|---|---|---|---|---|---|
| Party | Candidate | Votes | % | ±% | ||||
| Progressive Conservative | Douglas Kennedy | 14,165 | 55.63 | +7.72 | ||||
| Liberal | Basil Gerol | 7,172 | 28.17 | +1.39 | ||||
| New Democratic | Neil Davis | 4,126 | 16.20 | -9.11 | ||||
| Total valid votes | 25,463 | 100.0 | ||||||
| 1977 Ontario general election | ||||||||
|---|---|---|---|---|---|---|---|---|
| Party | Candidate | Votes | % | |||||
| Progressive Conservative | Douglas Kennedy | 13,622 | 47.91 | |||||
| Liberal | Mike Garvey | 7,616 | 26.78 | |||||
| New Democratic | Ted Humphreys | 7,196 | 25.31 | |||||
| Total valid votes | 28,434 | 100.0 | ||||||
References
- "Ontario's Liberal government adds 15 new ridings, bringing total to 122". CBC. Canadian Press. December 2, 2015. Retrieved August 5, 2017.
- For a listing of each MPP's Queen's Park curriculum vitae see below:
- For Douglas Kennedy's Legislative Assembly information see "Robert Douglas Kennedy, MPP". Parliamentary History. Toronto: Legislative Assembly of Ontario. 2015. Archived from the original on 2016-03-04. Retrieved 2015-12-06.
- For Margaret Marland's Legislative Assembly information see "Margaret Marland, MPP". Parliamentary History. Toronto: Legislative Assembly of Ontario. 2015.
- For Tim Peterson's Legislative Assembly information see "Tim Peterson, MPP". Parliamentary History. Toronto: Legislative Assembly of Ontario. 2015.
- For Charles Sousa's Legislative Assembly information see "Charles Sousa, MPP". Parliamentary History. Toronto: Legislative Assembly of Ontario. 2015.
- "VOTE TOTALS FROM OFFICIAL TABULATION / RAPPORT DU TOTAL DES VOTES DE LA TABULATION OFFICIELLE" (PDF). Elections Ontario. Retrieved June 10, 2022.
- "Summary of Valid Votes Cast for each Candidate" (PDF). Elections Ontario. p. 7. Retrieved 20 January 2019.
- "63 - Mississauga-Lakeshore".
- Elections Ontario (2014). "Official result from the records, 050 Mississauga South" (PDF). Retrieved 27 June 2015.
- Elections Ontario (2011). "Official return from the records / Rapport des registres officiels - Mississauga South" (PDF). Retrieved 3 June 2014.
- 1995 Election results Archived 2014-03-30 at the Wayback Machine