New Hanover County, North Carolina
New Hanover County is a county located in the U.S. state of North Carolina. As of the 2020 census, the population was 225,702.[1] Though the second-smallest county in North Carolina by land area,[2] it is one of the most populous, as its county seat, Wilmington,[3] is one of the state's largest cities. The county was created in 1729 as New Hanover Precinct and gained county status in 1739.[4] New Hanover County is included in the Wilmington, NC Metropolitan Statistical Area, which also includes neighboring Pender County.
New Hanover County | |
|---|---|
_17.jpg.webp) | |
 Flag  Seal | |
| Motto: "The model of good governance" | |
 Location within the U.S. state of North Carolina | |
 North Carolina's location within the U.S. | |
| Coordinates: 34°11′N 77°52′W | |
| Country | |
| State | |
| Founded | 1729 |
| Named for | House of Hanover |
| Seat | Wilmington |
| Largest city | Wilmington |
| Area | |
| • Total | 328 sq mi (850 km2) |
| • Land | 192 sq mi (500 km2) |
| • Water | 137 sq mi (350 km2) 42% |
| Population (2020) | |
| • Total | 225,702 |
| • Estimate (2022) | 234,921 |
| • Density | 1,175.5/sq mi (453.9/km2) |
| Time zone | UTC−5 (Eastern) |
| • Summer (DST) | UTC−4 (EDT) |
| Congressional district | 7th |
| Website | www |
History
Located in the Low Country or Tidewater of North Carolina, the county was formed in 1729 as New Hanover Precinct of Bath County, from Craven Precinct. It was named for the House of Hanover, a German royal family then ruling Great Britain.[5]
In 1734 parts of New Hanover Precinct became Bladen Precinct and Onslow Precinct. With the abolition of Bath County in 1739, all of its constituent precincts became counties.
In 1750 the northern part of New Hanover County became Duplin County. In 1764 another part of New Hanover County was combined with part of Bladen County to form Brunswick County. Finally, in 1875 the separation of northern New Hanover County to form Pender County reduced it to its present dimensions. The county was developed as plantations, largely for the cultivation of tobacco and other commodity crops by enslaved African Americans.
By 1860, the county seat and county were majority-black in population, with most of those people enslaved. Some of the closing battles of the American Civil War took place in this county, including the Second Battle of Fort Fisher (the last major coastal stronghold of the Confederacy) and the Battle of Wilmington. White Democrats were resentful when freedmen were given the vote.
Following the Reconstruction era, white Democrats regained control of the state legislature and continued to impose white supremacy across the state through Jim Crow laws. Violence by whites against blacks increased in the late 19th century, with 22 lynching deaths of African Americans recorded before the mid-20th century.[6][7]
Racial terrorism on a larger scale took place in the Wilmington Insurrection of 1898, when a group of white Democrats rejected a duly elected, biracial city government. After overthrowing the Fusionist government, the mayor and city council, they led mobs that rioted and attacked the city's black neighborhoods and residents. A total of 60 to 300 blacks are believed to have been killed in the rioting, leaders were driven out of the city, and the presses of a black-owned newspaper were destroyed, along with many houses and businesses.
The insurrection was planned by a group of nine conspirators, who included Hugh MacRae. He later donated land to New Hanover County for a park; it was named in his honor. A plaque was installed there explaining the donation and his life; it does not refer to his role in the 1898 coup d'état.
Soon after, the state passed a new constitution raising barriers to voter registration: this effectively disenfranchised most blacks and imposed Jim Crow laws, forcing blacks out of the political system and into legal second-class status. These civil rights injustices were largely maintained into the 1960s, three generations later.
Geography


According to the U.S. Census Bureau, the county has a total area of 328 square miles (850 km2), of which 192 square miles (500 km2) is land and 137 square miles (350 km2) (42%) is water.[8] It is the second-smallest county in North Carolina by land area (ahead of only Chowan County).
State and Local protected areas/sites
- Airlie Gardens
- Battleship North Carolina
- Battery Buchanan
- Bluethenthal Wildflower Preserve
- Cape Fear Museum
- Cape Fear River Wetlands Game Land (part)[9]
- Carolina Beach State Park
- Federal Point
- Fort Fisher State Historic Site
- Fort Fisher State Recreation Area
- Masonboro Island Estuarine Reserve Dedicated Nature Preserve
- Masonboro Island Reserve
- Masonboro Sound Area Outstanding Resource Water
- New Hanover County Arboretum
- North Carolina Aquarium at Fort Fisher
- Pages Creek Park Preserve[10]
- The Rocks at Fort Fisher
- South of Onslow County Mechanical Harvesting of Oysters Prohibited Area (part)
- Sutton Lake Game Land[11]
- Topsail Sound and Middle Sound Area Outstanding Resource Water
- Wilmington Historic District
- Zekes Island Estuarine Reserve Dedicated Nature Preserve (part)
- Zeke's Island Reserve (part)
Major water bodies
- Atlantic Ocean
- Banks Channel
- Bradley Creek
- Brunswick River
- Cape Fear River
- Frying Pan Shoals
- Futch Creek
- Greenfield Lake
- Hewletts Creek
- Howe Creek
- Intracoastal Waterway
- Island Creek[12]
- Lake Sutton
- Leutze Lake
- Northeast Cape Fear River
- Onslow Bay
- Prince George Creek[13]
- Smith Creek
- Snow's Cut
- Whiskey Creek
Islands
Adjacent counties
- Pender County - north
- Brunswick County - west
Major highways
 I-40
I-40
 I-140 / NC 140
 US 17
US 17 US 17 Byp. (Hampstead Bypass)
 US 17 Bus.
 US 74
US 74 US 76
US 76 US 117
 US 421
 US 421 Truck
 NC 132
 NC 133
 NC 211
Major infrastructure
- Amtrak Thruway (Forden Station)
- Cape Fear Public Transportation Authority
- Fort Fisher-Southport Ferry (to Brunswick County)
- Pilots Ridge, small private airport near Myrtle Grove
- Port of Wilmington
- Wilmington International Airport
Demographics
| Census | Pop. | Note | %± |
|---|---|---|---|
| 1790 | 6,837 | — | |
| 1800 | 7,060 | 3.3% | |
| 1810 | 11,465 | 62.4% | |
| 1820 | 10,866 | −5.2% | |
| 1830 | 10,959 | 0.9% | |
| 1840 | 13,312 | 21.5% | |
| 1850 | 17,668 | 32.7% | |
| 1860 | 21,715 | 22.9% | |
| 1870 | 27,978 | 28.8% | |
| 1880 | 21,376 | −23.6% | |
| 1890 | 24,026 | 12.4% | |
| 1900 | 25,785 | 7.3% | |
| 1910 | 32,037 | 24.2% | |
| 1920 | 40,620 | 26.8% | |
| 1930 | 43,010 | 5.9% | |
| 1940 | 47,935 | 11.5% | |
| 1950 | 63,272 | 32.0% | |
| 1960 | 71,742 | 13.4% | |
| 1970 | 82,996 | 15.7% | |
| 1980 | 103,471 | 24.7% | |
| 1990 | 120,284 | 16.2% | |
| 2000 | 160,307 | 33.3% | |
| 2010 | 202,667 | 26.4% | |
| 2020 | 225,702 | 11.4% | |
| 2022 (est.) | 234,921 | [15] | 4.1% |
| U.S. Decennial Census[16] 1790-1960[17] 1900-1990[18] 1990-2000[19] 2010-2013[20] 2020[21] | |||
2020 census
| Race | Number | Percentage |
|---|---|---|
| White (non-Hispanic) | 167,150 | 74.06% |
| Black or African American (non-Hispanic) | 26,974 | 11.95% |
| Native American | 678 | 0.3% |
| Asian | 3,468 | 1.54% |
| Pacific Islander | 148 | 0.07% |
| Other/Mixed | 9,984 | 4.42% |
| Hispanic or Latino | 17,300 | 7.66% |
As of the 2020 United States census, there were 225,702 people, 100,189 households, and 56,160 families residing in the county.
2000 census
As of the census[23] of 2000, there were 160,307 people, 68,183 households, and 41,591 families residing in the county. The population density was 806 people per square mile (311 people/km2). There were 79,616 housing units at an average density of 400 per square mile (150/km2). The racial makeup of the county was 79.91% White, 16.97% Black or African American, 0.39% Native American, 0.83% Asian, 0.06% Pacific Islander, 0.79% from other races, and 1.05% from two or more races. 2.04% of the population were Hispanic or Latino of any race. 14.3% were of English, 13.0% United States or American, 10.6% German and 10.2% Irish ancestry according to Census 2000.
There were 68,183 households, out of which 26.10% had children under the age of 18 living with them, 46.50% were married couples living together, 11.50% had a female householder with no husband present, and 39.00% were non-families. 28.90% of all households were made up of individuals, and 8.50% had someone living alone who was 65 years of age or older. The average household size were 2.29 and the average family size was 2.83.
In the county, the population was spread out, with 21.00% under the age of 18, 12.00% from 18 to 24, 30.50% from 25 to 44, 23.70% from 45 to 64, and 12.80% who were 65 years of age or older. The median age was 36 years. For every 100 females there were 93.30 males. For every 100 females age 18 and over, there were 90.70 males.
The median income for a household in the county was $40,172, and the median income for a family was $50,861. Males had a median income of $35,801 versus $25,305 for females. The per capita income for the county was $23,123. About 8.30% of families and 13.10% of the population were below the poverty line, including 15.70% of those under age 18 and 9.00% of those age 65 or over.
Law and government
_9_(cropped).jpg.webp)
New Hanover is considered a fairly evenly divided county in political terms, favoring Democrats and Republicans in near equal measure. In the 2004 presidential elections, the county supported George W. Bush over John Kerry by 56% to 44%. On that same day, it voted by 53% to 45% to re-elect Democratic Governor Mike Easley against local Republican Patrick J. Ballantine.
New Hanover County is primarily represented in the U.S. House of Representatives by the Republican David Rouser, who represents North Carolina's 7th congressional district. In 2012, a portion of Northwestern and Central New Hanover County was redistricted to the North Carolina's 3rd congressional district, which was represented by the Republican Walter B. Jones before his death, and in the 9th Senate district in the North Carolina Senate by Sen. Michael V. Lee (R). Of its three members of the North Carolina House of Representatives, they represent the 18th, 19th, and 20th house districts, two are Republicans, and one is a Democrat.
New Hanover County is a member of the regional Cape Fear Council of Governments.
Politics
Following the Civil War, New Hanover County was relatively Republican leaning, with it voting for the Republican candidate in all but one election from 1868 to 1896. However, it transitioned into a typical "Solid South" county between 1900 and 1968 with the exception of 1928, when Herbert Hoover carried it due to anti-Catholic sentiment against Democratic nominee Al Smith. However, Democratic strength began to erode in the 1950s: Adlai Stevenson carried it in 1952 by only 5.08%, again in 1956 by 3.94%, John F. Kennedy in 1960 by 14.84%, and Lyndon B. Johnson in 1964 by 1.8%, before flipping to Richard Nixon in 1968. Between 1968 and 2016, only one Democrat – fellow Southerner Jimmy Carter in 1976 – would win the county until 2020 when it was narrowly carried by Joe Biden. In the lead-up to the 2020 election, it was considered a bellwether and swing county due to its high population of elderly and African American voters.[24]
| Year | Republican | Democratic | Third party | |||
|---|---|---|---|---|---|---|
| No. | % | No. | % | No. | % | |
| 2020 | 63,331 | 48.04% | 66,138 | 50.17% | 2,361 | 1.79% |
| 2016 | 55,344 | 49.46% | 50,979 | 45.56% | 5,582 | 4.99% |
| 2012 | 53,385 | 51.52% | 48,668 | 46.96% | 1,575 | 1.52% |
| 2008 | 50,544 | 50.21% | 49,145 | 48.82% | 976 | 0.97% |
| 2004 | 45,351 | 55.82% | 35,572 | 43.78% | 324 | 0.40% |
| 2000 | 36,503 | 55.04% | 29,292 | 44.17% | 524 | 0.79% |
| 1996 | 27,889 | 50.92% | 22,839 | 41.70% | 4,041 | 7.38% |
| 1992 | 24,338 | 46.67% | 20,291 | 38.91% | 7,525 | 14.43% |
| 1988 | 23,807 | 60.56% | 15,401 | 39.18% | 105 | 0.27% |
| 1984 | 23,771 | 65.21% | 12,591 | 34.54% | 90 | 0.25% |
| 1980 | 17,243 | 53.48% | 13,670 | 42.40% | 1,331 | 4.13% |
| 1976 | 13,687 | 48.06% | 14,504 | 50.93% | 286 | 1.00% |
| 1972 | 19,060 | 74.41% | 5,894 | 23.01% | 661 | 2.58% |
| 1968 | 10,020 | 37.03% | 7,750 | 28.64% | 9,291 | 34.33% |
| 1964 | 12,140 | 49.10% | 12,584 | 50.90% | 0 | 0.00% |
| 1960 | 9,775 | 42.58% | 13,182 | 57.42% | 0 | 0.00% |
| 1956 | 9,470 | 48.03% | 10,247 | 51.97% | 0 | 0.00% |
| 1952 | 9,330 | 47.46% | 10,330 | 52.54% | 0 | 0.00% |
| 1948 | 3,162 | 28.25% | 5,364 | 47.92% | 2,667 | 23.83% |
| 1944 | 2,829 | 23.01% | 9,467 | 76.99% | 0 | 0.00% |
| 1940 | 1,635 | 15.97% | 8,600 | 84.03% | 0 | 0.00% |
| 1936 | 1,306 | 15.04% | 7,379 | 84.96% | 0 | 0.00% |
| 1932 | 1,430 | 18.81% | 6,030 | 79.33% | 141 | 1.86% |
| 1928 | 4,248 | 60.62% | 2,760 | 39.38% | 0 | 0.00% |
| 1924 | 1,190 | 18.80% | 4,735 | 74.80% | 405 | 6.40% |
| 1920 | 712 | 14.79% | 4,102 | 85.21% | 0 | 0.00% |
| 1916 | 492 | 17.28% | 2,355 | 82.72% | 0 | 0.00% |
| 1912 | 140 | 6.17% | 2,021 | 89.11% | 107 | 4.72% |
| 1908 | 511 | 21.58% | 1,857 | 78.42% | 0 | 0.00% |
| 1904 | 91 | 6.77% | 1,254 | 93.23% | 0 | 0.00% |
| 1900 | 60 | 2.60% | 2,247 | 97.40% | 0 | 0.00% |
| 1896 | 3,183 | 58.17% | 2,100 | 38.38% | 189 | 3.45% |
| 1892 | 1,500 | 38.01% | 2,408 | 61.02% | 38 | 0.96% |
| 1888 | 2,856 | 60.43% | 1,870 | 39.57% | 0 | 0.00% |
| 1884 | 2,894 | 62.38% | 1,745 | 37.62% | 0 | 0.00% |
| 1880 | 2,200 | 55.88% | 1,438 | 36.53% | 299 | 7.59% |
Education
The county is served by New Hanover County Schools.
Healthcare
New Hanover Regional Medical Center is a hospital in Wilmington. It was established in 1967 as a public hospital, and it was the first hospital in the city to admit patients of all races.[26] It was operated by New Hanover County.[27] In February 2021 Novant Health, a nonprofit private organization, acquired the hospital.[28]
Communities

City
- Wilmington (county seat and largest city)
Census-designated places
Unincorporated community
Former communities
Townships
- Cape Fear
- Federal Point
- Harnett
- Masonboro
- Wilmington
Notable people
- Michael Jordan, NBA player
- Meadowlark Lemon, NBA player for the Harlem Globetrotters
See also
- List of counties in North Carolina
- National Register of Historic Places listings in New Hanover County, North Carolina
- Films and television shows produced in Wilmington, North Carolina
- Federal Point Light, deactivated lighthouse that used to be located at Fort Fisher
- Frying Pan Shoals Light, old lighthouse south of Fort Fisher
- 2018 Cape Fear River coal ash spill, coal ash spill caused by a dam failure after Hurricane Florence
- GenX, chemical compound found in the Cape Fear River, south of Fayetteville
References
- "U.S. Census Bureau QuickFacts: New Hanover County, North Carolina". www.census.gov. Retrieved April 19, 2022.
- "North Carolina Land Area County Rank". www.usa.com. Retrieved September 17, 2018.
- "Find a County". National Association of Counties. Retrieved June 7, 2011.
- "North Carolina: Individual County Chronologies". North Carolina Atlas of Historical County Boundaries. The Newberry Library. 2009. Archived from the original on March 4, 2016. Retrieved January 25, 2015.
- Proffitt, Martie (April 17, 1983). "Local history offers tasty tidbits". Star-News. pp. 8C. Retrieved November 1, 2015.
- "Lynching in America/Supplement: Lynching by County, 3rd edition" Archived 2017-10-23 at the Wayback Machine, 2017, Montgomery, Alabama: Equal Justice Initiative, p. 7
- Johnson, Allen. "Allen Johnson: Lynching memorial a stark reminder of terrorism in America". Greensboro News and Record. Retrieved March 12, 2023.
- "2010 Census Gazetteer Files". United States Census Bureau. August 22, 2012. Archived from the original on January 12, 2015. Retrieved January 18, 2015.
- "NCWRC Game Lands". www.ncpaws.org. Retrieved March 30, 2023.
- "Pages Creek Park Preserve - Parks & Gardens - Parks - North Carolina". Parks. Retrieved August 12, 2022.
- "NCWRC Game Lands". www.ncpaws.org. Retrieved March 30, 2023.
- Wood, Andy; Shew, Roger (March 30, 2023). "Island Creek Basin Ecosystems: An Imperiled Biodiversity Hotspot". newhanoversheriff.com. Retrieved May 3, 2023.
- "Prince George Creek Near Wrightsboro, NC (USGS-02108622)". www.waterqualitydata.us. April 23, 2023. Retrieved April 23, 2023.
- Island, Preserve Eagles. "Preserve Eagles Island". Preserve Eagles Island. Retrieved April 18, 2023.
- "U.S. Census Bureau QuickFacts: New Hanover County, North Carolina". www.census.gov. Retrieved May 31, 2022.
- "U.S. Decennial Census". United States Census Bureau. Retrieved January 18, 2015.
- "Historical Census Browser". University of Virginia Library. Retrieved January 18, 2015.
- Forstall, Richard L., ed. (March 27, 1995). "Population of Counties by Decennial Census: 1900 to 1990". United States Census Bureau. Retrieved January 18, 2015.
- "Census 2000 PHC-T-4. Ranking Tables for Counties: 1990 and 2000" (PDF). United States Census Bureau. April 2, 2001. Archived (PDF) from the original on March 27, 2010. Retrieved January 18, 2015.
- "State & County QuickFacts". United States Census Bureau. Retrieved October 27, 2013.
- "U.S. Census Bureau QuickFacts: New Hanover County, North Carolina". www.census.gov. Retrieved May 31, 2022.
- "Explore Census Data". data.census.gov. Retrieved December 24, 2021.
- "U.S. Census website". United States Census Bureau. Retrieved January 31, 2008.
- Wasserman, David (October 6, 2020). "Opinion | The 10 Bellwether Counties That Show How Trump Is in Serious Trouble". The New York Times. ISSN 0362-4331.
{{cite news}}: CS1 maint: url-status (link) - Leip, David. "Dave Leip's Atlas of U.S. Presidential Elections". uselectionatlas.org. Retrieved March 16, 2018.
- Rau, Jordan (January 28, 2021). "In the midst of the pandemic, a public hospital is gobbled up". Fortune Magazine. Retrieved November 19, 2021.
- "Annual Financial Report New Hanover Regional Medical Center Wilmington, North Carolina (A Component Unit of New Hanover County, North Carolina) Years Ended September 30, 2019 and 2018 With Report of Independent Auditor" (PDF). New Hanover Regional Medical Center. Archived (PDF) from the original on January 30, 2021. Retrieved November 19, 2021.
- Paavola, Alia (February 1, 2021). "Novant buys North Carolina health system". Beckers Hospital Review. Retrieved November 19, 2021.
External links
 Geographic data related to New Hanover County, North Carolina at OpenStreetMap
- Official website
- NCGenWeb New Hanover County - free genealogy resources for the county
Places adjacent to New Hanover County, North Carolina | ||||||||||||||||
|---|---|---|---|---|---|---|---|---|---|---|---|---|---|---|---|---|
| ||||||||||||||||
Municipalities and communities of New Hanover County, North Carolina, United States | ||
|---|---|---|
| City | 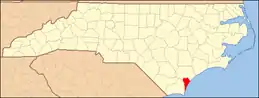 | |
| Towns | ||
| CDPs | ||
| Unincorporated community | ||
| Former communities | ||
New Hanover County Schools operates public schools in this county. | ||
| Public |
| |
| Private |
| |
| ||