Ottawa West—Nepean (provincial electoral district)
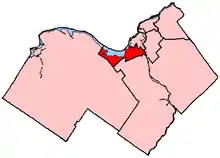
Ottawa West—Nepean (French: Ottawa-Ouest–Nepean) is a provincial electoral district in eastern Ontario, Canada. It elects one member to the Legislative Assembly of Ontario.
 | |||
| Provincial electoral district | |||
| Legislature | Legislative Assembly of Ontario | ||
| MPP |
New Democratic | ||
| First contested | 1999 | ||
| Last contested | 2022 | ||
| Demographics | |||
| Population (2016) | 111,835 | ||
| Electors (2018) | 89,575 | ||
| Area (km²) | 88 | ||
| Pop. density (per km²) | 1,270.9 | ||
| Census division(s) | Ottawa | ||
| Census subdivision(s) | Ottawa | ||
The riding is represented in the Ontario legislature by the NDP's Chandra Pasma.
The riding has been fairly solidly Liberal. In the 1999 provincial election, former Member of Provincial Parliament Alex Cullen lost the nomination to Rick Chiarelli following fierce party battles. Cullen instead ran for the Ontario New Democratic Party (NDP). The seat was won by Tory Garry Guzzo. In the 2003 provincial election, former Ottawa mayor Jim Watson ousted Guzzo.
Former Ottawa mayor Bob Chiarelli won the seat in a March 4, 2010, by-election, after Jim Watson left his seat to run in the 2010 Ottawa municipal election. Chiarelli lost his seat to PC Jeremy Roberts in 2018 which saw the former governing Liberals fall to third place in the legislature. In the 2022 provincial election the NDP's Chandra Pasma defeated Roberts, the only PC incumbent to lose his seat in the election. This marked the first time the NDP had ever won the seat, either provincially or federally.
History
The electoral district was created in 1999 from 77% of Ottawa West, 38% of Nepean and 21% of Ottawa—Rideau.
Members of Provincial Parliament
This riding has elected the following members of the Legislative Assembly of Ontario:
| Ottawa West—Nepean | ||||
|---|---|---|---|---|
| Assembly | Years | Member | Party | |
| Riding created from Ottawa West, Nepean and Ottawa—Rideau | ||||
| 37th | 1999–2003 | Garry Guzzo | Progressive Conservative | |
| 38th | 2003–2007 | Jim Watson | Liberal | |
| 39th | 2007–2010 | |||
| 2010–2011 | Bob Chiarelli | |||
| 40th | 2011–2014 | |||
| 41st | 2014–2018 | |||
| 42nd | 2018–2022 | Jeremy Roberts | Progressive Conservative | |
| 43rd | 2022–present | Chandra Pasma | New Democratic | |
Election results
| 2022 Ontario general election | ||||||||
|---|---|---|---|---|---|---|---|---|
| Party | Candidate | Votes | % | ±% | ||||
| New Democratic | Chandra Pasma | 15,696 | 37.54 | +5.06 | ||||
| Progressive Conservative | Jeremy Roberts | 14,610 | 34.94 | +2.12 | ||||
| Liberal | Sam Bhalesar | 9,384 | 22.44 | -6.86 | ||||
| Green | Steven Warren | 1,475 | 3.52 | -0.31 | ||||
| Ontario Party | Vilteau Delvas | 649 | 1.55 | |||||
| Total valid votes | 41,814 | 98.56 | ||||||
| Total rejected, unmarked and declined ballots | 601 | 1.44 | +0.36 | |||||
| Turnout | 42,415 | 46.97 | -10.07 | |||||
| Eligible voters | 90,305 | |||||||
| New Democratic gain from Progressive Conservative | Swing | +1.26 | ||||||
| Source: Elections Ontario[1] | ||||||||
| 2018 Ontario general election | ||||||||
|---|---|---|---|---|---|---|---|---|
| Party | Candidate | Votes | % | ±% | ||||
| Progressive Conservative | Jeremy Roberts | 16,590 | 32.82 | −1.06 | ||||
| New Democratic | Chandra Pasma | 16,415 | 32.48 | +18.06 | ||||
| Liberal | Bob Chiarelli | 14,810 | 29.30 | −15.54 | ||||
| Green | Pat Freel | 1,937 | 3.83 | −2.35 | ||||
| None of the Above | Colin A. Pritchard | 542 | 1.07 | |||||
| Libertarian | Nicholas Paliga | 251 | 0.50 | -0.18 | ||||
| Total valid votes | 50,545 | 98.92 | ||||||
| Total rejected, unmarked and declined ballots | 552 | 1.08 | -0.43 | |||||
| Turnout | 51,097 | 57.04 | +1.10 | |||||
| Eligible voters | 89,575 | |||||||
| Progressive Conservative gain from Liberal | Swing | +7.24 | ||||||
| Source: Elections Ontario[2] | ||||||||
| 2014 Ontario general election | ||||||||
|---|---|---|---|---|---|---|---|---|
| Party | Candidate | Votes | % | ±% | ||||
| Liberal | Bob Chiarelli | 21,035 | 44.84 | +4.06 | ||||
| Progressive Conservative | Randall Denley | 15,895 | 33.89 | −6.06 | ||||
| New Democratic | Alex Cullen | 6,760 | 14.41 | −0.51 | ||||
| Green | Alex Hill | 2,899 | 6.18 | +2.67 | ||||
| Libertarian | Matthew Brooks | 318 | 0.68 | |||||
| Total valid votes | 46,907 | 98.49 | ||||||
| Total rejected, unmarked and declined ballots | 719 | 1.51 | ||||||
| Turnout | 47,626 | 55.95 | ||||||
| Eligible voters | 85,125 | |||||||
| Liberal hold | Swing | +5.06 | ||||||
Source(s)
"General Election Results by District, 066 Ottawa West—Nepean". Elections Ontario. 2014. Retrieved 17 June 2014. | ||||||||
| 2011 Ontario general election | ||||||||
|---|---|---|---|---|---|---|---|---|
| Party | Candidate | Votes | % | ±% | Expenditures | |||
| Liberal | Bob Chiarelli | 18,492 | 41.62 | −1.83 | $ 93,241.85 | |||
| Progressive Conservative | Randall Denley | 17,483 | 39.35 | +0.36 | 80,950.00 | |||
| New Democratic | Wendy Byrne | 6,576 | 14.80 | +6.35 | 13,936.09 | |||
| Green | Alex Hill | 1,485 | 3.34 | −4.96 | 3,113.29 | |||
| Family Coalition | John Pacheco | 396 | 0.89 | 8,382.66 | ||||
| Total valid votes / Expense limit | 44,432 | 100.00 | +56.27 | $ 97,809.67 | ||||
| Total rejected, unmarked and declined ballots | 174 | 0.39 | −0.18 | |||||
| Turnout | 44,606 | 54.27 | +21.33 | |||||
| Eligible voters | 82,187 | −5.32 | ||||||
| Liberal hold | Swing | −1.10 | ||||||
Source(s)
"Summary of Valid Votes Cast for Each Candidate – October 6, 2011 General Election" (PDF). "Statistical Summary – General Elections 2011" ( "2011 Candidate Campaign Returns (CR-1)". Retrieved May 31, 2014. | ||||||||
| Ontario provincial by-election, March 4, 2010 Resignation of Jim Watson | ||||||||
|---|---|---|---|---|---|---|---|---|
| Party | Candidate | Votes | % | ±% | Expenditures | |||
| Liberal | Bob Chiarelli | 12,353 | 43.45 | −7.19 | $ 100,242.09 | |||
| Progressive Conservative | Beth Graham | 11,086 | 38.99 | +7.19 | 98,437.24 | |||
| New Democratic | Pam Fitzgerald | 2,404 | 8.45 | −1.24 | 20,689.04 | |||
| Green | Mark Mackenzie | 2,359 | 8.30 | +2.13 | 16,707.36 | |||
| Independent | John Turmel | 230 | 0.81 | 0.00 | ||||
| Total valid votes | 28,432 | 100.0 | −39.61 | |||||
| Total rejected ballots | 163 | 0.57 | −0.07 | |||||
| Turnout | 28,595 | 32.94 | −24.57 | |||||
| Eligible voters | 86,809 | +5.35 | ||||||
Source(s)
"Ottawa West-Nepean By-Election – March 4, 2010". Elections Ontario. Retrieved June 1, 2014. "2010 By-Election Returns – Ottawa West-Nepean – Candidate (CR-1) & Association (CR-3) Returns". "MPP Watson to run for Ottawa mayor". CBC News. Archived from the original on Jan 15, 2010. | ||||||||
| 2007 Ontario general election | ||||||||
|---|---|---|---|---|---|---|---|---|
| Party | Candidate | Votes | % | ±% | Expenditures | |||
| Liberal | Jim Watson | 23,842 | 50.64 | +3.60 | $ 81,588.12 | |||
| Progressive Conservative | Mike Patton | 14,971 | 31.80 | −9.44 | 67,155.94 | |||
| New Democratic | Lynn Hamilton | 4,564 | 9.69 | +1.35 | 15,904.92 | |||
| Green | Martin Hyde | 2,903 | 6.17 | +3.51 | 1,064.61 | |||
| Family Coalition | John Pacheco | 592 | 1.26 | 6,938.62 | ||||
| Independent | Robert Gilles Gauthier | 207 | 0.44 | −0.28 | Unavailable | |||
| Total valid votes/Expense limit | 47,079 | 100.0 | −4.24 | $ 88,988.76 | ||||
| Total rejected ballots | 304 | 0.64 | +0.09 | |||||
| Turnout | 47,383 | 57.51 | −4.62 | |||||
| Eligible voters | 82,397 | +3.55 | ||||||
Source(s) | ||||||||
| 2003 Ontario general election | ||||||||
|---|---|---|---|---|---|---|---|---|
| Party | Candidate | Votes | % | ±% | Expenditures | |||
| Liberal | Jim Watson | 23,127 | 47.04 | +12.68 | $ 67,833.00 | |||
| Progressive Conservative | Garry Guzzo | 20,277 | 41.24 | −6.55 | 60,734.31 | |||
| New Democratic | Marlene Rivier | 4,099 | 8.34 | −7.78 | 17,396.47 | |||
| Green | Neil Adair | 1,309 | 2.66 | +1.71 | 2,684.09 | |||
| Independent | Robert G. Gauthier | 353 | 0.72 | Unavailable | ||||
| Total valid votes/expense limit | 49,165 | 100.0 | +2.90 | $ 76,392.96 | ||||
| Total rejected ballots | 272 | 0.55 | −0.27 | |||||
| Turnout | 49,437 | 62.13 | +3.24 | |||||
| Eligible voters | 79,576 | −2.72 | ||||||
| 1999 Ontario general election | ||||||||
|---|---|---|---|---|---|---|---|---|
| Party | Candidate | Votes | % | Expenditures | ||||
| Progressive Conservative | Garry Guzzo | 22,834 | 47.79 | $ 52,524.00 | ||||
| Liberal | Rick Chiarelli | 16,419 | 34.36 | 69,057.01 | ||||
| New Democratic | Alex Cullen | 7,701 | 16.12 | 32,467.74 | ||||
| Green | Richard Warman | 453 | 0.95 | 0.00 | ||||
| Independent | Megan Hnatiw | 129 | 0.27 | 0.00 | ||||
| Independent | John Turmel | 94 | 0.20 | 0.00 | ||||
| Confederation of Regions | Anthony C. Silvestro | 79 | 0.17 | 806.00 | ||||
| Natural Law | Lester J. Newby | 70 | 0.15 | 0.00 | ||||
| Total valid votes/Expense limit | 47,779 | 100.0 | $ 78,526.08 | |||||
| Total rejected ballots | 393 | 0.82 | ||||||
| Turnout | 48,172 | 58.89 | ||||||
| Eligible voters | 81,798 | |||||||
2007 electoral reform referendum
| 2007 Ontario electoral reform referendum | |||
|---|---|---|---|
| Side | Votes | % | |
| First Past the Post | 30,528 | 68.8 | |
| Mixed member proportional | 15,172 | 31.2 | |
References
- "Candidates in: Ottawa West—Nepean (081)". Elections Ontario. Retrieved May 15, 2022.
- "Summary of Valid Votes Cast for each Candidate" (PDF). Elections Ontario. p. 8. Retrieved 20 January 2019.