Vancouver-Langara
Vancouver-Langara is a provincial electoral district for the Legislative Assembly of British Columbia, Canada.
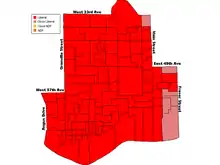
 Location in Vancouver | |||
| Provincial electoral district | |||
| Legislature | Legislative Assembly of British Columbia | ||
| MLA |
Liberal | ||
| First contested | 1991 | ||
| Last contested | 2020 | ||
| Demographics | |||
| Population (2015) | 60,041 | ||
| Area (km²) | 15 | ||
| Pop. density (per km²) | 4,002.7 | ||
| Census division(s) | Metro Vancouver | ||
| Census subdivision(s) | Vancouver | ||
History
This riding has elected the following Members of Legislative Assembly:
| Vancouver-Langara | ||||
|---|---|---|---|---|
| Assembly | Years | Member | Party | |
| 35th | 1991–1996 | Val Anderson | Liberal | |
| 36th | 1996–2001 | |||
| 37th | 2001–2005 | |||
| 38th | 2005–2009 | Carole Taylor | ||
| 39th | 2009–2013 | Moira Stilwell | ||
| 40th | 2013–2017 | |||
| 41st | 2017–2020 | Michael Lee | ||
| 42nd | 2020–present | |||
1999 Redistribution
Changes to the Vancouver-Langara electoral district in 1999 include:
- Addition of the area bounded by 33rd and 41st Avenues, and Main and Granville Streets
- Removal of the area bounded by Granville Street, 41st Avenue, 57th Avenue, and the Arbutus rail line
Member of Legislative Assembly
This riding is currently held by MLA Michael Lee, who was elected in the 2017 Provincial General Election. He represents the British Columbia Liberal Party.
From 2009-2017, the riding was held by Moira Stilwell, who represented the British Columbia Liberal Party as well. Stilwell was appointed Minister of Advanced Education and Labour Market Development in June 2009. Previously, the MLA was Carole Taylor, former chair of the CBC and former Vancouver City Councillor. She was first elected in 2005 and appointed the Minister of Finance. She represented the British Columbia Liberal Party. She resigned on December 18, 2008.
Election results
| 2020 British Columbia general election | ||||||||
|---|---|---|---|---|---|---|---|---|
| Party | Candidate | Votes | % | ±% | Expenditures | |||
| Liberal | Michael Lee | 9,888 | 48.51 | +1.05 | $58,300.21 | |||
| New Democratic | Tesicca Chi-Ying Truong | 8,431 | 41.36 | +3.30 | $42,051.83 | |||
| Green | Stephanie Hendy | 1,840 | 9.03 | −4.64 | $2,420.05 | |||
| Libertarian | Paul Matthews | 224 | 1.10 | – | $0.00 | |||
| Total valid votes | 20,383 | 100.00 | – | |||||
| Total rejected ballots | 180 | 0.88 | +0.23 | |||||
| Turnout | 20,563 | 49.45 | −6.99 | |||||
| Registered voters | 41,581 | |||||||
| Liberal hold | Swing | −1.13 | ||||||
| Source: Elections BC[1][2] | ||||||||
| 2017 British Columbia general election | ||||||||
|---|---|---|---|---|---|---|---|---|
| Party | Candidate | Votes | % | ±% | Expenditures | |||
| Liberal | Michael Lee | 10,047 | 47.46 | −5.14 | $57,579 | |||
| New Democratic | James Wang | 8,058 | 38.06 | −0.22 | $76,064 | |||
| Green | Janet Rhoda Fraser | 2,894 | 13.67 | +8.25 | $6,721 | |||
| Your Political Party | Surinder Singh Trehan | 172 | 0.81 | – | $6,699 | |||
| Total valid votes | 21,171 | 100.00 | – | |||||
| Total rejected ballots | 138 | 0.65 | −0.23 | |||||
| Turnout | 21,309 | 56.44 | +5.92 | |||||
| Registered voters | 37,754 | |||||||
| Source: Elections BC[3][4] | ||||||||
| 2013 British Columbia general election | ||||||||
|---|---|---|---|---|---|---|---|---|
| Party | Candidate | Votes | % | |||||
| Liberal | Moira Stilwell | 10,234 | 52.60 | |||||
| New Democratic | George Chow | 7,447 | 38.28 | |||||
| Green | Regan-Heng Zhang | 1,055 | 5.42 | |||||
| Conservative | Gurjinder Bains | 674 | 3.46 | |||||
| Platinum | Espavo Sozo | 45 | 0.23 | |||||
| Total valid votes | 19455 | 100.00 | ||||||
| Total rejected ballots | 172 | 0.88 | ||||||
| Turnout | 19627 | 50.52 | ||||||
| Source: Elections BC[5] | ||||||||
| 2009 British Columbia general election | ||||||||
|---|---|---|---|---|---|---|---|---|
| Party | Candidate | Votes | % | Expenditures | ||||
| Liberal | Moira Stilwell | 10,615 | 58.87 | $89,931 | ||||
| New Democratic | Helesia Luke | 6,340 | 35.16 | $19,002 | ||||
| Green | J-M Toriel | 1,075 | 5.97 | $948 | ||||
| Total valid votes | 18,030 | 100 | ||||||
| Total rejected ballots | 167 | 0.92 | ||||||
| Turnout | 18,197 | 47.71 | ||||||
| Party | Candidate | Votes | % | ± | Expenditures | |
|---|---|---|---|---|---|---|
| Liberal | Carole Taylor | 11,181 | 56.55 | $78,828 | ||
| NDP | Anita Romaniuk | 6,456 | 32.65 | $9,044 | ||
| Green | Doug Warkentin | 1,584 | 8.01 | – | $815 | |
| Marijuana | Mark Gueffroy | 214 | 1.08 | $100 | ||
| Libertarian | Christopher De Wilde | 185 | 0.94 | $100 | ||
| Work Less | Charlie Latimer | 152 | 0.77 | – | $100 | |
| Total Valid Votes | 19,77 | 100 | ||||
| Total Rejected Ballots | 183 | 0.93 | ||||
| Turnout | 19,955 | 53.51 | ||||
| Party | Candidate | Votes | % | ± | Expenditures | |
|---|---|---|---|---|---|---|
| Liberal | Val J. Anderson | 11,800 | 66.90% | $29,498 | ||
| NDP | Peter G. Prontzos | 2,999 | 17.00% | $2,596 | ||
| Green | Doug Warkentin | 2,009 | 11.39% | – | $2,347 | |
| Marijuana | Anthony Campbell | 673 | 3.82% | $394 | ||
| Independent | Joe Young | 105 | 0.60% | $362 | ||
| People's Front | Michael Hill | 51 | 0.29% | $57 | ||
| Total valid votes | 17,637 | 100.00% | ||||
| Total rejected ballots | 203 | 1.15% | ||||
| Turnout | 17,840 | 67.38% | ||||
| Party | Candidate | Votes | % | ± | Expenditures | |
|---|---|---|---|---|---|---|
| Liberal | Val J. Anderson | 11,038 | 60.20% | $25,864 | ||
| NDP | Ragini Rankin | 5,515 | 30.08% | $29,984 | ||
| Progressive Democrat | Philip Read | 839 | 4.58% | – | $488 | |
| Reform | Christie Jung | 519 | 2.83% | $7,749 | ||
| Green | Michael Airton | 337 | 1.84% | – | $100 | |
| Natural Law | Jerry Zen-Jih Chang | 89 | 0.49% | $118 | ||
| Total valid votes | 18,337 | 100.00% | ||||
| Total rejected ballots | 177 | 0.96% | ||||
| Turnout | 18,514 | 68.66% | ||||
| Party | Candidate | Votes | % | ± | Expenditures | |
|---|---|---|---|---|---|---|
| Liberal | Val J. Anderson | 7,241 | 36.95% | $13,737 | ||
| NDP | Peter M. Kendall | 6,774 | 34.57% | $25,805 | ||
| Social Credit | Russell G. Fraser | 5,374 | 27.42% | – | $50,387 | |
| Green | Kamala J. Todd | 134 | 0.68% | – | $32 | |
| Conservative | Malcolm A. Weatherston | 75 | 0.38% | |||
| Total valid votes | 19,598 | 100.00% | ||||
| Total rejected ballots | 373 | 1.87% | ||||
| Turnout | 19,971 | 72.64% | ||||
References
- "Statement of Votes — 42nd Provincial General Election" (PDF). Elections BC. Retrieved August 31, 2021.
- "Election Financing Reports". Elections BC. Retrieved March 19, 2021.
- "2017 Provincial General Election - Statement of Votes" (PDF). Elections BC. Retrieved December 27, 2020.
- "Election Financing Reports". Elections BC. Retrieved September 13, 2020.
- "Statement of Votes - 40th Provincial General Election" (PDF). Elections BC. Retrieved May 17, 2017.
External links
- Vancouver-Langara Electoral District Map (pdf)
- Results of 2013 election (pdf)
- Results of 2009 election (pdf)
- Results of 2005 election (pdf)
- BC Electoral Boundaries Report, 2015 (pdf)