1939 Swiss federal election
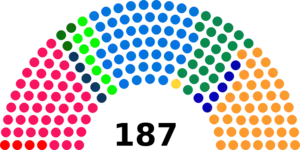
Federal elections were held in Switzerland on 29 October 1939.[1] The Free Democratic Party emerged as the largest party in the National Council, winning 49 of the 187 seats.[2] Due to the outbreak of World War II, there were no elections in nine of the 25 cantons; Appenzell Ausserrhoden, Lucerne, Neuchâtel, Schwyz, Solothurn, Ticino, Valais, Vaud and Zug.[3] In what became known as "silent elections", a total of 55 candidates were elected unopposed.[3]
| This article is part of a series on the |
.svg.png.webp) |
|---|
|
|
Results
National Council
 | |||||
|---|---|---|---|---|---|
| Party | Votes | % | Seats | +/– | |
| Social Democratic Party | 160,377 | 25.93 | 45 | –5 | |
| Free Democratic Party | 128,163 | 20.72 | 49 | +1 | |
| Conservative People's Party | 105,018 | 16.98 | 43 | +1 | |
| Party of Farmers, Traders and Independents | 91,182 | 14.74 | 22 | +1 | |
| Alliance of Independents | 43,735 | 7.07 | 9 | +2 | |
| Young Farmers | 27,708 | 4.48 | 3 | –1 | |
| Social-Political Group | 16,891 | 2.73 | 5 | +2 | |
| Communist Party | 15,962 | 2.58 | 4 | +2 | |
| Liberal Socialist Party | 10,865 | 1.76 | 1 | +1 | |
| Liberal Democratic Party | 10,241 | 1.66 | 6 | 0 | |
| Evangelical People's Party | 5,726 | 0.93 | 0 | –1 | |
| Other parties | 2,665 | 0.43 | 0 | 0 | |
| Total | 618,533 | 100.00 | 187 | 0 | |
| Valid votes | 618,533 | 96.67 | |||
| Invalid/blank votes | 21,332 | 3.33 | |||
| Total votes | 639,865 | 100.00 | |||
| Registered voters/turnout | 861,266 | 74.29 | |||
| Source: Mackie & Rose,[4] Nohlen & Stöver | |||||
By constituency
| Constituency | Seats | Electorate | Turnout | Party | Votes | Seats won | |
|---|---|---|---|---|---|---|---|
| Aargau | 12 | 75,509 | 67,271 | Social Democratic Party | 258,919 | 5 | |
| Conservative People's Party | 168,606 | 3 | |||||
| Party of Farmers, Traders and Independents | 113,270 | 2 | |||||
| Free Democratic Party | 125,232 | 2 | |||||
| Young Farmers | 41,663 | 0 | |||||
| Ring of Independents | 34,097 | 0 | |||||
| Evangelical People's Party | 27,075 | 0 | |||||
| Appenzell Ausserrhoden | 2 | Elected unopposed | Social Democratic Party | 1 | |||
| Free Democratic Party | 1 | ||||||
| Appenzell Innerrhoden | 1 | 3,501 | 2,153 | Conservative People's Party | 1,640 | 1 | |
| Basel-Landschaft | 4 | 28,207 | 17,788 | Social Democratic Party | 18,841 | 1 | |
| Free Democratic Party | 16,448 | 1 | |||||
| Liberal Socialist Party | 11,522 | 1 | |||||
| Basel Farmers' Party, Free Democrats and Independents | 8,864 | 1 | |||||
| Conservative People's Party | 8,767 | 1 | |||||
| Young Farmers | 2,788 | 0 | |||||
| Communist Party | 1,617 | 0 | |||||
| Action Committee for Breaking the Interest Bondage | 259 | 0 | |||||
| Basel-Stadt | 7 | 51,833 | 35,833 | Social Democratic Party | 81,452 | 2 | |
| Ring of Independents | 34,711 | 2 | |||||
| Liberal Democratic Party | 34,202 | 1 | |||||
| Free Democratic Party | 32,087 | 1 | |||||
| Conservative People's Party | 25,373 | 1 | |||||
| Communist Party | 22,784 | 0 | |||||
| Party of Farmers, Traders and Independents | 14,869 | 0 | |||||
| Bern | 31 | 209,052 | 148,467 | Party of Farmers, Traders and Independents | 1,421,518 | 10 | |
| Social Democratic Party | 1,351,567 | 10 | |||||
| Free Democratic Party | 674,258 | 5 | |||||
| Young Farmers | 458,062 | 3 | |||||
| Conservative People's Party | 267,642 | 2 | |||||
| Ring of Independents | 169,046 | 1 | |||||
| Liberal Socialist Party | 123,477 | 0 | |||||
| Communist Party | 24,891 | 0 | |||||
| Fribourg | 7 | 40,945 | 28,485 | Conservative People's Party | 118,997 | 5 | |
| Free Democratic Party | 51,815 | 2 | |||||
| Party of Farmers, Traders and Independents | 24,003 | 0 | |||||
| Geneva | 8 | 50,172 | 31,849 | Social Democratic Party | 90,591 | 3 | |
| Free Democratic Party | 81,438 | 3 | |||||
| Liberal Democratic Party | 42,836 | 1 | |||||
| Conservative People's Party | 34,276 | 1 | |||||
| Glarus | 2 | 10,148 | 7,828 | Social-Political Group | 6,495 | 1 | |
| Social Democratic Party | 4,496 | 1 | |||||
| Free Democratic Party | 4,242 | 0 | |||||
| Grisons | 6 | 37,409 | 28,325 | Social-Political Group | 64,095 | 3 | |
| Conservative People's Party | 56,059 | 2 | |||||
| Free Democratic Party | 28,669 | 1 | |||||
| Social Democratic Party | 15,939 | 0 | |||||
| Lucerne | 9 | Elected unopposed | Conservative People's Party | 5 | |||
| Free Democratic Party | 3 | ||||||
| Social Democratic Party | 1 | ||||||
| Neuchâtel | 6 | Elected unopposed | Social Democratic Party | 3 | |||
| Free Democratic Party | 2 | ||||||
| Liberal Democratic Party | 1 | ||||||
| Nidwalden | 1 | 4,463 | 3,180 | Conservative People's Party | 1,430 | 1 | |
| Obwalden | 1 | 5,461 | 2,275 | Conservative People's Party | 1,535 | 1 | |
| Schaffhausen | 2 | 15,692 | 13,896 | Social Democratic Party | 11,620 | 1 | |
| Free Democratic Party | 9,271 | 1 | |||||
| Party of Farmers, Traders and Independents | 5,502 | 0 | |||||
| Schwyz | 3 | Elected unopposed | Conservative People's Party | 2 | |||
| Free Democratic Party | 1 | ||||||
| Solothurn | 7 | Elected unopposed | Free Democratic Party | 3 | |||
| Social Democratic Party | 2 | ||||||
| Conservative People's Party | 2 | ||||||
| St. Gallen | 13 | 77,171 | 64,614 | Conservative People's Party | 317,244 | 6 | |
| Free Democratic Party | 213,143 | 4 | |||||
| Social Democratic Party | 128,964 | 2 | |||||
| Ring of Independents | 59,579 | 1 | |||||
| Association of Free Democrats | 38,509 | 0 | |||||
| Young Farmers | 35,309 | 0 | |||||
| Ticino | 7 | Elected unopposed | Conservative People's Party | 3 | |||
| Free Democratic Party | 2 | ||||||
| Social-Political Group | 1 | ||||||
| Social Democratic Party | 1 | ||||||
| Thurgau | 6 | 39,298 | 31,485 | Social Democratic Party | 49,323 | 2 | |
| Party of Farmers, Traders and Independents | 42,542 | 2 | |||||
| Conservative People's Party | 36,987 | 1 | |||||
| Free Democratic Party | 36,796 | 1 | |||||
| Young Farmers | 13,991 | 0 | |||||
| Uri | 1 | 6,979 | 4,091 | Free Democratic Party | 3,448 | 1 | |
| Vaud | 15 | Elected unopposed | Free Democratic Party | 6 | |||
| Social Democratic Party | 4 | ||||||
| Liberal Democratic Party | 3 | ||||||
| Party of Farmers, Traders and Independents | 2 | ||||||
| Valais | 6 | Elected unopposed | Conservative People's Party | 4 | |||
| Free Democratic Party | 1 | ||||||
| Social Democratic Party | 1 | ||||||
| Zug | 2 | Elected unopposed | Conservative People's Party | 1 | |||
| Free Democratic Party | 1 | ||||||
| Zürich | 28 | 205,426 | 152,325 | Social Democratic Party | 1,306,638 | 10 | |
| Ring of Independents | 724,715 | 5 | |||||
| Party of Farmers, Traders and Independents | 574,284 | 5 | |||||
| Free Democratic Party | 517,470 | 4 | |||||
| Social-Political Group | 338,508 | 2 | |||||
| Conservative People's Party | 287,214 | 2 | |||||
| Liberal Socialist Party | 111,943 | 0 | |||||
| Young Farmers | 104,068 | 0 | |||||
| Communist Party | 98,114 | 0 | |||||
| Evangelical People's Party | 97,178 | 0 | |||||
| Source: Bundesblatt, 29 November 1939 | |||||||
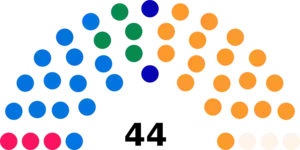
Council of the States
In several cantons the members of the Council of the States were chosen by the cantonal parliaments.[5]
 | |||
|---|---|---|---|
| Party | Seats | +/– | |
| Swiss Conservative People's Party | 18 | –1 | |
| Free Democratic Party | 14 | –1 | |
| Party of Farmers, Traders and Independents | 4 | +1 | |
| Social Democratic Party | 3 | 0 | |
| Liberal Democratic Party | 2 | 0 | |
| Social-Political Group | 0 | 0 | |
| Other parties | 3 | +1 | |
| Total | 44 | 0 | |
| Source: Nohlen & Stöver | |||
References
| Parliamentary elections | |
|---|---|
| Referendums |
|
This article is issued from Wikipedia. The text is licensed under Creative Commons - Attribution - Sharealike. Additional terms may apply for the media files.