1984 New South Wales state election
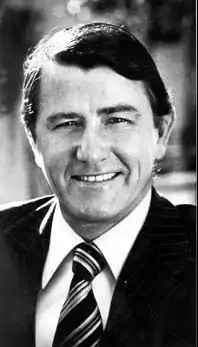
Elections were held in the state of New South Wales, Australia, on Saturday 24 March 1984. The Labor government led by Neville Wran won a fourth term in office, though with a reduced (if still sizeable) majority and a 7% swing against it.
| ||||||||||||||||||||||||||||||||||||||||
All 99 seats in the New South Wales Legislative Assembly and 15 (of the 45) seats in the New South Wales Legislative Council 50 Assembly seats were needed for a majority | ||||||||||||||||||||||||||||||||||||||||
|---|---|---|---|---|---|---|---|---|---|---|---|---|---|---|---|---|---|---|---|---|---|---|---|---|---|---|---|---|---|---|---|---|---|---|---|---|---|---|---|---|
| ||||||||||||||||||||||||||||||||||||||||
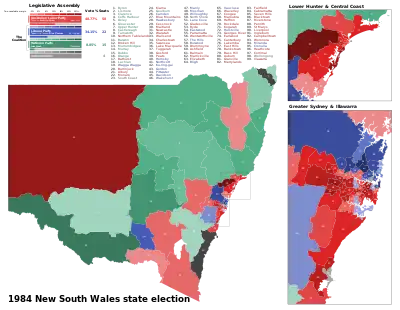 Two-candidate-preferred margin by electorate | ||||||||||||||||||||||||||||||||||||||||
| ||||||||||||||||||||||||||||||||||||||||
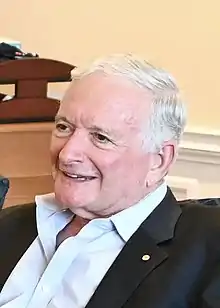
As the two previous elections each saw the sitting Opposition Leader lose the election and failing to be elected to Parliament, the 1984 election saw Nick Greiner becoming the first Opposition Leader to lose an election and retain his seat since Pat Hills in 1974.
Independents Ted Mack and John Hatton retained their seats of North Shore and South Coast respectively. They were joined on the cross benches by a third independent and Bruce Duncan.
Duncan, a former National Country Party member, withdrew from the party in protest at their change to the National Party name. He ran on an "Independent Country Party" ticket and won his seat of Lismore.
At a 1981 referendum, voters had approved an increase in the maximum parliamentary term from three years to four.
Key dates
| Date | Event |
|---|---|
| 5 March 1984 | The Legislative Assembly was dissolved, and writs were issued by the Governor to proceed with an election.[1] |
| 9 March 1984 | Nominations for candidates for the election closed at noon. |
| 24 March 1984 | Polling day, between the hours of 8am and 6pm. |
| 5 April 1984 | The seventh Wran Ministry was reconstituted. |
| 30 April 1984 | The writ was returned and the results formally declared. |
| 1 May 1984 | Parliament resumed for business. |
Results
Legislative Assembly
|
New South Wales state election, 24 March 1984[1][2][3] | ||||||
|---|---|---|---|---|---|---|
| Enrolled voters | 3,330,350 | |||||
| Votes cast | 3,081,226 | Turnout | 92.52 | +1.37 | ||
| Informal votes | 74,316 | Informal | 2.41 | –0.67 | ||
| Summary of votes by party | ||||||
| Party | Primary votes | % | Swing | Seats | Change | |
| Labor | 1,466,413 | 48.77 | –6.95 | 58 | – 11 | |
| Liberal | 1,026,901 | 34.15 | +6.53 | 22 | + 8 | |
| National | 266,095 | 8.85 | –2.37 | 15 | + 1 | |
| Democrats | 85,604 | 2.85 | +0.42 | 0 | ± 0 | |
| Ind. Country | 25,227 | 0.84 | +0.84 | 1 | + 1 | |
| Call to Australia | 2,347 | 0.08 | +0.08 | 0 | ± 0 | |
| Socialist Labour | 2,113 | 0.07 | +0.07 | 0 | ± 0 | |
| Independent | 130,013 | 4.32 | +1.53 | 3 | + 1 | |
| Other[lower-alpha 1] | 2,197 | 0.07 | +0.07 | 0 | ± 0 | |
| Total | 3,006,910 | 99 | ||||
| Two-party-preferred | ||||||
| Labor | 52.4% | -6.3% | ||||
| Liberal/National | 47.6% | +6.3% | ||||
Legislative Council
|
New South Wales state election, 24 March 1984[4] | ||||||
|---|---|---|---|---|---|---|
| Enrolled voters | 3,330,350 | |||||
| Votes cast | 3,081,223 | Turnout | 92.52 | +1.38 | ||
| Informal votes | 205,275 | Informal | 6.66 | –0.18 | ||
| Summary of votes by party | ||||||
| Party | Primary votes | % | Swing | Seats won |
Seats held | |
| Labor | 1,348,348 | 46.88 | –4.90 | 7 | 24 | |
| Liberal/National Coalition | 1,225,519 | 42.61 | +8.84 | 7 | 18 | |
| Call to Australia | 175,068 | 6.09 | –3.02 | 1 | 2 | |
| Democrats | 90,634 | 3.15 | –0.88 | 0 | 1 | |
| Concerned Citizens | 14,036 | 0.49 | +0.49 | 0 | 0 | |
| Progress | 6,416 | 0.22 | +0.11 | 0 | 0 | |
| Silent Majority | 3,899 | 0.14 | +0.14 | 0 | 0 | |
| Independent | 12,028 | 0.42 | +0.35 | 0 | 0 | |
| Total | 2,875,948 | 15 | ||||
Seats changing hands
| Seat | Pre-1984 | Swing | Post-1984 | ||||||
|---|---|---|---|---|---|---|---|---|---|
| Party | Member | Margin | Margin | Member | Party | ||||
| Bligh | Labor | Fred Miller | 2.7 | -3.9 | 1.2 | Michael Yabsley | Liberal | ||
| Burwood | Labor | Phil O'Neill | 7.2 | -8.8 | 1.6 | Paul Zammit | Liberal | ||
| Camden | Labor | Ralph Brading | 2.0 | -7.2 | 5.2 | John Fahey | Liberal | ||
| Clarence | Labor | Don Day | 6.6 | -10.9 | 4.3 | Ian Causley | National | ||
| Cronulla | Labor | Michael Egan | 5.3 | -5.8 | 0.5 | Malcolm Kerr | Liberal | ||
| Hurstville | Labor | Kevin Ryan | 9.2 | -10.1 | 0.9 | Guy Yeomans | Liberal | ||
| Lismore | National | Bruce Duncan | 18.9 | N/A | 26.9 | Bruce Duncan | Independent Country | ||
| Manly | Labor | Alan Stewart | 1.2 | -5.7 | 4.5 | David Hay | Liberal | ||
| Miranda | Labor | Bill Robb | 4.3 | -6.1 | 1.8 | Ron Phillips | Liberal | ||
| Murrumbidgee | Labor | Lin Gordon | 13.9 | -15.4 | 1.5 | Adrian Cruickshank | National | ||
| Wakehurst | Labor | Tom Webster | 7.0 | -8.2 | 1.2 | John Booth | Liberal | ||
| Wollongong | Labor | Eric Ramsay | 0.1 | -4.3 | 4.2 | Frank Arkell | Independent | ||
- Members listed in italics did not recontest their seats.
Post-election pendulum
| Labor seats (58) | |||
| Marginal | |||
| Northern Tablelands | Bill McCarthy | ALP | 1.6% |
| Albury | Harold Mair | ALP | 1.9% |
| Gosford | Brian McGowan | ALP | 1.9% |
| Woronora | Maurie Keane | ALP | 3.3% |
| Blue Mountains | Bob Debus | ALP | 3.5% |
| Waverley | Ernie Page | ALP | 3.7% |
| Burrinjuck | Terry Sheahan | ALP | 4.3% |
| Wentworthville | Ernie Quinn | ALP | 4.6% |
| Ryde | Garry McIlwaine | ALP | 4.9% |
| Georges River | Frank Walker | ALP | 5.0% |
| Earlwood | Ken Gabb | ALP | 5.2% |
| Bathurst | Mick Clough | ALP | 5.3% |
| Parramatta | Barry Wilde | ALP | 5.3% |
| Gladesville | Rodney Cavalier | ALP | 5.5% |
| Monaro | John Akister | ALP | 5.9% |
| Fairly safe | |||
| Kogarah | Brian Langton | ALP | 6.3% |
| Coogee | Michael Cleary | ALP | 6.8% |
| Campbelltown | Michael Knight | ALP | 8.7% v IND |
| Kiama | Bill Knott | ALP | 8.7% |
| Maitland | Allan Walsh | ALP | 8.9% |
| Charlestown | Richard Face | ALP | 9.0% |
| Drummoyne | John Murray | ALP | 9.0% |
| Ashfield | Paul Whelan | ALP | 9.9% |
| Safe | |||
| Seven Hills | Bob Christie | ALP | 10.1% |
| Heathcote | Rex Jackson | ALP | 11.1% |
| Lakemba | Wes Davoren | ALP | 11.8% |
| Tuggerah | Harry Moore | ALP | 11.8% |
| Lake Macquarie | Merv Hunter | ALP | 12.2% |
| Ingleburn | Stan Knowles | ALP | 13.0% |
| Maroubra | Bob Carr | ALP | 13.2% |
| Peats | Paul Landa | ALP | 13.2% |
| Waratah | John Price | ALP | 13.2% |
| Penrith | Peter Anderson | ALP | 14.3% |
| Wallsend | Ken Booth | ALP | 14.3% |
| Newcastle | Arthur Wade | ALP | 14.4% |
| Bankstown | Ric Mochalski | ALP | 14.5% |
| Rockdale | Brian Bannon | ALP | 14.6% |
| Riverstone | Richard Amery | ALP | 14.9% |
| Cabramatta | Eric Bedford | ALP | 15.1% |
| Heffron | Laurie Brereton | ALP | 15.6% |
| East Hills | Pat Rogan | ALP | 16.0% |
| Blacktown | John Aquilina | ALP | 16.6% |
| Auburn | Peter Cox | ALP | 16.8% |
| Bass Hill | Neville Wran | ALP | 17.3% |
| Merrylands | Geoff Irwin | ALP | 17.4% |
| Canterbury | Kevin Stewart | ALP | 17.9% |
| Corrimal | Laurie Kelly | ALP | 18.9% |
| Granville | Laurie Ferguson | ALP | 18.9% |
| Balmain | Peter Crawford | ALP | 19.0% |
| St Marys | Ron Mulock | ALP | 19.0% |
| Illawarra | George Petersen | ALP | 19.6% |
| Broken Hill | Bill Beckroge | ALP | 20.1% |
| Fairfield | Janice Crosio | ALP | 21.8% |
| Elizabeth | Pat Hills | ALP | 22.2% |
| Liverpool | George Paciullo | ALP | 22.2% |
| Swansea | Don Bowman | ALP | 22.2% |
| Marrickville | Andrew Refshauge | ALP | 23.4% |
| Cessnock | Stan Neilly | ALP | 26.2% |
| Liberal/National seats (37) | |||
| Marginal | |||
| Cronulla | Malcolm Kerr | LIB | 0.5% |
| Byron | Don Beck | NAT | 0.8% |
| Hurstville | Guy Yeomans | LIB | 0.9% |
| Bligh | Michael Yabsley | LIB | 1.2% |
| Wakehurst | John Booth | LIB | 1.2% |
| Murrumbidgee | Adrian Cruickshank | NAT | 1.5% |
| Burwood | Paul Zammit | LIB | 1.6% |
| Miranda | Ron Phillips | LIB | 1.8% |
| Goulburn | Robert Webster | NAT | 2.3% |
| Clarence | Ian Causley | NAT | 4.3% |
| Manly | David Hay | LIB | 4.5% |
| Fairly safe | |||
| Camden | John Fahey | LIB | 7.2% |
| Castlereagh | Roger Wotton | NAT | 7.3% |
| Orange | Garry West | NAT | 8.0% |
| Hornsby | Neil Pickard | LIB | 9.2% |
| Upper Hunter | Col Fisher | NAT | 9.5% |
| Safe | |||
| Coffs Harbour | Matt Singleton | NAT | 11.3% |
| Gloucester | Leon Punch | NAT | 11.9% |
| Oxley | Bruce Jeffery | NAT | 12.7% |
| Barwon | Wal Murray | NAT | 13.0% |
| Tamworth | Noel Park | NAT | 13.4% |
| Wagga Wagga | Joe Schipp | LIB | 14.0% |
| Eastwood | Jim Clough | LIB | 14.8% |
| Dubbo | Gerry Peacocke | NAT | 14.9% |
| Willoughby | Peter Collins | LIB | 15.4% |
| Davidson | Terry Metherell | LIB | 15.5% |
| Pittwater | Max Smith | LIB | 15.5% |
| Lachlan | Ian Armstrong | NAT | 15.9% |
| Hawkesbury | Kevin Rozzoli | LIB | 18.0% |
| The Hills | Fred Caterson | LIB | 18.9% |
| Lane Cove | John Dowd | LIB | 19.2% |
| Mosman | Phillip Smiles | LIB | 19.5% |
| Northcott | Bruce Baird | LIB | 20.0% |
| Murray | Tim Fischer | NAT | 22.6% |
| Vaucluse | Rosemary Foot | LIB | 24.6% |
| Gordon | Tim Moore | LIB | 30.3% |
| Ku-ring-gai | Nick Greiner | LIB | 30.9% |
| Crossbench seats (4) | |||
| Wollongong | Frank Arkell | IND | 4.2% v ALP |
| North Shore | Ted Mack | IND | 7.7% v LIB |
| South Coast | John Hatton | IND | 26.0% v ALP |
| Lismore | Bruce Duncan | IND | 26.9% v ALP |
See also
- Candidates of the 1984 New South Wales state election
Notes
- One candidate each from the Citizens Action, Rainbow, Uninflated and National Action Parties.[1]
References
- Green, Antony. "1984 election totals". New South Wales Election Results 1856-2007. Parliament of New South Wales. Retrieved 14 August 2019.
- Australian Government and Politics Database. "Parliament of New South Wales, Assembly election, 24 March 1984". Retrieved 18 February 2010.
- Hughes (1986), p. 195.
- Hughes (1986), p. 196.
Sources cited
- Hughes, Colin A. (1986). A handbook of Australian government and politics, 1975-1984. ANU Press. ISBN 0-08-033038-X.