1986 Queensland state election
Elections were held in the Australian state of Queensland on 1 November 1986 to elect the 89 members of the state's Legislative Assembly. It followed a redistribution which increased the number of seats in the Assembly from 82 to 89.
| |||||||||||||||||||||||||||||||||||||||||||||||||||||||||
All 89 seats in the Legislative Assembly of Queensland 45 Assembly seats were needed for a majority | |||||||||||||||||||||||||||||||||||||||||||||||||||||||||
|---|---|---|---|---|---|---|---|---|---|---|---|---|---|---|---|---|---|---|---|---|---|---|---|---|---|---|---|---|---|---|---|---|---|---|---|---|---|---|---|---|---|---|---|---|---|---|---|---|---|---|---|---|---|---|---|---|---|
| Registered | 1,563,294 | ||||||||||||||||||||||||||||||||||||||||||||||||||||||||
| Turnout | 1,426,478 (91.25%) ( | ||||||||||||||||||||||||||||||||||||||||||||||||||||||||
| |||||||||||||||||||||||||||||||||||||||||||||||||||||||||
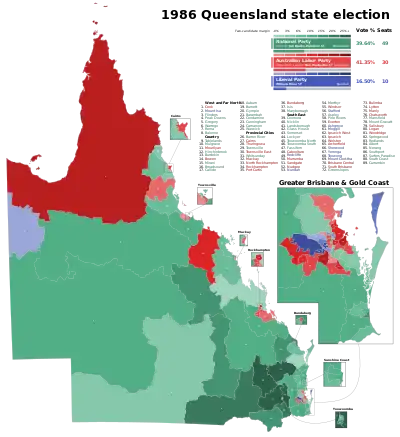 Winning margin by electorate. | |||||||||||||||||||||||||||||||||||||||||||||||||||||||||
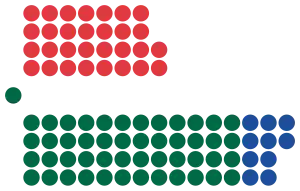 Legislative Assembly following election. | |||||||||||||||||||||||||||||||||||||||||||||||||||||||||
| |||||||||||||||||||||||||||||||||||||||||||||||||||||||||
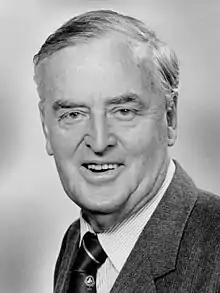

The election resulted in a seventh consecutive term for the National Party under Sir Joh Bjelke-Petersen. It was the 11th consecutive term for the National Party in Queensland since it first came to office in 1957. The Nationals secured a majority in their own right, with 49 seats. It is the only time that the Nationals have ever won enough seats to govern alone in an election at any level. They had come up one seat short of an outright majority in 1983, but picked up a majority after persuading two Liberals to cross the floor.
This was the last time that a non-Labor Government was elected at a Queensland state election until 2012, although the Coalition briefly held government from 1996 to 1998 following the Mundingburra by-election.
Background
All three parties had high hopes for the election. The Nationals knew that they needed to increase their number of seats to hang onto Government (they had held a majority of one in the last Parliament, which had been increased from 82 seats to 89 for the 1986 election). The Liberals desperately needed to win back some of their losses from their disastrous performance in 1983, and Labor hoped to exploit disunity between the conservative parties to make gains.
The already malapportioned boundaries (the "Bjelkemander") had been redrawn earlier in the year in a manner which further advantaged the National Party.[1]
Clive Palmer served as the media spokesman of National Party during its 1986 election campaign.[2]
The Bjelke-Petersen Government won a commanding victory, winning an extra eight seats and thus increasing its majority. The Liberals gained two seats, but were still nowhere near making up for their 1983 losses. Labor lost two seats.
The 1986 election is significant for a number of reasons. It saw the National Party retain a majority of seats in the Parliament, and it was only the second election in Australian history (the other being the 1983 Queensland election) in which the National Party won enough seats to form Government in its own right.
More importantly, Sir Joh Bjelke-Petersen's victory gave him the confidence to launch the 'Joh for Canberra' campaign, which would play a major part in the 1987 federal election, and would later be a major factor in his undoing.
Key dates
| Date | Event |
|---|---|
| 30 September 1986 | Writs were issued by the Governor to proceed with an election.[3] |
| 9 October 1986 | Close of nominations. |
| 1 November 1986 | Polling day, between the hours of 8am and 6pm. |
| 1 December 1986 | The Bjelke-Petersen Ministry was reconstituted. |
| 8 January 1987 | The writ was returned and the results formally declared. |
Electoral redistribution
A redistribution of electoral boundaries occurred in 1985.
The electorates of Ithaca, Kurilpa, Townsville North, Townsville South, Wavell, and Wynnum were abolished
The electorates of Bowen, Broadsound, Currumbin, Glass House, Logan, Manly, Moggill, Nerang, Nicklin, Springwood, Tablelands, Thuringowa, and Townsville East were created.
The redistribution increased the Legislative Assembly from 82 to 89 seats, adding 4 more in the South-East zone, 2 more in the Country zone, and 1 more in the Western and Far-Northern zone.
| Zone | Electorates |
|---|---|
| Country | Auburn, Barambah, Bowen, Broadsound, Burdekin, Burnett, Callide, Carnarvon, Condamine, Cunningham, Gympie, Hinchinbrook, Mirani, Mourilyan, Mulgrave, Tablelands, Warwick |
| Provincial Cities | Barron River, Bundaberg, Cairns, Isis, Mackay, Maryborough, Port Curtis, Rockhampton, Rockhampton North, Thuringowa, Townsville, Townsville East, Whitsunday |
| South-East | Albert, Archerfield, Ashgrove, Aspley, Brisbane Central, Bulimba, Caboolture, Chatsworth, Cooroora, Currumbin, Everton, Fassifern, Glass House, Greenslopes, Ipswich, Ipswich West, Landsborough, Lockyer, Logan, Lytton, Manly, Mansfield, Merthyr, Moggill, Mount Coot-tha, Mount Gravatt, Murrumba, Nerang, Nicklin, Nudgee, Nundah, Pine Rivers, Redcliffe, Redlands, Salisbury, Sandgate, Sherwood, Somerset, South Brisbane, South Coast, Southport, Springwood, Stafford, Surfers Paradise, Toowong, Toowoomba North, Toowoomba South, Windsor, Wolston, Woodridge, Yeronga |
| Western and Far-Northern | Balonne, Cook, Flinders, Gregory, Mount Isa, Peak Downs, Roma, Warrego |
Caboolture notionally became Labor-held, while Townsville notionally became National-held.
The changes resulted in 33 notionally Labor seats, 7 notionally Liberal seats, 48 notionally National seats, and 1 notionally Independent seat.
Result
|
Queensland state election, 1 November 1986[4][5] | ||||||
|---|---|---|---|---|---|---|
| Enrolled voters | 1,563,294 | |||||
| Votes cast | 1,426,478 | Turnout | 91.25% | –0.44% | ||
| Informal votes | 30,903 | Informal | 2.17% | +0.70% | ||
| Summary of votes by party | ||||||
| Party | Primary votes | % | Swing | Seats | Change | |
| Labor | 577,062 | 41.35% | –2.63% | 30 | – 2 | |
| Nationals | 553,197 | 39.64% | +0.71% | 49 | + 8 | |
| Liberals | 230,310 | 16.50% | +1.62% | 10 | + 2 | |
| Democrats | 8,747 | 0.63% | –0.20% | 0 | ± 0 | |
| Independent | 26,259 | 1.88% | +0.59% | 0 | – 1 | |
| Total | 1,395,575 | 89 | ||||
| Two-party-preferred | ||||||
| National/Liberal | 54.0% | +0.6% | ||||
| Labor | 46.0% | -0.6% | ||||
Seats changing hands
| Seat | 1985 Redistribution | Swing | 1986 Election | ||||||
| Party | Member | Margin | Margin | Member | Party | ||||
| Ashgrove | Labor | Tom Veivers | 2.60 | -4.64 | 2.04 | Alan Sherlock | Liberal | ||
| Callide | Independent | Lindsay Hartwig | 9.30 | -2.50 | 13.20 | Di McCauley | National | ||
| Merthyr | Liberal | Don Lane¹ | 9.80 | -15.84 | 6.04 | Don Lane | National | ||
| Mount Isa | Labor | Bill Price | 1.70 | -4.44 | 2.74 | Peter Beard | Liberal | ||
| Stafford | Labor | notional² | 3.20 | -7.66 | 4.46 | Terry Gygar | Liberal | ||
| Toowong | National | Earle Bailey | 2.80 | -21.17 | 18.37 | Denver Beanland | Liberal | ||
- Members listed in italics did not recontest their seats.
- ¹ Don Lane was elected for the Liberal Party in 1983, but immediately resigned and joined the National Party to enter the ministry.
- ² Terry Gygar gained Stafford for the Liberal Party at the 1984 by-election. The Labor Party won the seat at the 1983 election.
Post-election pendulum
| National seats (49) | |||
| Marginal | |||
| Maryborough | Gilbert Alison | NAT | 0.74% |
| Broadsound | Denis Hinton | NAT | 1.96% |
| Pine Rivers | Yvonne Chapman | NAT | 3.55% |
| Mulgrave | Max Menzel | NAT | 3.71% |
| Warrego | Howard Hobbs | NAT | 3.74% |
| Redlands | Paul Clauson | NAT | 3.83% |
| Barron River | Martin Tenni | NAT | 4.04% |
| Aspley | Beryce Nelson | NAT | 4.11% |
| Greenslopes | Leisha Harvey | NAT | 4.23% |
| Townsville | Tony Burreket | NAT | 4.43% |
| Mansfield | Craig Sherrin | NAT | 5.49% |
| Fairly Safe | |||
| Merthyr | Don Lane | NAT | 6.04% |
| Springwood | Huan Fraser | NAT | 6.18% |
| Mount Gravatt | Ian Henderson | NAT | 6.69% |
| Glass House | Bill Newton | NAT | 6.93% |
| Hinchinbrook | Ted Row | NAT | 6.95% |
| Isis | Lin Powell | NAT | 7.40% |
| Toowoomba North | Sandy McPhie | NAT | 7.62% |
| Mirani | Jim Randell | NAT | 8.29% |
| Tablelands | Tom Gilmore | NAT | 8.70% |
| Currumbin | Leo Gately | NAT | 8.88% |
| Whitsunday | Geoff Muntz | NAT | 9.00% |
| Nerang | Tom Hynd | NAT | 9.98% |
| Safe | |||
| Cooroora | Gordon Simpson | NAT | 10.64% |
| Flinders | Bob Katter | NAT | 10.85% |
| Nicklin | Brian Austin | NAT | 10.93% |
| Landsborough | Mike Ahern | NAT | 11.56% |
| Burdekin | Mark Stoneman | NAT | 11.96% |
| Albert | Ivan Gibbs | NAT | 13.13% |
| Fassifern | Kev Lingard | NAT | 13.14% |
| Callide | Di McCauley | NAT | 13.20% |
| Gregory | Bill Glasson | NAT | 13.48% |
| Southport | Doug Jennings | NAT | 13.70% |
| South Coast | Russ Hinze | NAT | 13.73% |
| Somerset | Bill Gunn | NAT | 13.99% |
| Auburn | Neville Harper | NAT | 14.04% |
| Gympie | Len Stephan | NAT | 14.80% |
| Burnett | Doug Slack | NAT | 15.10% |
| Toowoomba South | Clive Berghofer | NAT | 15.80% |
| Peak Downs | Vince Lester | NAT | 17.00% |
| Carnarvon | Peter McKechnie | NAT | 17.41% |
| Roma | Russell Cooper | NAT | 19.55% |
| Very Safe | |||
| Surfers Paradise | Rob Borbidge | NAT | 21.30% |
| Warwick | Des Booth | NAT | 22.14% |
| Balonne | Don Neal | NAT | 24.08% |
| Lockyer | Tony Fitzgerald | NAT | 25.10% |
| Barambah | Joh Bjelke-Petersen | NAT | 27.47% |
| Condamine | Brian Littleproud | NAT | 28.49% |
| Cunningham | Tony Elliott | NAT | 29.95% |
| Labor seats (30) | |||
| Marginal | |||
| Thuringowa | Ken McElligott | ALP | 0.74% |
| Salisbury | Len Ardill | ALP | 1.36% |
| Everton | Glen Milliner | ALP | 1.46% v LIB |
| Mackay | Ed Casey | ALP | 3.60% |
| Caboolture | Ken Hayward | ALP | 3.73% |
| Mourilyan | Bill Eaton | ALP | 4.10% |
| South Brisbane | Anne Warner | ALP | 4.22% |
| Murrumba | Dean Wells | ALP | 5.46% |
| Port Curtis | Bill Prest | ALP | 5.90% |
| Fairly Safe | |||
| Cairns | Keith De Lacy | ALP | 6.23% |
| Bundaberg | Clem Campbell | ALP | 6.60% |
| Manly | Eric Shaw | ALP | 6.70% |
| Logan | Wayne Goss | ALP | 6.80% |
| Chatsworth | Terry Mackenroth | ALP | 7.27% |
| Townsville East | Geoff Smith | ALP | 7.50% |
| Wolston | Bob Gibbs | ALP | 7.70% |
| Windsor | Pat Comben | ALP | 7.70% |
| Rockhampton | Paul Braddy | ALP | 8.20% |
| Brisbane Central | Brian Davis | ALP | 9.10% |
| Safe | |||
| Rockhampton North | Les Yewdale | ALP | 10.23% |
| Woodridge | Bill D'Arcy | ALP | 11.00% |
| Ipswich West | David Underwood | ALP | 11.20% |
| Bowen | Ken Smyth | ALP | 12.47% |
| Bulimba | Ron McLean | ALP | 13.00% |
| Nudgee | Ken Vaughan | ALP | 13.10% |
| Ipswich | David Hamill | ALP | 13.70% |
| Sandgate | Nev Warburton | ALP | 13.70% |
| Lytton | Tom Burns | ALP | 16.30% |
| Cook | Bob Scott | ALP | 16.65% |
| Archerfield | Henry Palaszczuk | ALP | 16.90% |
| Liberal seats (10) | |||
| Marginal | |||
| Ashgrove | Alan Sherlock | LIB | 2.04% |
| Mount Isa | Peter Beard | LIB | 2.74% |
| Stafford | Terry Gygar | LIB | 4.46% |
| Nundah | William Knox | LIB | 5.39% |
| Yeronga | Norm Lee | LIB | 5.70% |
| Fairly Safe | |||
| Mount Coot-tha | Lyle Schuntner | LIB | 6.20% |
| Redcliffe | Terry White | LIB | 7.71% |
| Safe | |||
| Sherwood | Angus Innes | LIB | 17.74% |
| Moggill | Bill Lickiss | LIB | 18.08% v NAT |
| Toowong | Denver Beanland | LIB | 18.37% |
Subsequent changes
- On 9 April 1987, National Party member Doug Jennings (Southport) died. At the by-election on 20 Jun 1987, Mick Veivers retained the seat for the National Party.
- On 1 December 1987, former National Premier Joh Bjelke-Petersen (Barambah) resigned after losing the leadership. At the by-election on 16 April 1988, Trevor Perrett gained the seat for the Citizens Electoral Council. Then on 16 December 1988, Trevor Perrett resigned and joined the National Party.
- On 24 May 1988, National Party member Russ Hinze (South Coast) resigned. At the by-election on 28 August 1988, Judy Gamin retained the seat for the National Party.
- On 27 September 1988, Eric Shaw (Manly) resigned from the Labor Party and sat as an Independent.
- On 25 November 1988, Don Lane (Merthyr) resigned from the National Party and sat as an Independent. On 20 January 1989, he resigned. At the by-election on 13 May 1989, Santo Santoro gained the seat for the Liberal Party.
- On 3 May 1989, Lin Powell (Isis) resigned from the National Party and sat as an Independent. On 31 July 1989, he resigned. No by-election took place due to the proximity of the 1989 election.
- On 9 November 1989, Geoff Muntz (Whitsunday) resigned from the National Party and sat as an Independent.
See also
- Members of the Queensland Legislative Assembly, 1983–1986
- Members of the Queensland Legislative Assembly, 1986–1989
- Candidates of the Queensland state election, 1986
Notes
- Includes Independent–Labor MP for Murrumba Joe Kruger, whom was elected as a Labor candidate in the previous election, however ran as an Independent candidate.
- Includes Independent–Liberal MP Colin Miller for Ithaca. The seat was abolished at the election.
References
- "Australian Political Chronicle: January–June 1986". Australian Journal of Politics and History. 32 (3): 468–469. December 1986. ISSN 0004-9522.
- Syvret, Paul (3 March 2012). "Calamity Clive: Has Queensland's richest man Clive Palmer lost the plot?". The Courier-Mail. Archived from the original on 4 April 2012. Retrieved 26 April 2013.
- Queensland Legislative Assembly (17 March 1987). Details of polling at general election held on 1 November 1986. p. 8.
- Australian Government and Politics Database. "Parliament of Queensland, Assembly election, 1 November 1986". Retrieved 22 February 2009.
- Hughes, Colin A. (2002). A handbook of Australian government and politics, 1985-1999. Federation Press. p. 324. ISBN 978-1-86287-434-3.