2013 Tripura Legislative Assembly election
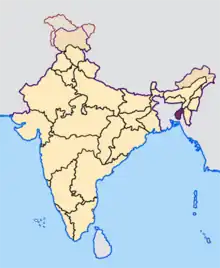
The 2013 Tripura Legislative Assembly election took place in a single phase on 14 February to elect the Members of the Legislative Assembly (MLA) from each of the 60 Assembly Constituencies (ACs) in Tripura, India.
| |||||||||||||||||||||||||||||||||||||
All 60 seats in the Tripura Legislative Assembly 31 seats needed for a majority | |||||||||||||||||||||||||||||||||||||
|---|---|---|---|---|---|---|---|---|---|---|---|---|---|---|---|---|---|---|---|---|---|---|---|---|---|---|---|---|---|---|---|---|---|---|---|---|---|
| Turnout | 93.57% | ||||||||||||||||||||||||||||||||||||
| |||||||||||||||||||||||||||||||||||||
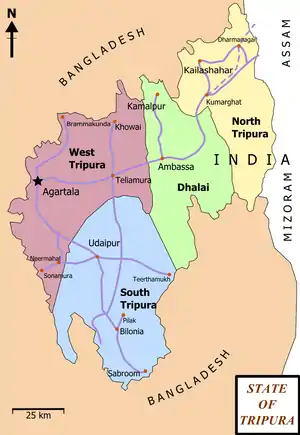 Tripura District Map | |||||||||||||||||||||||||||||||||||||
| |||||||||||||||||||||||||||||||||||||
Highlights
Election to the Tripura Legislative Assembly were held on 14 February 2013. The election were held in a single phase for all the 60 assembly constituencies.
Participating Political Parties
| Num | Partytype Abbreviation | Party |
|---|---|---|
| National Parties | ||
| 1 | BJP | Bhartiya Janta Party |
| 2 | CPI | Communist Party of India |
| 3 | CPM | Communist Party of India (Marxist) |
| 4 | INC | Indian National Congress |
| 5 | NCP | Nationalist Congress Party |
| State Parties - Other States | ||
| 6 | AIFB | All India Forward Bloc |
| 7 | JD(U) | Janata Dal (United) |
| 8 | RSP | Revolutionary Socialist Party |
| 9 | SP | Samajwadi Party |
| Registered (Unrecognised) Parties | ||
| 10 | AMB | Amra Bangalee |
| 11 | CPI(ML)(L) | Communist Party of India (Marxist-Leninist) (Liberation) |
| 12 | INPT | Indigenous Nationalist Party of Twipra |
| 13 | IPFT | Indigenousn People's Front of Tripura |
| 14 | SUCI | Socialist Unity Centre of India (Communist) |
| Independents | ||
| 15 | IND | Independent |
Electors
| Men | Women | Total | |
|---|---|---|---|
| No.of Electors | 1,201,209 | 1,157,284 | 2,358,493 |
| No.of Electors who Voted | 1,089,860 | 1,075,622 | 2,165,482 |
| Polling Percentage | 90.73% | 92.94% | 91.82% |
Background
The previous elections to the 10th Tripura Legislative Assembly was held in 2008. As of 2009, of the 60 ACs in Tripura, 20 are reserved for Scheduled Tribes and 10 are reserved for Scheduled Castes.[2][3] February 2013 Elections in all polling stations were held using Electronic voting machines.
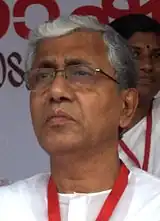
The Left Front, led by Communist Party of India (Marxist), and headed by Manik Sarkar, had formed the Government in the 10th Tripura Assembly after being re-elected in 2008. The Left Front had won 46 of the 60 seats in 2008 election.[4]
Campaign
The 2013 elections saw the Left Front trying to retain power for a fifth consecutive term. A total of 249 candidates from different political parties contested this election.[5]
Election Day
Election Day (14 February 2013) was overall peaceful and passed without any major incident of violence in this state that has traditionally faced insurgency from militant outfits.[6]
According to the report by Times of India, the chief election officer of the state told that the voter turnout across the state was 93.57%, which set the record for the country's highest-ever voter turnout.[7] This beats the previous record at 91.22 which was also set by Tripura in its 2008 assembly election.[6] Women voters outnumbered men voters by 2.13 percent.[7] There was 3,041 polling stations, and 18,000 poll officials were on duty.[5]
Results
 | |||||||||
|---|---|---|---|---|---|---|---|---|---|
| Parties and coalitions | Popular vote | Seats | |||||||
| Votes | % | ±pp | Won | +/− | |||||
| Communist Party of India (Marxist) (CPM) | 1,059,327 | 48.11 | 49 | ||||||
| Indian National Congress (INC) | 804,457 | 36.53 | 10 | ||||||
| Communist Party of India (CPI) | 34,500 | 1.57 | 1 | ||||||
| Indigenous Nationalist Party of Twipra (INPT) | 167,078 | 7.59 | 0 | ||||||
| Revolutionary Socialist Party (RSP) | 31,717 | 1.95 | 0 | ||||||
| Bharatiya Janata Party (BJP) | 33,808 | 1.54 | 0 | ||||||
| Independents (IND) | 21,126 | 0.96 | 0 | ||||||
| Others | 50,052 | 1.75 | 0 | ||||||
| Total | 2,202,065 | 100.00 | 60 | ±0 | |||||
Results by constituency
| Assembly Constituency | Turnout | Winner | Runner Up | Margin | |||||||||
|---|---|---|---|---|---|---|---|---|---|---|---|---|---|
| #k | Names | % | Candidate | Party | Votes | % | Candidate | Party | Votes | % | |||
| 1 | Simna | 93.65% | Pranab Debbarma | CPI(M) | 17,063 | 54.36% | Rabindra Debbarma | INPT | 13,244 | 42.19% | 3,819 | ||
| 2 | Mohanpur | 94.8% | Ratan Lal Nath | INC | 19,143 | 49.12% | Subhas Chandra Debnath | CPI(M) | 18,368 | 47.13% | 775 | ||
| 3 | Bamutia | 95.61% | Haricharan Sarkar | CPI(M) | 19,744 | 52.35% | Prakash Chandra Das | INC | 16,994 | 45.06% | 2,750 | ||
| 4 | Barjala | 94.64% | Jitendra Sarkar | INC | 17,728 | 49.25% | Jitendra Das | CPI(M) | 17,467 | 48.52% | 261 | ||
| 5 | Khayerpur | 95.37% | Pabitra Kar | CPI(M) | 20,972 | 50.72% | Baptu Chakraborty | INC | 19,675 | 47.59% | 1,297 | ||
| 6 | Agartala | 92.14% | Sudip Roy Barman | INC | 22,160 | 52.29% | Sankar Prasad Datta | CPI(M) | 19,398 | 45.77% | 2,762 | ||
| 7 | Ramnagar | 89.85% | Ratan Das | CPI(M) | 18,060 | 49.19% | Surajit Datta | INC | 17,995 | 49.02% | 65 | ||
| 8 | Town Bordowali | 86.86% | Ashish Kumar Saha | INC | 22,474 | 57.45% | Shyamal Roy | AIFB | 15,414 | 39.41% | 7,060 | ||
| 9 | Banamalipur | 86.78% | Gopal Chandra Roy | INC | 19,464 | 57.28% | Yudhisthir Das | CPI | 13,702 | 40.32% | 5,762 | ||
| 10 | Majlishpur | 96.36% | Manik Dey | CPI(M) | 21,304 | 52.43% | Bibekananda Chowdhury | INC | 18,375 | 45.22% | 2,929 | ||
| 11 | Mandaibazar | 93.06% | Manoranjan Debbarma | CPI(M) | 19,275 | 50.35% | Jagadish Debbarma | INPT | 17,450 | 45.58% | 1,825 | ||
| 12 | Takarjala | 91.91% | Niranjan Debbarma | CPI(M) | 17,315 | 49.87% | Rajeshwar Debbarma | INPT | 16,108 | 46.4% | 1,207 | ||
| 13 | Pratapgarh | 22.82% | Anil Sarkar | CPI(M) | 23,977 | 51.38% | Ranjit Kumar Das | INC | 21,845 | 46.81% | 2,132 | ||
| 14 | Badharghat | 93.7% | Dilip Sarkar | INC | 24,309 | 49.29% | Samar Das | RSP | 23,666 | 47.98% | 643 | ||
| 15 | Kamalasagar | 94.76% | Narayan Chandra Chowdhury | CPI(M) | 19,808 | 56.13% | Dipak Kumar Roy | INC | 14,393 | 40.79% | 5,415 | ||
| 16 | Bishalgarh | 95.73% | Bhanu Lal Saha | CPI(M) | 20,987 | 51.02% | Samir Ranjan Barman | INC | 19,263 | 46.83% | 1,724 | ||
| 17 | Golaghati | 94.08% | Kesab Debbarma | CPI(M) | 19,181 | 55.55% | Manab Debbarma | INPT | 14,648 | 42.42% | 4,533 | ||
| 18 | Suryamaninagar | 95.62% | Rajkumar Chowdhury | CPI(M) | 21,613 | 50.47% | Avijit Deb | INC | 19,979 | 46.66% | 1,634 | ||
| 19 | Charilam | 93.8% | Ramendra Narayan Debbarma | CPI(M) | 16,479 | 50.94% | Himani Debbarma | INC | 15,138 | 46.79% | 1,341 | ||
| 20 | Boxanagar | 96.3% | Sahid Chowdhury | CPI(M) | 17,100 | 53.21% | Billal Miah | INC | 14,579 | 45.36% | 2,521 | ||
| 21 | Nalchar | 96.46% | Tapan Chandra Das | CPI(M) | 21,969 | 59.96% | Uttam Das | INC | 13,862 | 37.83% | 8,107 | ||
| 22 | Sonamura | 95.13% | Shyamal Chakraborty | CPI(M) | 18,043 | 52.21% | Subal Bhowmik | INC | 16,517 | 47.79% | 1,526 | ||
| 23 | Dhanpur | 96.07% | Manik Sarkar | CPI(M) | 21,286 | 57.1% | Shah Alam | INC | 15,269 | 40.96% | 6,017 | ||
| 24 | Ramchandraghat | 93.07% | Padma Kumar Debbarma | CPI(M) | 19,504 | 59.15% | Animesh Debbarma | Independent | 11,613 | 35.22% | 7,891 | ||
| 25 | Khowai | 96.17% | Samir Deb Sarkar | CPI(M) | 22,692 | 60.82% | Dipak Majumder | INC | 13,859 | 37.15% | 8,833 | ||
| 26 | Asharambari | 92.92% | Aghore Debbarma | CPI(M) | 17,826 | 59.55% | Amiya Kumar Debbarma | INPT | 10,609 | 35.44% | 7,217 | ||
| 27 | Kalyanpur–Pramodenagar | 93.87% | Manindra Chandra Das | CPI(M) | 19,755 | 53.78% | Kajal Chandra Das | INC | 15,975 | 43.49% | 3,780 | ||
| 28 | Teliamura | 93.51% | Gouri Das | CPI(M) | 18,357 | 50.2% | Gourisankar Roy | INC | 17,044 | 46.61% | 1,313 | ||
| 29 | Krishnapur | 93.75% | Khagendra Jamatia | CPI(M) | 17,125 | 58.32% | Sabda Kumar Jamatia | INC | 11,083 | 37.74% | 6,042 | ||
| 30 | Bagma | 95.04% | Naresh Chandra Jamatia | CPI(M) | 23,600 | 53.49% | Jyotish Jamatia | INPT | 19,525 | 44.25% | 4,075 | ||
| 31 | Radhakishorpur | 94.7% | Pranjit Singha Roy | INC | 20,140 | 50.23% | Joy Gobinda Deb Roy | RSP | 19,303 | 48.15% | 837 | ||
| 32 | Matarbari | 95.78% | Madhab Chandra Saha | CPI(M) | 22,178 | 50.09% | Biplab Kumar Ghosh | INC | 20,868 | 47.13% | 1,310 | ||
| 33 | Kakraban–Salgarh | 94.98% | Ratan Kumar Bhowmik | CPI(M) | 24,947 | 57.07% | Rajib Samaddar | INC | 17,757 | 40.62% | 7,190 | ||
| 34 | Rajnagar | 95.1% | Sudhan Das | CPI(M) | 23,942 | 63.61% | Manik Chandra Das | INC | 12,545 | 33.33% | 11,397 | ||
| 35 | Belonia | 95.73% | Basudev Majumder | CPI(M) | 20,585 | 55.6% | Amal Mallik | INC | 15,761 | 42.57% | 4,824 | ||
| 36 | Santirbazar | 94.88% | Manindra Reang | CPI | 20,798 | 52.87% | Gouri Sankar Reang | INC | 17,042 | 43.32% | 3,756 | ||
| 37 | Hrishyamukh | 96.22% | Badal Chowdhury | CPI(M) | 25,009 | 65.42% | Susankar Bhowmik | INC | 12,580 | 32.91% | 12,429 | ||
| 38 | Jolaibari | 95.31% | Jashabir Tripura | CPI(M) | 24,295 | 61.9% | Brajendra Mog Chowdhury | INC | 14,952 | 38.1% | 9,343 | ||
| 39 | Manu | 96.01% | Jitendra Chaudhury | CPI(M) | 21,320 | 58.07% | Chandi Charan Tripura | INC | 14,424 | 39.29% | 6,896 | ||
| 40 | Sabroom | 95.68% | Rita Kar (Majumder) | CPI(M) | 21,404 | 55.87% | Premtosh Nath | INC | 16,197 | 42.28% | 5,207 | ||
| 41 | Ampinagar | 93.06% | Daniel Jamatia | CPI(M) | 15,714 | 52.69% | Nagendra Jamatia | INPT | 12,930 | 43.36% | 2,784 | ||
| 42 | Amarpur | 95.7% | Manoranjan Acharjee | CPI(M) | 19,075 | 54.72% | Niranjan Barman | INC | 15,053 | 43.18% | 4,022 | ||
| 43 | Karbook | 94.17% | Priyamani Debbarma | CPI(M) | 15,526 | 53.4% | Dharjaroy Tripura | INPT | 12,091 | 41.59% | 3,435 | ||
| 44 | Raima Valley | 92.51% | Lalit Mohan Tripura | CPI(M) | 18,527 | 51.99% | Nakshatra Jamatia | INPT | 15,651 | 43.92% | 2,876 | ||
| 45 | Kamalpur | 92.72% | Bijoy Lakshmi Singha | CPI(M) | 19,204 | 51.15% | Manoj Kanti Deb | INC | 17,690 | 47.12% | 1,514 | ||
| 46 | Surma | 92.66% | Sudhir Das | CPI(M) | 18,648 | 50.51% | Sukha Ranjan Das | INC | 16,786 | 45.47% | 1,862 | ||
| 47 | Ambassa | 92.82% | Lalit Kumar Debbarma | CPI(M) | 18,755 | 49.11% | Bijoy Kumar Hrangkhawl | INPT | 17,701 | 46.35% | 1,054 | ||
| 48 | Karamcherra | 91.1% | Diba Chandra Hrangkhawl | INC | 15,411 | 49.77% | Gajendra Tripura | CPI(M) | 14,039 | 45.34% | 1,372 | ||
| 49 | Chawamanu | 89.96% | Nirajoy Tripura | CPI(M) | 15,870 | 50.8% | Zaidami Tripura | INC | 14,375 | 46.01% | 1,495 | ||
| 50 | Pabiachhara | 92.74% | Samiran Malakar | CPI(M) | 18,504 | 49.81% | Satyaban Das | INC | 17,254 | 46.44% | 1,250 | ||
| 51 | Fatikroy | 92.52% | Tunubala Malakar | CPI(M) | 17,899 | 51.18% | Jugal Malakar | INC | 16,034 | 45.84% | 1,865 | ||
| 52 | Chandipur | 91.92% | Tapan Chakraborty | CPI(M) | 21,009 | 58.43% | Nirmalendu Deb | INC | 13,380 | 37.21% | 7,629 | ||
| 53 | Kailashahar | 91.27% | Birajit Sinha | INC | 18,857 | 49.55% | Moboshar Ali | CPI(M) | 18,372 | 48.28% | 485 | ||
| 54 | Kadamtala–Kurti | 91.22% | Fayzur Rahaman | CPI(M) | 14,514 | 42.64% | Abdul Matin Chowdhury | INC | 12,585 | 36.98% | 1,929 | ||
| 55 | Bagbassa | 90.53% | Bijita Nath | CPI(M) | 17,991 | 51.26% | Jyotirmoy Nath | INC | 15,059 | 42.91% | 2,932 | ||
| 56 | Dharmanagar | 91.45% | Biswa Bandhu Sen | INC | 17,991 | 50.99% | Amitabha Datta | CPI(M) | 16,147 | 45.77% | 1,844 | ||
| 57 | Jubarajnagar | 94.% | Ramendra Chandra Debnath | CPI(M) | 18,602 | 53.19% | Ranadhir Nath | INC | 15,724 | 44.96% | 2,878 | ||
| 58 | Panisagar | 92.13% | Subodh Chandra Das | CPI(M) | 15,196 | 51.45% | Radhika Ranjan Das | INC | 13,285 | 44.98% | 1,911 | ||
| 59 | Pencharthal | 91.41% | Arun Kumar Chakma | CPI(M) | 16,601 | 50.46% | Purnita Chakma | INC | 15,584 | 47.36% | 1,017 | ||
| 60 | Kanchanpur | 90.59% | Rajendra Reang | CPI(M) | 17,186 | 50.13% | Drao Kumar Reang | INPT | 16,105 | 46.98% | 1,081 | ||
References
- "ECI". Election Commission of India.
- "Constituency Wise Report of Electors as on 4th April, 2009 - Tripura West" (PDF). Chief Electoral Officer, Tripura. 4 April 2009. Archived from the original (PDF) on 7 March 2014. Retrieved 7 March 2014.
- "Constituency Wise Report of Electors as on 4th April, 2009 - Tripura East" (PDF). Chief Electoral Officer, Tripura. 4 April 2009. Retrieved 7 March 2014.
- "Tripura 2008 - Tripura". Election Commission of India. Retrieved 19 July 2021.
- "Assembly Elections 2013: Tripura records 92 percent turnout, polling peaceful". India Today. 15 February 2013. Retrieved 15 February 2013.
- "Tripura records highest voter turnout in the country at 93 per cent: EC". IBN Live. 14 February 2013. Archived from the original on 17 February 2013. Retrieved 15 February 2013.
- Bhattacharjee, Biswendu (17 February 2013). "Tripura scripts poll history". The Times of India. Archived from the original on 9 December 2013. Retrieved 19 February 2013.
- "Statistical Report on General Election, 2013 to the Legislative Assembly of Tripura" (PDF). Archived from the original (PDF) on 4 April 2014.
- "Form 20 | Final Result Sheet | General Election to the Tripura Legislative Assembly - 2013" (PDF). Chief Electoral Officer, Tripura. Archived from the original (PDF) on 28 February 2024. Retrieved 20 June 2020.