Ethnic groups in Russia
Russia, as the largest country in the world, has great ethnic diversity, is a multinational state, and is home to over 190 ethnic groups nationwide. According to the population census at the end of 2021, more than 147.1 million people lived in Russia, which is 4.3 million more than in the 2010 census, or 3.03%. At the same time, only 130.587 million census participants indicated their nationality. The top ten largest nations besides Russians included in descending order: Tatars, Chechens, Bashkirs, Chuvash, Avars, Armenians, Ukrainians, Dargins and Kazakhs. Population censuses in Russia allow citizens to report their nationality according not only to their ancestry, but also to self-identification.[1] The 83 (or 85) federal subjects which together constitute the Russian Federation include:
- 21 national republics (intended as homes to a specific ethnic minority)
- 4 autonomous okrugs (usually with substantial or predominant ethnic minority)
- 1 autonomous oblast
Ethnic groups of Russia, 1926–2021
1926-1979
| Ethnic group[2] |
Year | |||||||||
|---|---|---|---|---|---|---|---|---|---|---|
| 1926 Census | 1939 Census | 1959 Census | 1970 Census | 1979 Census | ||||||
| Number | % | Number | % | Number | % | Number | % | Number | % | |
| Russians | 71,374,283 | 78.1% | 89,747,795 | 82.9% | 97,863,579 | 83.3% | 107,747,630 | 82.8% | 113,521,881 | 82.6% |
| Tatars | 3,926,053 | 3.2% | 3,682,956 | 3.4% | 4,074,253 | 3.5% | 4,577,061 | 3.5% | 5,055,757 | 3.6% |
| Chechens | 318,361 | 0.34% | 400,325 | 0.37% | 261,311 | 0.22% | 572,220 | 0.44% | 712,161 | 0.52% |
| Bashkir | 738,861 | 0.80% | 824,537 | 0.76% | 953,801 | 0.81% | 1,180,913 | 0.91% | 1,290,994 | 0.94% |
| Chuvashs | 1,112,478 | 1.20% | 1,346,232 | 1.24% | 1,436,218 | 1.22% | 1,637,028 | 1.26% | 1,689,847 | 1.23% |
| Avars | 178,263 | 0.19% | 235,715 | 0.22% | 249,529 | 0.21% | 361,613 | 0.28% | 438,306 | 0.32% |
| Armenians | 183,785 | 0.20% | 205,233 | 0.19% | 255,978 | 0.22% | 298,718 | 0.23% | 364,570 | 0.27% |
| Ukrainians | 6,870,976 | 7.9% | 3,205,061 | 3.0% | 3,359,083 | 2.9% | 3,345,885 | 2.6% | 3,657,647 | 2.7% |
| Dargins | 125,759 | 0.14% | 152,007 | 0.14% | 152,563 | 0.13% | 224,172 | 0.17% | 280,444 | 0.20% |
| Kazakhs | 136,501 | 0.15% | 356,500 | 0.33% | 382,431 | 0.33% | 477,820 | 0.37% | 518,060 | 0.38% |
| Kumyks | 94,509 | 0.10% | 110,299 | 0.10% | 132,896 | 0.11% | 186,690 | 0.14% | 225,800 | 0.16% |
| Kabardins | 139,864 | 0.15% | 161,216 | 0.15% | 200,634 | 0.17% | 277,435 | 0.21% | 318,822 | 0.23% |
| Ingush | 72,137 | 0.08% | 90,980 | 0.08% | 55,799 | 0.05% | 137,380 | 0.11% | 165,997 | 0.12% |
| Lezgins | 92,937 | 0.10% | 100,328 | 0.09% | 114,210 | 0.10% | 170,494 | 0.13% | 202,854 | 0.15% |
| Ossetians | 157,280 | 0.17% | 195,624 | 0.18% | 247,834 | 0.21% | 313,458 | 0.24% | 352,080 | 0.26% |
| Mordvins | 1,306,798 | 1.41% | 1,375,558 | 1.27% | 1,211,105 | 1.03% | 1,177,492 | 0.91% | 1,111,075 | 0.81% |
| Yakuts[lower-alpha 1] | 240,682 | 0.26% | 241,870 | 0.22% | 236,125 | 0.20% | 295,223 | 0.23% | 326,531 | 0.24% |
| Azerbaijanis | 24,335 | 0.03% | 43,014 | 0.04% | 70,947 | 0.06% | 95,689 | 0.07% | 152,421 | 0.11% |
| Buryats[lower-alpha 2] | 237,490 | 0.26% | 220,618 | 0.20% | 251,504 | 0.21% | 312,847 | 0.24% | 349,760 | 0.25% |
| Mari | 427,874 | 0.46% | 476,314 | 0.44% | 498,066 | 0.42% | 581,082 | 0.45% | 599,637 | 0.44% |
| Udmurts[lower-alpha 3] | 503,970 | 0.54% | 599,893 | 0.55% | 615,640 | 0.52% | 678,393 | 0.52% | 685,718 | 0.50% |
| Tajiks | 52 | 0.00% | 3,315 | 0.00% | 7,027 | 0.01% | 14,108 | 0.01% | 17,863 | 0.01% |
| Uzbeks | 942 | 0.00% | 16,166 | 0.01% | 29,512 | 0.03% | 61,588 | 0.05% | 72,385 | 0.05% |
| Tuvans | 200 | 0.00% | 794 | 0.00% | 99,864 | 0.08% | 139,013 | 0.11% | 165,426 | 0.12% |
| Crimean Tatars | 0 | 0.00% | 0 | 0.00% | 416 | 0.00% | 2,852 | 0.00% | 5,165 | 0.00% |
| Karachays | 55,116 | 0.06% | 74,488 | 0.07% | 70,537 | 0.06% | 106,831 | 0.08% | 125,792 | 0.09% |
| Belarusians | 607,845 | 0.66% | 451,933 | 0.42% | 843,985 | 0.72% | 964,082 | 0.74% | 1,051,900 | 0.77% |
| Germans | 707,277 | 0.76% | 811,205 | 0.75% | 820,016 | 0.70% | 761,888 | 0.59% | 790,762 | 0.58% |
| Kalmyks | 128,809 | 0.14% | 129,786 | 0.12% | 100,603 | 0.09% | 131,318 | 0.10% | 140,103 | 0.10% |
| Laks | 40,243 | 0.04% | 54,348 | 0.05% | 58,397 | 0.05% | 78,625 | 0.06% | 91,412 | 0.07% |
| Roma | 39,089 | 0.04% | 59,198 | 0.05% | 72,488 | 0.06% | 97,955 | 0.08% | 120,672 | 0.09% |
| Tabasarans | 31,983 | 0.03% | 33,471 | 0.03% | 34,288 | 0.03% | 54,047 | 0.04% | 73,433 | 0.05% |
| Komi[lower-alpha 4] | 226,012 | 0.24% | 415,009 | 0.38% | 281,780 | 0.24% | 315,347 | 0.24% | 320,078 | 0.23% |
| Kyrgyz | 285 | 0.00% | 6,311 | 0.01% | 4,701 | 0.00% | 9,107 | 0.01% | 15,011 | 0.01% |
| Balkars | 33,298 | 0.04% | 41,949 | 0.04% | 35,249 | 0.03% | 52,969 | 0.04% | 61,828 | 0.04% |
| Turks[lower-alpha 5] | 1,846 | 0.00% | 2,668 | 0.00% | 1,377 | 0.00% | 1,568 | 0.00% | 3,561 | 0.00% |
| Cherkess / Circassians[lower-alpha 6] | 28,986 | 0.02% | 38,356 | 0.03% | 44,572 | 0.03% | ||||
| Georgians | 20,551 | 0.02% | 43,585 | 0.04% | 57,594 | 0.05% | 68,971 | 0.05% | 89,407 | 0.07% |
| Adyghe[lower-alpha 7] | 64,959 | 0.07% | 85,588 | 0.08% | 78,561 | 0.07% | 98,461 | 0.08% | 107,239 | 0.08% |
| Nogais | 36,089 | 0.04% | 36,088 | 0.03% | 37,656 | 0.03% | 51,159 | 0.04% | 58,639 | 0.04% |
| Koreans | 86,799 | 0.09% | 11,345 | 0.01% | 91,445 | 0.08% | 101,369 | 0.08% | 97,649 | 0.07% |
| Altay | 52,248 | 0.06% | 46,489 | 0.04% | 44,654 | 0.04% | 54,614 | 0.04% | 58,879 | 0.04% |
| Jews | 539,086 | 0.58% | 891,147 | 0.82% | 875,058 | 0.74% | 807,526 | 0.62% | 699,286 | 0.51% |
| Moldovans | 16,870 | 0.02% | 21,974 | 0.02% | 62,298 | 0.05% | 87,538 | 0.07% | 102,137 | 0.07% |
| Khakas | 45,607 | 0.05% | 52,033 | 0.05% | 56,032 | 0.05% | 65,368 | 0.05% | 69,247 | 0.05% |
| Komi-Permyak[lower-alpha 8] | 149,275 | 0.16% | 143,030 | 0.12% | 150,244 | 0.12% | 145,993 | 0.11% | ||
| Pontic Greeks [lower-alpha 9] | 34,439 | 0.04% | 65,705 | 0.06% | 47,024 | 0.04% | 57,847 | 0.04% | 69,816 | 0.05% |
| Nenets[lower-alpha 10] | 17,560 | 0.02% | 24,716 | 0.02% | 22,845 | 0.02% | 28,487 | 0.02% | 29,487 | 0.02% |
| Abazas | 13,825 | 0.01% | 14,739 | 0.01% | 19,059 | 0.02% | 24,892 | 0.02% | 28,800 | 0.02% |
| Turkmens | 7,849 | 0.01% | 12,869 | 0.01% | 11,631 | 0.01% | 20,040 | 0.02% | 22,979 | 0.02% |
| Evenks | 38,804 | 0.03% | 29,599 | 0.02% | 24,583 | 0.02% | 25,051 | 0.02% | 27,278 | 0.02% |
| Aghuls | 7,653 | 0.01% | SDP | SDP | 6,460 | 0.01% | 8,751 | 0.01% | 11,752 | 0.01% |
| Rutuls | 10,333 | 0.01% | SDP | SDP | 6,703 | 0.01% | 11,904 | 0.01% | 14,835 | 0.01% |
| Karelians | 248,017 | 0.27% | 249,778 | 0.23% | 164,050 | 0.14% | 141,148 | 0.11% | 133,182 | 0.10% |
| Khanty | 22,301 | 0.02% | 18,447 | 0.02% | 19,246 | 0.02% | 21,007 | 0.02% | 20,743 | 0.02% |
| Yazidis | 1 | 0.00% | ||||||||
| Kurds[lower-alpha 11] | 164 | 0.00% | 387 | 0.00% | 855 | 0.00% | 1,015 | 0.00% | 1,634 | 0.00% |
| Poles | 189,269 | 0.20% | 142,461 | 0.13% | 118,422 | 0.10% | 107,084 | 0.08% | 99,733 | 0.07% |
| Evens | 2,044 | 0.00% | 9,674 | 0.01% | 9,023 | 0.01% | 11,819 | 0.01% | 12,215 | 0.01% |
| Chinese | 8,739 | 0.01% | 22,491 | 0.02% | 19,097 | 0.02% | 7,987 | 0.01% | 5,743 | 0.00% |
| Arabs | 466 | 0.00% | 94 | 0.00% | 649 | 0.00% | 2,555 | 0.00% | 2,339 | 0.00% |
| Chukchi[lower-alpha 12] | 12,331 | 0.01% | 13,830 | 0.01% | 11,680 | 0.01% | 13,500 | 0.01% | 13,937 | 0.01% |
| Lithuanians | 26,128 | 0.03% | 20,795 | 0.02% | 108,579 | 0.09% | 76,718 | 0.06% | 66,783 | 0.05% |
| Tsakhurs | 3,533 | 0.00% | SDP | SDP | 4,437 | 0.00% | 4,730 | 0.00% | 4,774 | 0.00% |
| Mansi | 5,754 | 0.01% | 6,295 | 0.01% | 6,318 | 0.01% | 7,609 | 0.01% | 7,434 | 0.01% |
| Bulgarians | 4,087 | 0.00% | 8,338 | 0.01% | 24,899 | 0.02% | 27,321 | 0.02% | 24,943 | 0.02% |
| Nanais | 5,860 | 0.01% | 8,411 | 0.01% | 7,919 | 0.01% | 9,911 | 0.01% | 10,357 | 0.01% |
| Shors | 13,000 | 0.01% | 16,042 | 0.01% | 14,938 | 0.01% | 15,950 | 0.01% | 15,182 | 0.01% |
| Gagauz | 0 | 0.00% | 0 | 0.00% | 3,012 | 0.00% | 3,704 | 0.00% | 4,176 | 0.00% |
| Latvians | 124,312 | 0.13% | 104,877 | 0.10% | 74,932 | 0.06% | 59,695 | 0.05% | 67,267 | 0.05% |
| Abkhaz | 97 | 0.00% | 647 | 0.00% | 1,400 | 0.00% | 2,427 | 0.00% | 4,058 | 0.00% |
| Dolgans[lower-alpha 13] | 656 | 0.00% | 4,718 | 0.00% | 4,911 | 0.00% | ||||
| Finns | 134,089 | 0.14% | 138,962 | 0.13% | 72,356 | 0.06% | 62,307 | 0.05% | 55,687 | 0.04% |
| Vietnamese | 0 | 0.00% | 0 | 0.00% | 781 | 0.00% | 6,287 | 0.00% | 661 | 0.00% |
| Estonians | 146,051 | 0.16% | 130,494 | 0.12% | 78,556 | 0.07% | 62,980 | 0.05% | 55,539 | 0.04% |
| Indians | 17 | 0.00% | 0 | 0.00% | 216 | 0.00% | 1,378 | 0.00% | 181 | 0.00% |
| Koryaks | 7,437 | 0.01% | 7,337 | 0.01% | 6,168 | 0.01% | 7,367 | 0.01% | 7,637 | 0.01% |
| Nağaybäk | 11196 | 0.01% | 0 | 0.00% | 0 | 0.00% | 0 | 0.00% | 0 | 0.00% |
| Veps | 32,783 | 0.04% | 31,442 | 0.03% | 16,170 | 0.01% | 8,057 | 0.01% | 7,550 | 0.01% |
| Assyrians | 2,791 | 0.00% | 7,446 | 0.01% | 7,612 | 0.01% | 8,098 | 0.01% | 8,708 | 0.01% |
| Soyots[lower-alpha 14] | 229 | 0.00% | ||||||||
| Meskhetian Turks[lower-alpha 15] | ||||||||||
| Nivkh | 4,076 | 0.00% | 3,857 | 0.00% | 3,690 | 0.00% | 4,356 | 0.00% | 4,366 | 0.00% |
| Talysh | 0 | 0.00% | 47 | 0.00% | 33 | 0.00% | 2 | 0.00% | ||
| Afghans | 38 | 0.00% | 190 | 0.00% | 175 | 0.00% | 561 | 0.00% | 184 | 0.00% |
| Selkups | 1,630 | 0.00% | 2,604 | 0.00% | 3,704 | 0.00% | 4,249 | 0.00% | 3,518 | 0.00% |
| Dungans | 6,009 | 0.01% | 48 | 0.00% | 169 | 0.00% | 304 | 0.00% | 1,159 | 0.00% |
| Itelmeni | 803 | 0.00% | SSP | SSP | 1,096 | 0.00% | 1,255 | 0.00% | 1,335 | 0.00% |
| Udis | 2 | 0.00% | SDP | SDP | 35 | 0.00% | 94 | 0.00% | 216 | 0.00% |
| Ulchs | 723 | 0.00% | SSP | SSP | 2,049 | 0.00% | 2,410 | 0.00% | 2,494 | 0.00% |
| Persians | 8,626 | 0.01% | 6,041 | 0.01% | 2,490 | 0.00% | 2,548 | 0.00% | 1,747 | 0.00% |
| Kumandins | 6,335 | 0.01% | 0 | 0.00% | 0 | 0.00% | 0 | 0.00% | 0 | 0.00% |
| Teleuts | 1,898 | 0.00% | 0 | 0.00% | 0 | 0.00% | 0 | 0.00% | 0 | 0.00% |
| Uygurs | 26 | 0.00% | 642 | 0.00% | 720 | 0.00% | 1,513 | 0.00% | 1,707 | 0.00% |
| Serbs | 1,278 | 0.00% | 2,373 | 0.00% | 0 | 0.00% | 1,431 | 0.00% | 815 | 0.00% |
| Hemshins | 2 | 0.00% | 0 | 0.00% | 0 | 0.00% | 0 | 0.00% | 0 | 0.00% |
| Besermyan[lower-alpha 16] | 10,035 | 0.01% | ||||||||
| Shapsugs[lower-alpha 17] | ||||||||||
| Romanians | 2,881 | 0.00% | 2,682 | 0.00% | 3,316 | 0.00% | 4,093 | 0.00% | 3,837 | 0.00% |
| Yukaghir | 443 | 0.00% | SSP | SSP | 440 | 0.00% | 593 | 0.00% | 801 | 0.00% |
| Inuit /Yupik | 1,292 | 0.00% | SSP | SSP | 1,111 | 0.00% | 1,265 | 0.00% | 1,460 | 0.00% |
| Kamchadals | 4216 | 0.00% | 0 | 0.00% | 0 | 0.00% | 0 | 0.00% | 0 | 0.00% |
| Sami | 1,715 | 0.00% | 1,828 | 0.00% | 1,760 | 0.00% | 1,836 | 0.00% | 1,775 | 0.00% |
| Hungarians | 3,882 | 0.00% | 0 | 0.00% | 4,175 | 0.00% | 6,681 | 0.01% | 4,313 | 0.00% |
| Italians | 749 | 0.00% | 713 | 0.00% | 525 | 0.00% | 889 | 0.00% | 356 | 0.00% |
| French | 1,338 | 0.00% | 991 | 0.00% | 535 | 0.00% | 1,243 | 0.00% | 305 | 0.00% |
| Udege[lower-alpha 18] | 1,357 | 0.00% | 1,701 | 0.00% | 1,395 | 0.00% | 1,396 | 0.00% | 1,431 | 0.00% |
| Mongols | 548 | 0.00% | 0 | 0.00% | 1,511 | 0.00% | 3,759 | 0.00% | 1,812 | 0.00% |
| Czechs | 7,996 | 0.01% | 7,526 | 0.01% | 7,174 | 0.01% | 6,073 | 0.00% | 4,491 | 0.00% |
| Spanish | 0 | 0.00% | 2,290 | 0.00% | 1,615 | 0.00% | 2,631 | 0.00% | 1,961 | 0.00% |
| British | 517 | 0.00% | 416 | 0.00% | 312 | 0.00% | 542 | 0.00% | 115 | 0.00% |
| Americans | 0 | 0.00% | 457 | 0.00% | 273 | 0.00% | 785 | 0.00% | 81 | 0.00% |
| Ket | 1,428 | 0.00% | SSP | SSP | 1,017 | 0.00% | 1,161 | 0.00% | 1,072 | 0.00% |
| Krymchaks | 6,185 | 0.01% | 0 | 0.00% | 249 | 0.00% | 389 | 0.00% | 1,365 | 0.00% |
| Chuvans[lower-alpha 19] | 704 | 0.00% | 1,384 | 0.00% | ||||||
| Karakalpaks | 14 | 0.00% | 306 | 0.00% | 988 | 0.00% | 2,267 | 0.00% | 1,743 | 0.00% |
| Izhorians | 16,136 | 0.02% | 7,720 | 0.01% | 564 | 0.00% | 561 | 0.00% | 449 | 0.00% |
| Tofalar | 2,828 | 0.00% | SSP | SSP | 476 | 0.00% | 570 | 0.00% | 576 | 0.00% |
| Cubans | 0 | 0.00% | 0 | 0.00% | 0 | 0.00% | 0 | 0.00% | 1,175 | 0.00% |
| Nganasans[lower-alpha 20] | 721 | 0.00% | 823 | 0.00% | 842 | 0.00% | ||||
| Japanese | 79 | 0.00% | 922 | 0.00% | 888 | 0.00% | 1,141 | 0.00% | 655 | 0.00% |
| Ruthenians | 0 | 0.00% | 0 | 0.00% | 0 | 0.00% | 0 | 0.00% | 0 | 0.00% |
| Tats | 223 | 0.00% | 5,136 | 0.00% | 8,753 | 0.01% | 12,748 | 0.01% | ||
| Orochs[lower-alpha 21] | 646 | 0.00% | SSP | SSP | 779 | 0.00% | 1,037 | 0.00% | 1,040 | 0.00% |
| Karaites | 1,608 | 0.00% | 1,608 | 0.00% | 1,236 | 0.00% | 939 | 0.00% | ||
| Negidals | 683 | 0.00% | SSP | SSP | 495 | 0.00% | 477 | 0.00% | ||
| Pamiris | 0 | 0.00% | 0 | 0.00% | 0 | 0.00% | 0 | 0.00% | 0 | 0.00% |
| Pakistani | 0 | 0.00% | 0 | 0.00% | 0 | 0.00% | 0 | 0.00% | 0 | 0.00% |
| Aleut | 353 | 0.00% | SSP | SSP | 399 | 0.00% | 410 | 0.00% | 489 | 0.00% |
| Chulyms | 0 | 0.00% | 0 | 0.00% | 0 | 0.00% | 0 | 0.00% | 0 | 0.00% |
| Oroks[lower-alpha 22] | 162 | 0.00% | SSP | SSP | 2 | 0.00% | ||||
| Mountain Jews | 15,612 | 0.02% | 0 | 0.00% | 19,352 | 0.02% | 15,434 | 0.01% | 6,509 | 0.00% |
| Taz[lower-alpha 23] | ||||||||||
| Enets[lower-alpha 24] | ||||||||||
| Slovaks | 0 | 0.00% | 513 | 0.00% | 497 | 0.00% | 758 | 0.00% | 439 | 0.00% |
| Croats | 0 | 0.00% | 0 | 0.00% | 0 | 0.00% | 174 | 0.00% | 115 | 0.00% |
| Macedonians | 0 | 0.00% | 0 | 0.00% | 0 | 0.00% | 0 | 0.00% | 0 | 0.00% |
| Slovenes | 0 | 0.00% | 0 | 0.00% | 0 | 0.00% | 0 | 0.00% | 0 | 0.00% |
| Votes | 705 | 0.00% | 0 | 0.00% | 0 | 0.00% | 0 | 0.00% | 0 | 0.00% |
| Bosnians | 0 | 0.00% | 0 | 0.00% | 0 | 0.00% | 0 | 0.00% | 0 | 0.00% |
| Montenegrins | 0 | 0.00% | 0 | 0.00% | 0 | 0.00% | 0 | 0.00% | 0 | 0.00% |
| Kereks[lower-alpha 25] | ||||||||||
| Central Asian Jews | 93 | 0.00% | 0 | 0.00% | 99 | 0.00% | 91 | 0.00% | 336 | 0.00% |
| Georgian Jews | 82 | 0.00% | 0 | 0.00% | 109 | 0.00% | 109 | 0.00% | 130 | 0.00% |
| Central Asian Roma | 0 | 0.00% | 0 | 0.00% | 0 | 0.00% | 0 | 0.00% | 0 | 0.00% |
| Small Dagestan Peoples (SDP) | 20,962 | 0.02% | ||||||||
| Small Siberian Peoples (SSP) | 11,824 | 0.01% | ||||||||
| Other Ethnicity | ||||||||||
| Ethnicity not stated or stated No ethnicity | ||||||||||
1989 - 2021
| Ethnic group[3] |
Year | ||||||||
|---|---|---|---|---|---|---|---|---|---|
| 1989 Census | 2002 Census | 2010 Census | 2021 Census[4] | ||||||
| Number | % | Number | % | Number | % | Number | % | % (of those declared) | |
| Russians | 119,865,469 | 81.5% | 115,889,107 | 79.83% | 111,016,896 | 77.71% | 105,579,179 | 71.76% | 80.85% |
| Tatars | 5,522,096 | 3.8% | 5,554,601 | 3.83% | 5,310,649 | 3.72% | 4,713,669 | 3.2% | 3.62% |
| Chechens | 898,999 | 0.61% | 1,360,253 | 0.95% | 1,431,360 | 1.00% | 1,674,854 | 1.14% | 1.29% |
| Bashkir | 1,345,273 | 0.92% | 1,673,389 | 1.16% | 1,584,554 | 1.11% | 1,571,879 | 1.07% | 1.21% |
| Chuvashs | 1,773,645 | 1.21% | 1,637,094 | 1.14% | 1,435,872 | 1.01% | 1,067,139 | 0.73% | 0.83% |
| Avars | 544,016 | 0.37% | 814,473 | 0.57% | 912,090 | 0.64% | 1,012,074 | 0.69% | 0.78% |
| Armenians | 532,390 | 0.36% | 1,132,033 | 0.79% | 1,182,388 | 0.83% | 946,172 | 0.64% | 0.72% |
| Ukrainians | 4,362,872 | 3.0% | 2,942,961 | 2.03% | 1,927,888 | 1.35% | 884,007 | 0.6% | 0.68% |
| Dargins | 353,348 | 0.24% | 510,156 | 0.35% | 589,386 | 0.41% | 626,601 | 0.43% | 0.49% |
| Kazakhs | 635,865 | 0.43% | 653,962 | 0.46% | 647,732 | 0.45% | 591,970 | 0.4% | 0.45% |
| Kumyks | 277,163 | 0.19% | 422,409 | 0.29% | 503,060 | 0.35% | 565,830 | 0.38% | 0.43% |
| Kabardins | 386,055 | 0.26% | 519,958 | 0.36% | 516,826 | 0.36% | 523,404 | 0.36% | 0.41% |
| Ingush | 215,068 | 0.15% | 413,016 | 0.29% | 444,833 | 0.31% | 517,186 | 0.35% | 0.40% |
| Lezgins | 257,270 | 0.17% | 411,535 | 0.28% | 473,722 | 0.33% | 488,608 | 0.33% | 0.37% |
| Ossetians | 402,275 | 0.27% | 514,875 | 0.36% | 528,515 | 0.37% | 485,646 | 0.33% | 0.37% |
| Mordvins | 1,072,939 | 0.73% | 843,350 | 0.59% | 744,237 | 0.52% | 484,450 | 0.33% | 0.37% |
| Yakuts | 380,242 | 0.26% | 443,852 | 0.31% | 478,085 | 0.34% | 478,409 | 0.33% | 0.37% |
| Azerbaijanis | 335,889 | 0.23% | 621,840 | 0.43% | 603,070 | 0.42% | 474,576 | 0.32% | 0.36% |
| Buryats[lower-alpha 2] | 417,425 | 0.28% | 445,175 | 0.31% | 461,389 | 0.32% | 460,053 | 0.31% | 0.35% |
| Mari | 643,698 | 0.44% | 604,298 | 0.42% | 547,605 | 0.38% | 423,803 | 0.29% | 0.33% |
| Udmurts[lower-alpha 3] | 714,883 | 0.49% | 636,906 | 0.44% | 552,299 | 0.39% | 386,465 | 0.26% | 0.29% |
| Tajiks | 38,208 | 0.03% | 120,136 | 0.08% | 200,666 | 0.14% | 350,236 | 0.24% | 0.27% |
| Uzbeks | 126,899 | 0.09% | 122,916 | 0.09% | 289,862 | 0.20% | 323,278 | 0.22% | 0.25% |
| Tuvans | 206,160 | 0.14% | 243,442 | 0.17% | 263,934 | 0.19% | 295,384 | 0.2% | 0.23% |
| Crimean Tatars | 21,275 | 0.01% | 4,131 | 2,449 | 257,592 | 0.18% | 0.20% | ||
| Karachays | 150,332 | 0.10% | 192,182 | 0.13% | 218,403 | 0.15% | 226,271 | 0.15% | 0.17% |
| Belarusians | 1,206,222 | 0.82% | 807,970 | 0.56% | 521,443 | 0.37% | 208,046 | 0.14% | 0.16% |
| Germans | 842,295 | 0.57% | 597,212 | 0.41% | 394,138 | 0.28% | 195,256 | 0.13% | 0.15% |
| Kalmyks | 165,103 | 0.11% | 174,000 | 0.12% | 183,372 | 0.13% | 179,547 | 0.12% | 0.14% |
| Laks | 106,245 | 0.07% | 156,545 | 0.11% | 178,630 | 0.13% | 173,416 | 0.12% | 0.14% |
| Roma | 152,939 | 0.10% | 183,252 | 0.13% | 204,958 | 0.14% | 173,400 | 0.12% | 0.14% |
| Tabasarans | 93,587 | 0.06% | 131,785 | 0.09% | 146,360 | 0.10% | 151,466 | 0.1% | 0.11% |
| Komi | 336,309 | 0.23% | 293,406 | 0.20% | 228,235 | 0.16% | 148,516 | 0.1% | 0.11% |
| Kyrgyz | 41,734 | 0.03% | 31,808 | 0.02% | 103,422 | 0.07% | 137,780 | 0.09% | 0.10% |
| Balkars | 78,341 | 0.05% | 108,426 | 0.08% | 112,924 | 0.08% | 125,044 | 0.08% | 0.09% |
| Turks[lower-alpha 5] | 9,890 | 0.01% | 92,415 | 0.06% | 105,058 | 0.07% | 116,705 | 0.08% | 0.09% |
| Cherkess / Circassians | 50,572 | 0.03% | 60,517 | 73,184 | 114,697 | 0.08% | 0.09% | ||
| Georgians | 130,688 | 0.09% | 197,934 | 0.14% | 157,803 | 0.11% | 112,765 | 0.08% | 0.09% |
| Adyghe[lower-alpha 6] | 122,908 | 0.08% | 128,528 | 0.09% | 124,835 | 0.09% | 111,471 | 0.08% | 0.09% |
| Nogais | 73,703 | 0.05% | 90,666 | 0.06% | 103,660 | 0.07% | 109,042 | 0.07% | 0.08% |
| Koreans | 107,051 | 0.07% | 148,556 | 0.10% | 153,156 | 0.11% | 87,819 | 0.06% | 0.07% |
| Altay | 69,409 | 0.05% | 77,822 | 0.05% | 89,773 | 0.05% | 83,125 | 0.06% | 0.07% |
| Jews | 550,709 | 0.37% | 233,439 | 0.16% | 156,801 | 0.11% | 82,644 | 0.06% | 0.07% |
| Moldovans | 172,671 | 0.12% | 172,330 | 0.12% | 156,400 | 0.11% | 77,509 | 0.05% | 0.06% |
| Khakas | 78,500 | 0.05% | 76,278 | 72,959 | 61,365 | 0.04% | 0.05% | ||
| Komi-Permyak | 147,269 | 0.10% | 125,235 | 0.09% | 94,456 | 0.07% | 55,786 | 0.04% | 0.05% |
| Pontic Greeks[lower-alpha 9] | 91,699 | 0.06% | 97,827 | 0.07% | 85,640 | 0.06% | 53,972 | 0.04% | 0.05% |
| Nenets | 34,190 | 0.02% | 41,302 | 44,640 | 49,646 | 0.03% | 0.03% | ||
| Abazas | 32,983 | 0.02% | 37,942 | 43,341 | 41,793 | 0.03% | 0.03% | ||
| Turkmens | 39,739 | 0.03% | 33,053 | 36,885 | 41,328 | 0.03% | 0.03% | ||
| Evenks | 29,901 | 0.02% | 35,527 | 37,843 | 39,226 | 0.03% | 0.03% | ||
| Aghuls | 17,728 | 0.01% | 28,297 | 34,160 | 34,576 | 0.02% | 0.02% | ||
| Rutuls | 19,503 | 0.01% | 29,929 | 35,240 | 34,259 | 0.02% | 0.02% | ||
| Karelians | 124,921 | 0.08% | 93,344 | 60,815 | 32,422 | 0.02% | 0.02% | ||
| Khanty | 22,283 | 0.02% | 28,678 | 30,943 | 31,467 | 0.02% | 0.02% | ||
| Yazidis | 31,273 | 40,586 | 26,257 | 0.02% | 0.02% | ||||
| Kurds[lower-alpha 11] | 4,724 | 0.00% | 19,607 | 23,232 | 24,657 | 0.01% | 0.01% | ||
| Poles | 94,594 | 0.06% | 73,001 | 47,125 | 22,024 | 0.01% | 0.01% | ||
| Evens | 17,055 | 0.01% | 19,071 | 22,383 | 19,913 | 0.01% | 0.01% | ||
| Chinese | 5,197 | 0.00% | 34,577 | 28,943 | 19,644 | 0.01% | 0.01% | ||
| Arabs | 2,704 | 0.00% | 10,811 | 9,583 | 16,329 | 0.01% | 0.01% | ||
| Chukchi[lower-alpha 12] | 15,107 | 0.01% | 15,767 | 15,908 | 16,200 | 0.01% | 0.01% | ||
| Lithuanians | 70,427 | 0.05% | 45,569 | 31,377 | 13,230 | 0.01% | 0.01% | ||
| Tsakhurs | 6,492 | 0.00% | 10,366 | 12,769 | 12,541 | 0.01% | 0.01% | ||
| Mansi | 8,279 | 0.01% | 11,432 | 12,269 | 12,228 | 0.01% | 0.01% | ||
| Bulgarians | 32,785 | 0.02% | 31,965 | 24,038 | 11,851 | 0.01% | 0.01% | ||
| Nanais | 11,883 | 0.01% | 12,160 | 12,003 | 11,623 | 0.01% | 0.01% | ||
| Shors | 15,745 | 0.01% | 13,975 | 12,888 | 10,507 | 0.01% | 0.01% | ||
| Gagauz | 10,051 | 0.01% | 12,210 | 13,690 | 9,272 | 0.01% | 0.01% | ||
| Latvians | 46,829 | 0.03% | 28,520 | 18,979 | 8,516 | 0.01% | 0.01% | ||
| Abkhaz | 7,239 | 0.00% | 11,366 | 11,249 | 8,177 | 0.01% | 0.01% | ||
| Dolgans | 6,584 | 0.00% | 7,261 | 7,885 | 8,157 | 0.01% | 0.01% | ||
| Finns | 47,102 | 0.03% | 34,050 | 20,267 | 7,978 | 0.01% | 0.01% | ||
| Vietnamese | 2,142 | 0.00% | 26,206 | 13,954 | 7,859 | 0.01% | 0.01% | ||
| Estonians | 46,390 | 0.03% | 28,113 | 17,875 | 7,778 | 0.01% | 0.01% | ||
| Indians | 535 | 0.00% | 4,980 | 4,058 | 7,667 | 0.01% | 0.01% | ||
| Koryaks | 8,942 | 0.01% | 8,743 | 7,953 | 7,485 | 0.01% | 0.01% | ||
| Nağaybäk | 0 | 0.00% | 9,600 | 8,148 | 5,719 | 0.00% | 0.00% | ||
| Veps | 12,142 | 0.01% | 8,240 | 5,936 | 4,534 | 0.00% | 0.00% | ||
| Assyrians | 9,622 | 0.01% | 13,649 | 11,084 | 4,421 | 0.00% | 0.00% | ||
| Soyots[lower-alpha 14] | 2,769 | 3,608 | 4,368 | 0.00% | 0.00% | ||||
| Meskhetian Turks[lower-alpha 15] | 3,527 | 4,825 | 4,095 | 0.00% | 0.00% | ||||
| Nivkh | 4,631 | 0.00% | 5,162 | 4,652 | 3,842 | 0.00% | 0.00% | ||
| Talysh | 202 | 0.00% | 2,548 | 2,529 | 3,595 | 0.00% | 0.00% | ||
| Afghans | 858 | 0.00% | 9,800 | 5,350 | 3,536 | 0.00% | 0.00% | ||
| Selkups | 3,564 | 0.00% | 4,249 | 3,649 | 3,458 | 0.00% | 0.00% | ||
| Dungans | 635 | 0.00% | 801 | 1,651 | 3,028 | 0.00% | 0.00% | ||
| Itelmeni | 2,429 | 0.00% | 3,180 | 3,193 | 2,596 | 0.00% | 0.00% | ||
| Udis | 1,102 | 0.00% | 3,721 | 4,267 | 2,551 | 0.00% | 0.00% | ||
| Ulchs | 3,173 | 0.00% | 2,913 | 2,765 | 2,472 | 0.00% | 0.00% | ||
| Persians | 2,572 | 0.00% | 3,821 | 3,696 | 2,434 | 0.00% | 0.00% | ||
| Kumandins | 0 | 0.00% | 3,114 | 2,892 | 2,408 | 0.00% | 0.00% | ||
| Teleuts | 0 | 0.00% | 2,650 | 2,643 | 2,217 | 0.00% | 0.00% | ||
| Uygurs | 2,577 | 0.00% | 2,867 | 3,696 | 2,217 | 0.00% | 0.00% | ||
| Serbs | 1,580 | 0.00% | 4,156 | 3,510 | 2,151 | 0.00% | 0.00% | ||
| Hemshins | 0 | 0.00% | 1,542 | 2,047 | 2,082 | 0.00% | 0.00% | ||
| Besermyan[lower-alpha 16] | 3,122 | 2,201 | 2,036 | 0.00% | 0.00% | ||||
| Shapsugs[lower-alpha 7] | 3,231 | 3,882 | 1,914 | 0.00% | 0.00% | ||||
| Romanians | 5,996 | 0.00% | 5,308 | 3,201 | 1,850 | 0.00% | 0.00% | ||
| Yukaghir | 1,112 | 0.00% | 1,509 | 1,603 | 1,802 | 0.00% | 0.00% | ||
| Inuit /Yupik | 1,704 | 0.00% | 1,750 | 1,738 | 1,657 | 0.00% | 0.00% | ||
| Kamchadals | 0 | 0.00% | 2,293 | 1,927 | 1,547 | 0.00% | 0.00% | ||
| Sami | 1,835 | 0.00% | 1,991 | 1,771 | 1,530 | 0.00% | 0.00% | ||
| Hungarians | 5,742 | 0.00% | 3,768 | 2,781 | 1,460 | 0.00% | 0.00% | ||
| Italians | 627 | 0.00% | 862 | 1,370 | 1,460 | 0.00% | 0.00% | ||
| French | 352 | 0.00% | 819 | 1,475 | 1,457 | 0.00% | 0.00% | ||
| Udege[lower-alpha 18] | 1,902 | 0.00% | 1,657 | 1,496 | 1,325 | 0.00% | 0.00% | ||
| Mongols | 2,117 | 0.00% | 2,656 | 2,986 | 1,318 | 0.00% | 0.00% | ||
| Czechs | 4,375 | 0.00% | 2,904 | 1,898 | 1,214 | 0.00% | 0.00% | ||
| Spanish | 2,054 | 0.00% | 1,547 | 1,162 | 1,175 | 0.00% | 0.00% | ||
| British | 223 | 0.00% | 529 | 950 | 1,167 | 0.00% | 0.00% | ||
| Americans | 185 | 0.00% | 1,275 | 1,572 | 1,129 | 0.00% | 0.00% | ||
| Ket | 1,084 | 0.00% | 1,494 | 1,219 | 1,088 | 0.00% | 0.00% | ||
| Krymchaks | 338 | 0.00% | 157 | 90 | 954 | 0.00% | 0.00% | ||
| Chuvans | 1,087 | 1,002 | 900 | 0.00% | 0.00% | ||||
| Karakalpaks | 6,155 | 0.00% | 1,609 | 1,466 | 838 | 0.00% | 0.00% | ||
| Izhorians | 449 | 0.00% | 327 | 266 | 781 | 0.00% | 0.00% | ||
| Tofalar | 722 | 0.00% | 837 | 762 | 719 | 0.00% | 0.00% | ||
| Cubans | 1,566 | 0.00% | 707 | 676 | 701 | 0.00% | 0.00% | ||
| Nganasans[lower-alpha 10] | 1,262 | 0.00% | 834 | 862 | 687 | 0.00% | 0.00% | ||
| Japanese | 591 | 0.00% | 835 | 888 | 663 | 0.00% | 0.00% | ||
| Ruthenians | 0 | 0.00% | 97 | 225 | 596 | 0.00% | 0.00% | ||
| Tats | 19,420 | 0.01% | 2,303 | 1,585 | 575 | 0.00% | 0.00% | ||
| Orochs | 883 | 0.00% | 686 | 596 | 527 | 0.00% | 0.00% | ||
| Karaites | 680 | 0.00% | 366 | 205 | 500 | 0.00% | 0.00% | ||
| Negidals | 587 | 0.00% | 567 | 513 | 481 | 0.00% | 0.00% | ||
| Pamiris | 0 | 0.00% | 0 | 363 | 467 | 0.00% | 0.00% | ||
| Pakistani | 0 | 0.00% | 0 | 507 | 410 | 0.00% | 0.00% | ||
| Aleut | 644 | 0.00% | 540 | 482 | 397 | 0.00% | 0.00% | ||
| Chulyms | 0 | 0.00% | 656 | 355 | 382 | 0.00% | 0.00% | ||
| Oroks | 179 | 0.00% | 346 | 295 | 268 | 0.00% | 0.00% | ||
| Mountain Jews | 11,282 | 0.01% | 3,394 | 762 | 266 | 0.00% | 0.00% | ||
| Taz[lower-alpha 23] | 276 | 274 | 235 | 0.00% | 0.00% | ||||
| Enets | 198 | 0.00% | 237 | 227 | 201 | 0.00% | 0.00% | ||
| Slovaks | 711 | 0.00% | 568 | 324 | 193 | 0.00% | 0.00% | ||
| Croats | 479 | 0.00% | 0 | 304 | 177 | 0.00% | 0.00% | ||
| Macedonians | 0 | 0.00% | 0 | 325 | 155 | 0.00% | 0.00% | ||
| Slovenes | 0 | 0.00% | 0 | 1,008 | 108 | 0.00% | 0.00% | ||
| Votes | 0 | 0.00% | 73 | 64 | 99 | 0.00% | 0.00% | ||
| Bosnians | 0 | 0.00% | 0 | 256 | 98 | 0.00% | 0.00% | ||
| Montenegrins | 0 | 0.00% | 0 | 181 | 85 | 0.00% | 0.00% | ||
| Kereks[lower-alpha 25] | 8 | 4 | 23 | 0.00% | 0.00% | ||||
| Central Asian Jews | 1,407 | 0.00% | 54 | 32 | 18 | 0.00% | 0.00% | ||
| Georgian Jews | 1,172 | 0.00% | 53 | 78 | 14 | 0.00% | 0.00% | ||
| Central Asian Roma | 0 | 0.00% | 486 | 49 | 12 | 0.00% | 0.00% | ||
| Small Dagestan Peoples (SDP) | |||||||||
| Small Siberian Peoples (SSP) | |||||||||
| Other Ethnicity | 1,393,685 | 0.95% | 1.08% | ||||||
| Ethnicity not stated or no ethnicity | 17,136,960 | 11.64% | - | ||||||
Population pyramids
- Population pyramids of ethnicities within Russia in the 2021 census
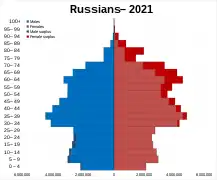 Russians
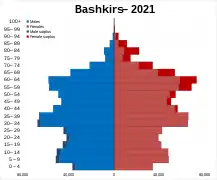 Bashkirs
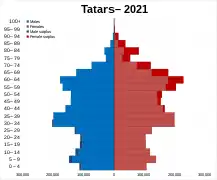 Tatars
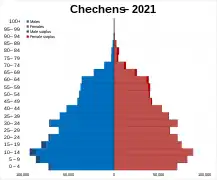 Chechens
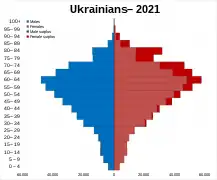 Ukrainians
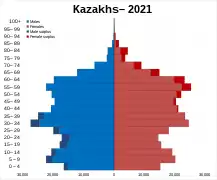 Kazakhs
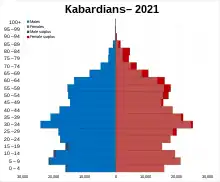 Kabardians
 Chuvash
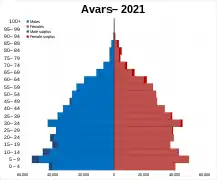 Avars
Avars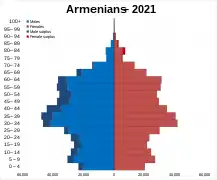 Armenians
 Crimean Tatars
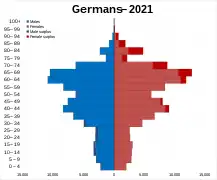 Germans
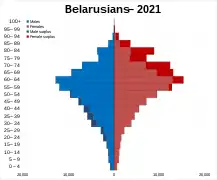 Belarusians
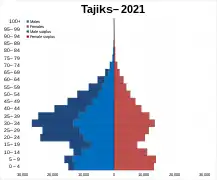 Tajiks
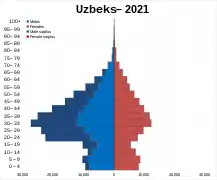 Uzbeks
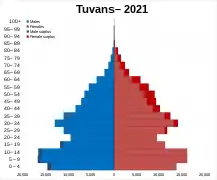 Tuvans
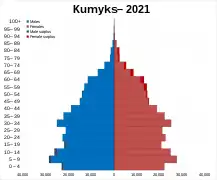 Kumyks
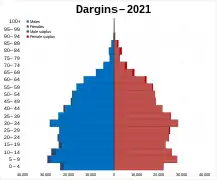 Dargins
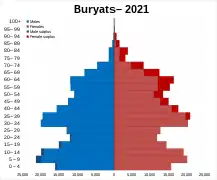 Buryats
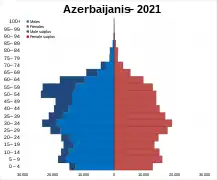 Azeribaijanis
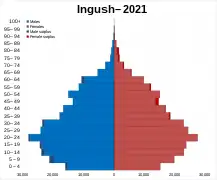 Ingush
 stated No ethnicity
Future projections
The ethnic demographic mix of the Russian Federation is projected to change far into the future. The majority population, ethnic Russians, who have been in slight decline since the 1950's will decline further due to a below replacement fertility rate and population ageing.[5] In 2010, rough population projections from Ivan Beloborodov projecting to 2030 estimated that the percentage of Russians within the population would decrease to around 70 to 60% of the total population.[6]
Language and culture
Although the constitution of Russia recognizes Russian as the official language, the individual republics may declare one or more official languages. Many of these subjects have at least two—Russian and the language of the "eponymous" nationality.[7] There is a minority language scene in most subjects of the country, with more than 1,350 newspapers and magazines, 300 TV channels and 250 radio stations in over 50 of these minority languages. Moreover, new legislation allows usage of minority languages in federal radio and TV broadcasting.
In 2007, there were 6,260 schools which provided teaching in 38 minority languages. Over 75 minority languages were taught as a discipline in 10,404 schools. The Ministers of Council of Europe has noted significant efforts to improve the supply of minority language textbooks and teachers, as well as a greater availability of minority language teaching. However, as Ministers has noted, there remain shortcomings in the access to education of a person(s) belonging to certain minorities.
There are more than 2,000 national minorities' public associations and 560 national cultural autonomies, however the Committee of Ministers has noted that in many regions, amount of state support for the preservation and development of minority cultures is still inadequate. There's a significant difference between "eponymous" ethnic groups and nationalities without their own national territory, as resources of the last are relatively limited.
| Language family | Population | Percentage |
|---|---|---|
| Slavic
(Russians, Ukrainians, Belarusians, Poles, Bulgarians, Serbs, Czechs, Rusyns, Slovaks, Croats, Macedonians, Slovenes, Bosnians, Montenegrins) |
106,709,884 | 81.72% |
| Turkic
(Tatars, Bashkirs, Chuvash, Kazakhs, Kumyks, Yakuts, Azerbaijanis, Uzbeks, Tuvans, Crimean Tatars, Karachays, Kyrgyz, Balkars, Turks, Nogais, Altai, Khakas, Turkmens, Shors, Gagauz, Dolgans, Nagaibak, Soyots, Meskhetian Turks, Kumandins, Uyghurs, Teleuts, Krymchaks, Karakalpaks, Tofalar, Crimean Karaites, Chulyms) |
11,287,749 | 8.64% |
| Caucasian
(Chechens, Avars, Dargins, Kabardians, Ingush, Lezgins, Laks, Tabasarans, Cherkess, Georgians, Adyghe, Abazins, Aghuls, Rutuls, Tsakhurs, Abkhazians, Udis, Shapsugs) |
5,642,353 | 4.32% |
| Uralic
Mordvins, Mari, Udmurts, Komi, Komi-Permyaks, Nenets, Karelians, Khanty, Mansi, Estonians, Finns, Vepsians, Selkups, Besermyan, Sami, Hungarians, Nganasan, Izhorians, Enets, Votians) |
1,649,635 | 1.26% |
| Armenian
(Armenians, Hemshins) |
948,254 | 0.73% |
| Iranian
(Ossetians, Tajiks, Yazidis, Kurds, Talysh, Afghans, Persians, Tat, Pamiris) |
897,403 | 0.69% |
| Mongolic
(Buryats, Kalmyks, Mongols) |
640,918 | 0.49% |
| Other | 2,811,168 | 2.15% |
Indigenous peoples
Russia is also home to a particular category of minority peoples, i.e. small indigenous peoples of the North and Far East, who maintain very traditional lifestyles, often in a hazardous climatic environment, while adapting to the modern world. After the fall of the Soviet Union, Russia passed legislation to protect rights of these small northern indigenous peoples.
Gil-Robles has noted agreements between indigenous representatives and oil companies, which are to compensate potential damages on peoples habitats due to oil exploration. As Committee of Ministers of Council of Europe noted in 2007,[8] despite some initiatives for development, the social and economic situation of numerically small indigenous peoples was affected by recent legislative amendments at the federal level, removing some positive measures as regards their access to land and other natural resources.[9]
Maps
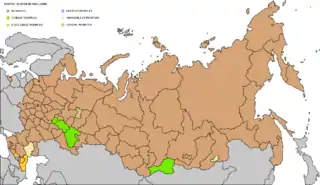 1989 ethnic map of Russia showing the largest ethnic group of each region or Republic; with brown as Russians, green as Turkic peoples
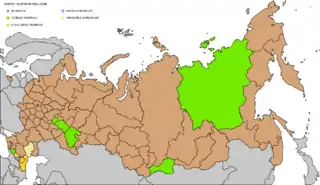 Ethnic map of Russia, 2010
 Largest ethnic group apart from Russians: yellow – Ukrainians, lawn green – Tatars, green – Kazakhs, orange – Armenians, blue – Buryats, gray-blue – Germans, pink – Koreans
 The largest two ethnic groups, excluding Russians, in each region (Census 2010)
 Distribution of Russians, 2010
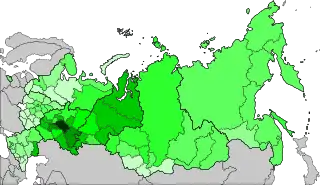 Distribution of Tatars, 2010
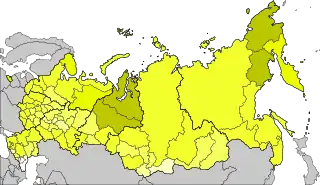 Distribution of Ukrainians, 2010
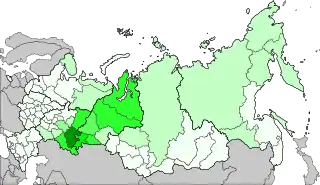 Distribution of Bashkirs, 2010
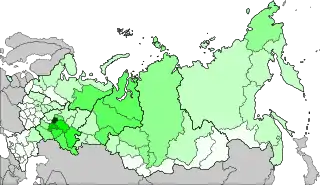 Distribution of Chuvashs, 2010
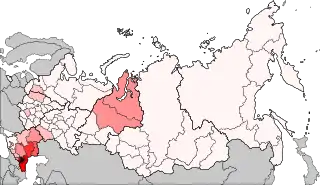 Distribution of Chechens, 2010
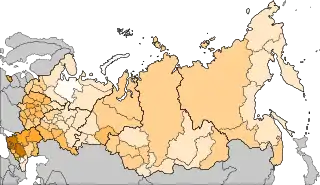 Distribution of Armenians, 2010
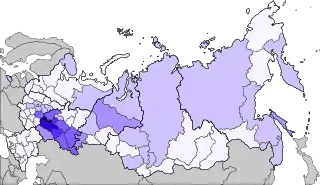 Distribution of Mordvins, 2010
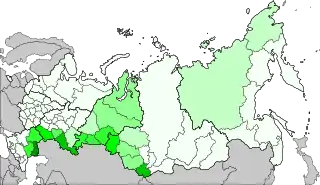 Distribution of Kazakhs, 2010
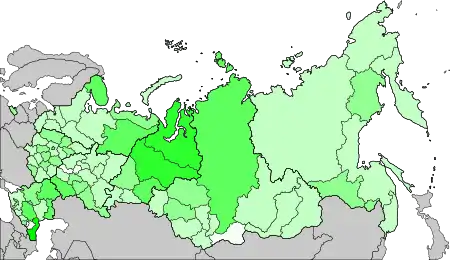 Distribution of Azerbaijanis, 2010
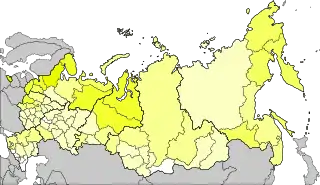 Distribution of Belarusians, 2010
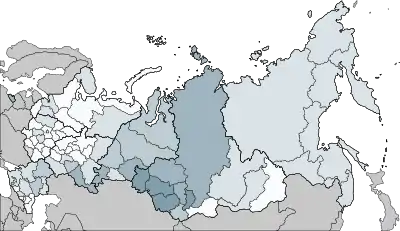 Distribution of Germans, 2010
See also
- Demographics of Russia
- List of ethnic groups in Russia
Indigenous peoples:
- Indigenous peoples of Siberia
- List of endangered languages in Russia
- List of extinct indigenous peoples of Russia
- List of larger indigenous peoples of Russia
- List of minor indigenous peoples of Russia
References
- "Результаты переписи населения 2021: буряты убывают, якуты возрастают". Золотая Орда — интернет-журнал (in Russian). Retrieved 2023-01-27.
- Demoskop Weekly No 543-544 Archived October 12, 2013, at the Wayback Machine
- Demoskop Weekly No 543-544 Archived October 12, 2013, at the Wayback Machine
- "Национальный состав населения". Federal State Statistics Service. Retrieved 30 December 2022.
- Chausovsky, Eugene (2021-02-09). "The City of Kazan and Russia's Non-Slavic Future". New Lines Magazine. Retrieved 2022-09-11.
- "Какова будет численность русских в ближайшие 10—20 лет?". 2012-01-06. Archived from the original on 6 January 2012. Retrieved 2022-09-11.
- "Definition of EPONYMOUS". www.merriam-webster.com. Retrieved 2022-05-20.
- "ADVISORY COMMITTEE ON THE FRAMEWORK CONVENTION FOR THE PROTECTION OF NATIONAL MINORITIES" (PDF).
- Alexseev, Mikhail A. (2016). "Backing the USSR 2.0: Russia's ethnic minorities and expansionist ethnic Russian nationalism". In Kolstø, Pål; Blakkisrud, Helge (eds.). The New Russian Nationalism: Imperialism, Ethnicity and Authoritarianism 2000–2015. Edinburgh University Press. pp. 160–191. ISBN 978-1-4744-1042-7. JSTOR 10.3366/j.ctt1bh2kk5.13. Retrieved 2022-05-20.
- (including Dolgans 1939–1959)
- (including Soyots 1939–1989)
- (including Besermyan 1939–1989)
- (including Komi-Permyak in 1939)
- (including Meskhetian Turks from 1926–1989)
- (in the Adyghe group from 1926–1939)
- (including Shapsugs 1926–1989 and Cherkess 1926–1939)
- (in Komi in 1939 census)
- (includes Caucasus Greeks)
- (including Enets, 1926–1979, and Nganasans, 1926–1939)
- (including Yazidis 1939–1989)
- (incl. Kereks 1926–1989 and Chuvans 1939–1979)
- (in Yakuts 1939–1959)
- (in Buryats 1939–1989)
- (in Turks 1926–1989)
- (in Udmurts 1939–1989)
- (in Adyghe 1926–1989)
- (including Taz 1926–1989)
- (in Chukchi 1939–1979)
- (in Nenets 1926–1939)
- (incl. Oroks 1970–1979)
- (in Orochs 1970–1979)
- (in Udege 1926–1989)
- (in Nenets 1926–1979)
- (in Chukchi 1926–1989)
External links
- Population by mother tongue and districts in 50 Governorates of the European Russia in 1897
- Human Rights problems in Russia: The situation of non-Russian Peoples
- Ethnic and National Minorities of the Russian Federation: A Diversity Based Curriculum for the Intermediate Russian Classroom
| Sovereign states |
|
|---|---|
| States with limited recognition | |
| Dependencies and other territories |
|
| |