Fylde (UK Parliament constituency)
Fylde (/faɪld/, FYLD) has been a constituency[n 1] in Lancashire which is represented in the House of Commons of the UK Parliament[n 2] since 2010 by Mark Menzies, formerly of the Conservative Party, but now an Independent after the whip was withdrawn in April 2024, with allegations he misused campaign funds.[2]
| Fylde | |
|---|---|
| County constituency for the House of Commons | |
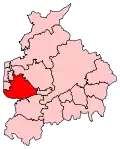 Boundary of Fylde in Lancashire for the 2010 general election | |
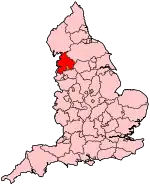 Location of Lancashire within England | |
| County | Lancashire |
| Electorate | 65,188 (December 2018)[1] |
| Major settlements | Kirkham, Wesham, Lytham St Annes, Freckleton |
| Current constituency | |
| Created | 1983 |
| Member of Parliament | Mark Menzies (Independent) |
| Seats | One |
| Created from | Fylde North and Fylde South |
| 1918–1950 | |
| Type of constituency | County constituency |
| Created from | Blackpool and Darwen |
| Replaced by | Fylde North and Fylde South |
History
The Fylde constituency was originally formed for the 1918 general election, but was abolished for the 1950 general election, when it was split into Fylde North and Fylde South. For the 1983 general election those two constituencies were merged to form a new Fylde constituency.
The seat was reduced in the boundary review leading to the 2010 United Kingdom general election, losing most of its elements from the Borough of Wyre and the City of Preston to the new seat of Wyre and Preston North.
Boundaries
1918–1945: The Urban Districts of Fleetwood, Kirkham, Longridge, Poulton-le-Fylde, Thornton, and Walton-le-Dale, the Rural District of Preston, and part of the Rural District of Fylde.
1945–1950: Part of the County Borough of Preston; the Municipal Borough of Fleetwood; the Urban Districts of Kirkham, Longridge, Poulton-le-Fylde, Thornton Cleveleys, Walton-le-Dale, and part of Fulwood; and, the Rural District of Fylde, and parts of Blackburn, and Preston.[3]
1983–1997: The Borough of Fylde, and the Borough of Preston ward of Preston Rural West.
1997–2010: The Borough of Fylde, the Borough of Preston wards of Ingol and Preston Rural West, and the Borough of Wyre ward of Great Eccleston.
2010–present: The Borough of Fylde, and the City of Preston ward of Lea.
The constituency has three main population centres, namely Kirkham/Wesham, Lytham St Annes and Freckleton. Kirkham, Wesham and Freckleton are small towns with some light industrial development and have a considerable Labour vote, but Lytham and St Annes are comfortable seaside resorts, favoured by families and retired couples, and along with the more rural parts of the seat, are safely Conservative.
Proposed
Further to the 2023 Periodic Review of Westminster constituencies, enacted by the Parliamentary Constituencies Order 2023, from the next general election, due by January 2025, the constituency will be composed of the following (as they existed on 1 December 2020):
- The Borough of Fylde.
- The Borough of Wyre wards of: Breck; Hardhorn with High Cross; Tithebarn.[4]
The constituency will be expanded to bring the electorate within the permitted range by transferring in the three Borough of Wyre wards which constitute the town of Poulton-le-Fylde, transferred from the (to be abolished) constituency of Wyre and Preston North. The small part currently in the City of Preston will be transferred to a revised Preston constituency.
Members of Parliament
MPs 1918–1950
| Election | Member[5] | Party | |
|---|---|---|---|
| 1918 | Wilfrid Ashley | Conservative | |
| 1922 | Edward Stanley | Conservative | |
| 1938 by-election | Claude Lancaster | Conservative | |
| 1950 | constituency split into Fylde North and Fylde South | ||
MPs since 1983
| Election | Member[5] | Party | |
|---|---|---|---|
| 1983 | Sir Edward Gardner | Conservative | |
| 1987 | Michael Jack | ||
| 2010 | Mark Menzies | ||
| 2024 | Independent | ||
Election results
Elections in the 2020s
| Party | Candidate | Votes | % | ±% | |
|---|---|---|---|---|---|
| Liberal Democrats | Mark Jewell[6] | ||||
| Majority | |||||
| Turnout | |||||
Elections in the 2010s
| Party | Candidate | Votes | % | ±% | |
|---|---|---|---|---|---|
| Conservative | Mark Menzies | 28,432 | 60.9 | +2.2 | |
| Labour | Martin Mitchell | 11,821 | 25.3 | -8.0 | |
| Liberal Democrats | Mark Jewell | 3,748 | 8.0 | +3.0 | |
| Green | Gina Dowding | 1,731 | 3.7 | +1.0 | |
| Independent | Andy Higgins | 927 | 2.0 | New | |
| Majority | 16,611 | 35.6 | +10.2 | ||
| Turnout | 46,659 | 69.8 | -0.9 | ||
| Conservative hold | Swing | +5.1 | |||
| Party | Candidate | Votes | % | ±% | |
|---|---|---|---|---|---|
| Conservative | Mark Menzies | 27,334 | 58.7 | +9.5 | |
| Labour | Jed Sullivan | 15,529 | 33.3 | +14.5 | |
| Liberal Democrats | Freddie Van Mierlo | 2,341 | 5.0 | +1.3 | |
| Green | Tina Rothery | 1,263 | 2.7 | −0.5 | |
| Majority | 11,805 | 25.4 | −5.0 | ||
| Turnout | 46,594 | 70.7 | +4.4 | ||
| Conservative hold | Swing | -2.5 | |||
| Party | Candidate | Votes | % | ±% | |
|---|---|---|---|---|---|
| Conservative | Mark Menzies | 21,406 | 49.1 | −3.1 | |
| Labour | Jed Sullivan | 8,182 | 18.8 | −0.9 | |
| UKIP | Paul White | 5,569 | 12.8 | +8.3 | |
| Independent | Mike Hill | 5,166 | 11.9 | New | |
| Liberal Democrats | Freddie van Mierlo | 1,623 | 3.7 | −18.4 | |
| Green | Bob Dennett | 1,381 | 3.2 | +1.7 | |
| Northern | Elizabeth Clarkson | 230 | 0.5 | New | |
| Majority | 13,224 | 30.3 | +0.2 | ||
| Turnout | 43,557 | 66.3 | 0.0 | ||
| Conservative hold | Swing | ||||
| Party | Candidate | Votes | % | ±% | |
|---|---|---|---|---|---|
| Conservative | Mark Menzies | 22,826 | 52.2 | −1.2 | |
| Liberal Democrats | Bill Winlow | 9,641 | 22.1 | +6.2 | |
| Labour | Liam Robinson | 8,624 | 19.7 | −5.9 | |
| UKIP | Martin Bleeker | 1,945 | 4.5 | New | |
| Green | Phillip Mitchell | 654 | 1.5 | New | |
| Majority | 13,185 | 30.1 | +2.7 | ||
| Turnout | 43,690 | 66.3 | +7.0 | ||
| Conservative hold | Swing | -2.5 | |||
Elections in the 2000s
| Party | Candidate | Votes | % | ±% | |
|---|---|---|---|---|---|
| Conservative | Michael Jack | 24,287 | 53.4 | +1.1 | |
| Labour | William Parbury | 11,828 | 26.0 | −4.8 | |
| Liberal Democrats | Bill Winlow | 7,748 | 17.0 | +2.2 | |
| Liberal | Tim Akeroyd | 1,647 | 3.6 | New | |
| Majority | 12,459 | 27.4 | +5.9 | ||
| Turnout | 45,510 | 60.1 | −0.8 | ||
| Conservative hold | Swing | +2.9 | |||
| Party | Candidate | Votes | % | ±% | |
|---|---|---|---|---|---|
| Conservative | Michael Jack | 23,383 | 52.3 | +3.4 | |
| Labour | John Stockton | 13,773 | 30.8 | −0.8 | |
| Liberal Democrats | John Begg | 6,599 | 14.8 | +0.2 | |
| UKIP | Lesley Brown | 982 | 2.2 | New | |
| Majority | 9,610 | 21.5 | +4.2 | ||
| Turnout | 44,737 | 60.9 | −12.0 | ||
| Conservative hold | Swing | ||||
Elections in the 1990s
| Party | Candidate | Votes | % | ±% | |
|---|---|---|---|---|---|
| Conservative | Michael Jack | 25,443 | 48.87 | −11.3 | |
| Labour | John Garrett | 16,480 | 31.65 | +13.1 | |
| Liberal Democrats | William L. Greene | 7,609 | 14.61 | −6.1 | |
| Referendum | David J. Britton | 2,372 | 4.56 | New | |
| Natural Law | Terry B. Kerwin | 163 | 0.31 | New | |
| Majority | 8,963 | 17.3 | |||
| Turnout | 52,069 | 72.9 | |||
| Conservative hold | Swing | ||||
| Party | Candidate | Votes | % | ±% | |
|---|---|---|---|---|---|
| Conservative | Michael Jack | 30,639 | 61.4 | +0.7 | |
| Liberal Democrats | Nigel Cryer | 9,648 | 19.3 | −4.9 | |
| Labour | Carol Hughes | 9,382 | 18.8 | +4.5 | |
| Natural Law | Peter Leadbetter | 239 | 0.5 | New | |
| Majority | 20,991 | 42.1 | +5.6 | ||
| Turnout | 49,908 | 78.5 | +1.5 | ||
| Conservative hold | Swing | +2.8 | |||
Elections in the 1980s
| Party | Candidate | Votes | % | ±% | |
|---|---|---|---|---|---|
| Conservative | Michael Jack | 29,559 | 60.7 | −2.2 | |
| Liberal | Elizabeth Smith | 11,787 | 24.2 | −0.1 | |
| Labour | Geoffrey Smith | 6,955 | 14.3 | +3.4 | |
| Restore Capital Punishment | Harold Fowler | 405 | 0.8 | −1.2 | |
| Majority | 17,772 | 36.5 | -1.9 | ||
| Turnout | 48,706 | 77.0 | +5.8 | ||
| Conservative hold | Swing | ||||
| Party | Candidate | Votes | % | ±% | |
|---|---|---|---|---|---|
| Conservative | Edward Gardner | 27,879 | 62.9 | ||
| Liberal | Elizabeth Smith | 10,777 | 24.3 | ||
| Labour | David King | 4,821 | 10.9 | ||
| Independent | Harold Fowler | 863 | 2.0 | ||
| Majority | 17,102 | 38.6 | |||
| Turnout | 44,340 | 71.2 | |||
| Conservative win (new seat) | |||||
Elections 1918–1945
Election in the 1940s
| Party | Candidate | Votes | % | ±% | |
|---|---|---|---|---|---|
| Conservative | Claude Lancaster | 37,930 | 61.36 | ||
| Labour | Edgar Hewitt | 22,102 | 35.75 | ||
| Common Wealth | Karl Edwin Heath | 1,784 | 2.89 | New | |
| Majority | 15,828 | 25.61 | |||
| Turnout | 61,816 | 70.60 | |||
| Conservative hold | Swing | ||||
Elections in the 1930s
| Party | Candidate | Votes | % | ±% | |
|---|---|---|---|---|---|
| Conservative | Claude Lancaster | 38,263 | 68.4 | -2.4 | |
| Labour | Mabel Tylecote | 17,648 | 31.6 | +2.4 | |
| Majority | 20,615 | 36.8 | -4.8 | ||
| Turnout | 55,911 | ||||
| Conservative hold | Swing | ||||
| Party | Candidate | Votes | % | ±% | |
|---|---|---|---|---|---|
| Conservative | Edward Stanley | 39,731 | 70.81 | N/A | |
| Labour | Thomas McNamee | 16,379 | 29.19 | New | |
| Majority | 23,352 | 41.62 | N/A | ||
| Turnout | 56,110 | 71.99 | N/A | ||
| Conservative hold | Swing | N/A | |||
| Party | Candidate | Votes | % | ±% | |
|---|---|---|---|---|---|
| Conservative | Lord Stanley | Unopposed | N/A | N/A | |
| Conservative hold | Swing | N/A | |||
Elections in the 1920s
| Party | Candidate | Votes | % | ±% | |
|---|---|---|---|---|---|
| Unionist | Edward Stanley | 29,894 | 64.7 | N/A | |
| Labour | Joseph Williamson | 16,318 | 35.3 | New | |
| Majority | 13,576 | 29.4 | N/A | ||
| Turnout | 46,212 | 74.9 | N/A | ||
| Registered electors | 61,702 | ||||
| Unionist hold | Swing | N/A | |||
| Party | Candidate | Votes | % | ±% | |
|---|---|---|---|---|---|
| Unionist | Edward Stanley | Unopposed | |||
| Unionist hold | |||||
| Party | Candidate | Votes | % | ±% | |
|---|---|---|---|---|---|
| Unionist | Edward Stanley | 16,510 | 55.5 | N/A | |
| Liberal | R. Parkinson Tomlinson | 13,230 | 44.5 | New | |
| Majority | 3,280 | 11.0 | N/A | ||
| Turnout | 29,740 | 76.1 | N/A | ||
| Registered electors | 39,090 | ||||
| Unionist hold | Swing | N/A | |||
| Party | Candidate | Votes | % | ±% | |
|---|---|---|---|---|---|
| Unionist | Edward Stanley | Unopposed | |||
| Unionist hold | |||||
Elections in the 1910s
| Party | Candidate | Votes | % | ±% | |
|---|---|---|---|---|---|
| C | Unionist | Wilfrid Ashley | 13,670 | 64.9 | |
| Labour | William John Tout | 7,400 | 35.1 | ||
| Majority | 6,270 | 29.8 | |||
| Turnout | 21,070 | 59.0 | |||
| Registered electors | 35,714 | ||||
| Unionist win (new seat) | |||||
| C indicates candidate endorsed by the coalition government. | |||||
See also
- List of parliamentary constituencies in Lancashire
Notes
- A county constituency (for the purposes of election expenses and type of returning officer)
- As with all constituencies, the constituency elects one Member of Parliament (MP) by the first past the post system of election at least every five years.
References
- England Parliamentary electorates Boundary Commission for England
- "Tory MP loses whip after claims he used party funds to pay 'bad people'". The Guardian. 17 April 2024. ISSN 0261-3077. Retrieved 18 April 2024.
- Craig, F.W.S., ed. (1972). Boundaries of parliamentary constituencies 1985-1972. Chichester, Sussex: Political Reference Publications. ISBN 0-900178-09-4.
- "The Parliamentary Constituencies Order 2023". Schedule 1 Part 5 North West region.
- Leigh Rayment's Historical List of MPs – Constituencies beginning with "F"
- "Liberal Democrat Prospective Parliamentary Candidates". Mark Pack. Retrieved 31 January 2024.
- "Statement of persons nominated" (PDF).
- Parliamentary Election 2017 Fylde Borough Council
- "Election Data 2015". Electoral Calculus. Archived from the original on 17 October 2015. Retrieved 17 October 2015.
- "Fylde". BBC News Online. Retrieved 8 May 2015.
- "Election Data 2010". Electoral Calculus. Archived from the original on 26 July 2013. Retrieved 17 October 2015.
- "Election Data 2005". Electoral Calculus. Archived from the original on 15 October 2011. Retrieved 18 October 2015.
- "Election Data 2001". Electoral Calculus. Archived from the original on 15 October 2011. Retrieved 18 October 2015.
- "Election Data 1997". Electoral Calculus. Archived from the original on 15 October 2011. Retrieved 18 October 2015.
- "Election Data 1992". Electoral Calculus. Archived from the original on 15 October 2011. Retrieved 18 October 2015.
- "UK General Election results April 1992". Richard Kimber's Political Science Resources. Politics Resources. 9 April 1992. Archived from the original on 16 January 2017. Retrieved 6 December 2010.
- "Election Data 1987". Electoral Calculus. Archived from the original on 15 October 2011. Retrieved 18 October 2015.
- "Election Data 1983". Electoral Calculus. Archived from the original on 15 October 2011. Retrieved 18 October 2015.
- The Liberal Year Book, 1930