Golden Valley County, Montana
Golden Valley County is a county located in the U.S. state of Montana. As of the 2020 census, the population was 823,[2] making it the third-least populous county in Montana. Its county seat is Ryegate.[3]
Golden Valley County | |
|---|---|
 Golden Valley County Courthouse in Ryegate, Montana | |
 Location within the U.S. state of Montana | |
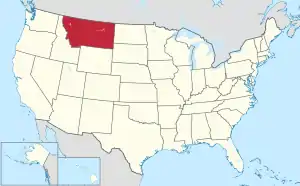 Montana's location within the U.S. | |
| Coordinates: 46°23′N 109°10′W | |
| Country | |
| State | |
| Founded | March 8, 1920[1] |
| Seat | Ryegate |
| Largest town | Ryegate |
| Area | |
| • Total | 1,176 sq mi (3,050 km2) |
| • Land | 1,175 sq mi (3,040 km2) |
| • Water | 1.0 sq mi (3 km2) 0.08% |
| Population (2020) | |
| • Total | 823 |
| • Estimate (2022) | 831 |
| • Density | 0.70/sq mi (0.27/km2) |
| Time zone | UTC−7 (Mountain) |
| • Summer (DST) | UTC−6 (MDT) |
| Congressional district | 2nd |
| Website | www |
| |
Geography
According to the United States Census Bureau, the county has a total area of 1,176 square miles (3,050 km2), of which 1,175 square miles (3,040 km2) is land and 1.0 square mile (2.6 km2) (0.08%) is water.[4] It is Montana's fifth-smallest county by area.
Major highways
 U.S. Highway 12
 Montana Highway 3
Adjacent counties
- Fergus County – north
- Musselshell County – east
- Yellowstone County – southeast
- Stillwater County – south
- Sweet Grass County – southwest
- Wheatland County – west
National protected area
- Lewis and Clark National Forest (part)
Politics
The county has usually favored Republican candidates. The 2016 Democratic candidate only received 71 county votes, the lowest ever for a major party in the county in a presidential election. The last Democrat to win there was Lyndon Johnson in his 1964 landslide victory.
| Year | Republican | Democratic | Third party | |||
|---|---|---|---|---|---|---|
| No. | % | No. | % | No. | % | |
| 2020 | 414 | 82.31% | 78 | 15.51% | 11 | 2.19% |
| 2016 | 365 | 77.00% | 71 | 14.98% | 38 | 8.02% |
| 2012 | 351 | 73.28% | 110 | 22.96% | 18 | 3.76% |
| 2008 | 343 | 69.72% | 124 | 25.20% | 25 | 5.08% |
| 2004 | 396 | 75.86% | 119 | 22.80% | 7 | 1.34% |
| 2000 | 405 | 76.27% | 88 | 16.57% | 38 | 7.16% |
| 1996 | 284 | 58.20% | 128 | 26.23% | 76 | 15.57% |
| 1992 | 192 | 38.71% | 142 | 28.63% | 162 | 32.66% |
| 1988 | 335 | 61.69% | 203 | 37.38% | 5 | 0.92% |
| 1984 | 384 | 64.00% | 211 | 35.17% | 5 | 0.83% |
| 1980 | 362 | 65.11% | 155 | 27.88% | 39 | 7.01% |
| 1976 | 302 | 53.08% | 255 | 44.82% | 12 | 2.11% |
| 1972 | 359 | 64.92% | 170 | 30.74% | 24 | 4.34% |
| 1968 | 332 | 60.04% | 194 | 35.08% | 27 | 4.88% |
| 1964 | 252 | 41.72% | 352 | 58.28% | 0 | 0.00% |
| 1960 | 362 | 56.65% | 277 | 43.35% | 0 | 0.00% |
| 1956 | 383 | 59.94% | 256 | 40.06% | 0 | 0.00% |
| 1952 | 471 | 70.40% | 198 | 29.60% | 0 | 0.00% |
| 1948 | 352 | 53.09% | 295 | 44.49% | 16 | 2.41% |
| 1944 | 395 | 59.67% | 266 | 40.18% | 1 | 0.15% |
| 1940 | 402 | 52.96% | 351 | 46.25% | 6 | 0.79% |
| 1936 | 331 | 40.32% | 474 | 57.73% | 16 | 1.95% |
| 1932 | 423 | 46.38% | 469 | 51.43% | 20 | 2.19% |
| 1928 | 625 | 63.91% | 346 | 35.38% | 7 | 0.72% |
| 1924 | 422 | 37.88% | 118 | 10.59% | 574 | 51.53% |
| 1920 | 1,185 | 72.57% | 381 | 23.33% | 67 | 4.10% |
Demographics
| Census | Pop. | Note | %± |
|---|---|---|---|
| 1930 | 2,126 | — | |
| 1940 | 1,607 | −24.4% | |
| 1950 | 1,337 | −16.8% | |
| 1960 | 1,203 | −10.0% | |
| 1970 | 931 | −22.6% | |
| 1980 | 1,026 | 10.2% | |
| 1990 | 912 | −11.1% | |
| 2000 | 1,042 | 14.3% | |
| 2010 | 884 | −15.2% | |
| 2020 | 823 | −6.9% | |
| 2022 (est.) | 835 | [6] | 1.5% |
| U.S. Decennial Census[7] 1790–1960[8] 1900–1990[9] 1990–2000[10] 2010–2020[2] | |||
2020 census
As of the 2020 census, there were 823 people living in the county.
2010 census
As of the 2010 census, there were 884 people, 363 households, and 239 families residing in the county. The population density was 0.8 inhabitants per square mile (0.31/km2). There were 476 housing units at an average density of 0.4 per square mile (0.15/km2). The racial makeup of the county was 94.0% white, 1.0% American Indian, 0.7% Asian, 2.1% from other races, and 2.1% from two or more races. Those of Hispanic or Latino origin made up 3.5% of the population. In terms of ancestry, 38.9% were German, 19.5% were English, 18.4% were Irish, 10.1% were Polish, 9.0% were American, 7.3% were Danish, 6.4% were Dutch, and 6.2% were Norwegian.
Of the 363 households, 20.7% had children under the age of 18 living with them, 55.4% were married couples living together, 5.2% had a female householder with no husband present, 34.2% were non-families, and 29.5% of all households were made up of individuals. The average household size was 2.19 and the average family size was 2.68. The median age was 48.8 years.
The median income for a household in the county was $35,726 and the median income for a family was $48,750. Males had a median income of $33,750 versus $27,938 for females. The per capita income for the county was $19,319. About 3.4% of families and 10.9% of the population were below the poverty line, including 21.7% of those under age 18 and 5.8% of those age 65 or over.
Communities
Towns
- Lavina
- Ryegate (county seat)
Census-designated place
- Golden Valley Colony
See also
- List of lakes in Golden Valley County, Montana
- List of mountains in Golden Valley County, Montana
- National Register of Historic Places listings in Golden Valley County, Montana
References
- About Golden Valley County
- "State & County QuickFacts". United States Census Bureau. Retrieved April 23, 2023.
- "Find a County". National Association of Counties. Retrieved June 7, 2011.
- "2010 Census Gazetteer Files". United States Census Bureau. August 22, 2012. Archived from the original on December 5, 2014. Retrieved November 28, 2014.
- Leip, David. "Atlas of US Presidential Elections". uselectionatlas.org. Retrieved February 21, 2021.
- "Annual Estimates of the Resident Population for Counties: April 1, 2020 to July 1, 2022". United States Census Bureau. Retrieved April 23, 2023.
- "U.S. Decennial Census". United States Census Bureau. Retrieved November 28, 2014.
- "Historical Census Browser". University of Virginia Library. Retrieved November 28, 2014.
- "Population of Counties by Decennial Census: 1900 to 1990". United States Census Bureau. Retrieved November 28, 2014.
- "Census 2000 PHC-T-4. Ranking Tables for Counties: 1990 and 2000" (PDF). United States Census Bureau. Archived (PDF) from the original on March 27, 2010. Retrieved November 28, 2014.
- Barber, Golden Valley County MT Google Maps (accessed January 2, 2019)
- Belmont, Golden Valley County MT Google Maps (accessed January 2, 2019)
- Franklin, Golden Valley County MT Google Maps (accessed January 2, 2019)
- Lavina, Golden Valley County MT Google Maps (accessed January 2, 2019)
External links
Places adjacent to Golden Valley County, Montana | ||||||||||||||||
|---|---|---|---|---|---|---|---|---|---|---|---|---|---|---|---|---|
| ||||||||||||||||
Municipalities and communities of Golden Valley County, Montana, United States | ||
|---|---|---|
County seat: Ryegate | ||
| Towns |
| Golden Valley County map |
| CDP |
| |
| ||
Helena (capital) | |
| Topics |
|
| Society | |
| Regions |
|
| Largest cities | |
| Counties |
|